Microplastic Pollution in the Ambient Air of Surabaya, Indonesia
Corresponding author Email: dipareza@enviro.its.ac.id
DOI: http://dx.doi.org/10.12944/CWE.14.2.13
Copy the following to cite this article:
Syafei A. D, Nurasrin N. R, Assomadi A. F, Boedisantoso R, Microplastic Pollution in the Ambient Air of Surabaya, Indonesia. Curr World Environ 2019; 14(2).
DOI:http://dx.doi.org/10.12944/CWE.14.2.13Copy the following to cite this URL:
Syafei A. D, Nurasrin N. R, Assomadi A. F, Boedisantoso R, Microplastic Pollution in the Ambient Air of Surabaya, Indonesia. Curr World Environ 2019; 14(2). Available from: https://bit.ly/2I6AG93
Download article (pdf)
Citation Manager
Publish History
Select type of program for download
| Endnote EndNote format (Mac & Win) | |
| Reference Manager Ris format (Win only) | |
| Procite Ris format (Win only) | |
| Medlars Format | |
| RefWorks Format RefWorks format (Mac & Win) | |
| BibTex Format BibTex format (Mac & Win) |
Article Publishing History
| Received: | 29-04-2019 |
|---|---|
| Accepted: | 03-06-2019 |
| Reviewed by: | 
 Sheila Dewi Ayu Kusumaningtyas
|
| Second Review by: |

 Nurul Rizki Nur Asrin
|
| Final Approval by: | Dr. Gopal Krishan |
Introduction
Microplastic pollution has a global distribution. Microplastics were listed as one of the ten emerging issues in the United Nations Environment Programme (UNEP).1 Microplastics are plastic particles less than 5 mm in length.2Their small size can make it easy for organisms to digest them.3 Microplastics in the air will be inhaled and subsequently enter the airway.4 Thus, organisms are also potentially exposed to related toxic chemicals, such as organic pollutants, heavy metals and other materials, which are absorbed by the microplastics from the surrounding environment.5
Some studies have found large amounts of fiber in the atmosphere. It is estimated that 29% of these fibers contain at least fragments of plastic polymers.6Microplastics have been identified as an important factor in the loss of biodiversity3and pose a potential threat to human health and activities.7
Plastic particles in the environment can come from several sources, including the destruction of natural plastic waste via mechanical wave actions, photooxidation resulting from sunlight, direct disposal of industrial products, fibers from synthetic fabrics, worn tires from cars or motorcycles and ingredients used in cosmetics.8Microplastic pollution may come from intentionally produced microplastics, from indoor and outdoor activities, waste management releases, waste recycling, littering and activities at sea such as from fishing net. In urban areas, the most important sources of microplastics are road wear and tire abrasion, with almost 13,000 tons emitted every year in Sweden alone (using 0.05 gr/km of rubber as an emissions factor, reported by Gustavsson.9 For road and pedestrian users, exposures to microplastics may lead to increased health concerns.
Emissions from industry, particle resuspensions and other anthropogenic causes, such as urban traffic, are potential sources of microplastics in the air.10 Researchers studying storm water runoffs from Norwegian and Swedish cities found that they are substantial sources of a wide range of traffic-related pollutants.11,12 City dust in urban runoff is known to be a significant source of water pollution. A substantial portion of the constituents of city dust comes from polymer-based materials, such as tires, which are considered to be microplastics.13 Vehicles driving on a road experience friction, pressure and heat, causing the vehicles’ tires to wear out and emit plastic dust. If it is blown into the air, the dust can contribute to a decrease in air quality, and, if it is carried by rain to sewers, rivers and so on, it is likely to be consumed by the biota in the waters, such as shellfish, which can affect the human food chain.14
In recent years, there has been a lot of research conducted on microplastic pollution in the environment, but these works have focused on the aquatic environment.15No microplastic pollution studies have been done on the air in Indonesia.Surabaya City is the second largest city in Indonesia and has a very large population of more than two million peoples. Its growth includes industry and vehicles very largest every year.16 Its increasing population has resulted in increased activities, including traffic activities. This increased traffic activity in Surabaya has resulted in a decrease in air quality in roadside areas. Therefore, research on the microplastic pollution in ambient air needs to be done to determine the amount, shape and composition of microplastics in ambient air in the roadside areas of Surabaya City.
Materials and Methods
Study area
Sampling was carried out on three (3) streets in the city of Surabaya. Site 1 (7016’37”S 112044’28”W) was located on Urip Sumoharjo Street, Site 2 (7017’33”S 112043’43”W) was on Mayjend Sungkono Street, and Site 3 was on Embong Malang Street (7015’35”S 112044’10”W) (Figure 1). Urip Sumoharjo Street was selected to represent a road with high traffic volume (225,087 units/day), Mayjend Sungkono Street was selected to represent a road with medium traffic volume (132,066 unit/day) and Embong Malang Street was selected to represents a road with low traffic volume (98,017 units/day).16
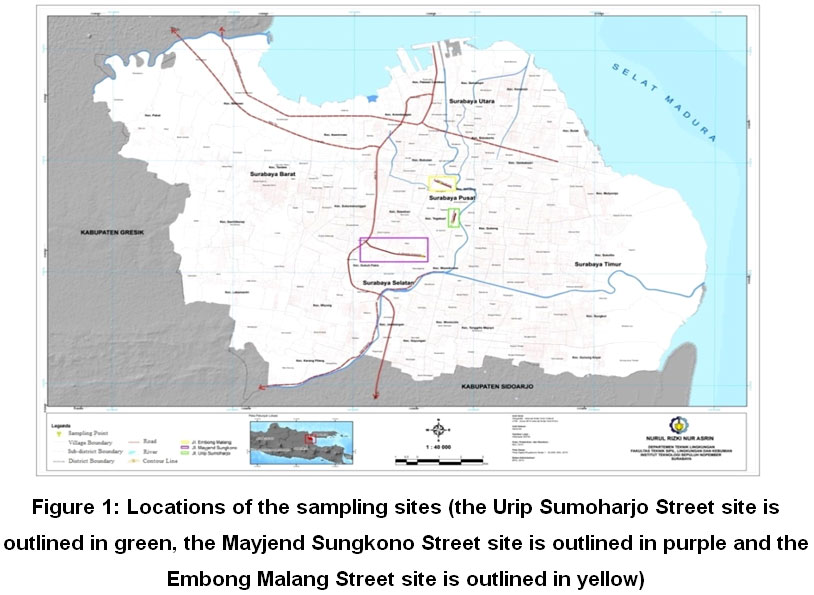 |
Figure 1: Locations of the sampling sites (the Urip Sumoharjo Street site is outlined in green, the Mayjend Sungkono Street site is outlined in purple and the Embong Malang Street site is outlined in yellow) Click here to view Figure |
Sampling and pre-treatment
Air sampling was carried out twice on weekdays. The first sampling was carried out over three (3) working days from 06.00 - 19.00 (Period I), and the second sampling took place over on a working day from 06.00 - 12.00 (Period II).The sampling ceased whenever it rained.
The sampling devices consisted of stainless steel 1000 mL funnels, GF/A Whatman filters (each with a porosity of 1.6 μm and a diameter of 47 mm) and vacuum pumps (Vacuubrand pumps) with flows of 207.38 mL/min (for Period I) and 446.93 mL/min (for Period II). The air was sucked through the filter media into the stainless steel funnel using the vacuum pump in such a manner that particles collect on the surface of the filter media. The filters were weighed before and after sampling using digital scales. The number of particles accumulated in each filter during a period was determined gravimetrically.
The devices were placed on each roadside at a height of 1.2 m above ground level (a standard height used to correspond to the breathing height of an adult).17 Each device was placed according to the dominant wind direction in its location to estimate the direction of the pollutant source.
Visual observations andFourier Transform Infrared(FTIR) analysis
After field sampling, the filters and funnel devices were rinsed with distilled water. The filters were observed visually under a digital microscope (Dino-Lite AM3113T) equipped with a software program DinoCapture 2.0.18,19 Microscopic observation was carried out to study the quantities and physical forms of the microplastics in the collected samples. Particles suspected of being microplastics were sorted and studied. The number of microplastic particles was calculated for each filter, and the microplastics were categorized based on their sizes and shapes. The amount of microplastics present was expressed as the number of particles/m3.6
Particles that were separated from the filter were randomly selected for FTIR analysis.18,20FTIR analysis using FTIR Thermo Fisher Scientifics Nicolet iS10. The composition of each sample was obtained by interpreting the spectrum of the functional groups outputted by FTIR analysis. The resulting spectra would be compared with the databases offered by Thermo Fisher Scientifics Nicolet.
Results and Discussion
Microscopic observations showed that, of the three study locations, Urip Sumoharjo Street had the most microplastics (174.97 particles/m3 and 130.50 particles/m3 for Periods I and II, respectively) and Embong Malang street had the fewest microplastics found during the study (94.69 particles/m3 and 55.93 particles/m3 for Periods I and II, respectively) (Figure 2). This result was expected since ​​Urip Sumoharjo Street was more congested than Embong Malang Street.16
There were three basic shapes of microplastics discovered. The microplastic shapes found at the research locations on Urip Sumoharjo Street and Mayjend Sungkono Street consisted of fibers, fragments and film, whereas on Embong Malang Street, only the type of fiber was found (Table 1). The shapes of the microplastics are shown in Figure 3. No pellets were found at the research sites since, according to Kingfisher, pellets are primary microplastics that are produced directly by factories as a raw material for making plastic-based products.21 Based on the research results, the fiber was the dominant shape found at each research site. This finding is similar to the results of Dris et al., where it was determined via visual inspection that fiber was the dominant microplastic shape in the ambient air.6
The amount and sizes of the microplastics found at each research site were different. Urip Sumoharjo Street’s dominant fibers had sizes ranging from 1000–1500 (µm) (Figure 4).
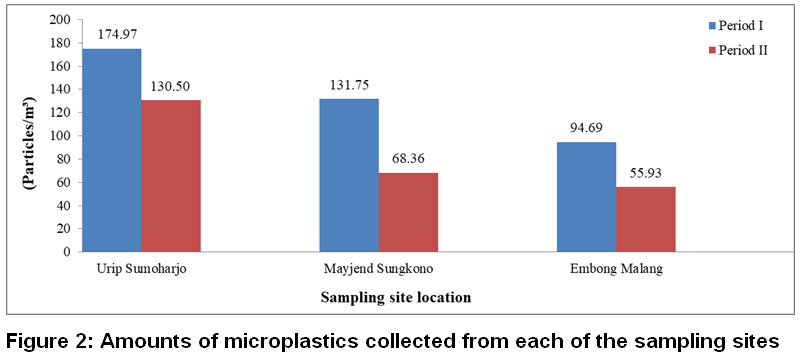 |
Figure 2: Amounts of microplastics collected from each of the sampling sites Click here to view Figure |
Table 1. Amounts of polymers collected from each site in Surabaya City
|
Site |
Period |
Shape |
Total (Items) |
Amount* (Particles/m³) |
|||
|
Fiber |
Fragment |
Film |
Pellet |
||||
|
Urip Sumoharjo |
I |
83 |
1 |
1 |
0 |
85 |
174.97 |
|
II |
20 |
0 |
1 |
0 |
21 |
130.50 |
|
|
Mayjend Sungkono |
I |
62 |
1 |
1 |
0 |
64 |
131.75 |
|
II |
10 |
1 |
0 |
0 |
11 |
68.36 |
|
|
Embong Malang |
I |
46 |
0 |
0 |
0 |
46 |
94.69 |
|
II |
9 |
0 |
0 |
0 |
9 |
55.93 |
|
*The amounts of microplastics are expressed in the number of particles/m3.
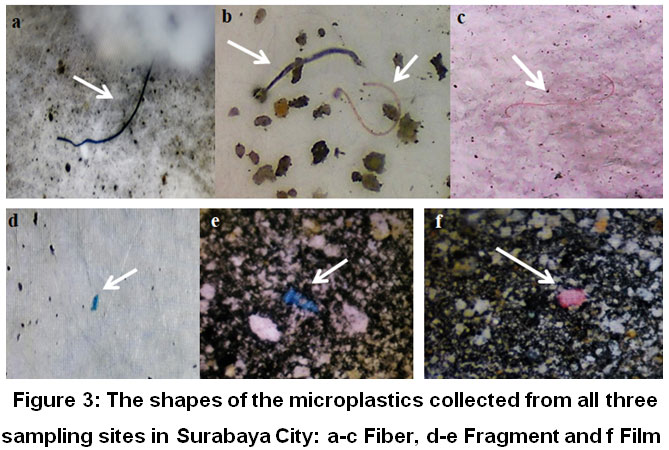 |
Figure 3: The shapes of the microplastics collected from all three sampling sites in Surabaya City: a-c Fiber, d-e Fragment and f Film Click here to view Figure |
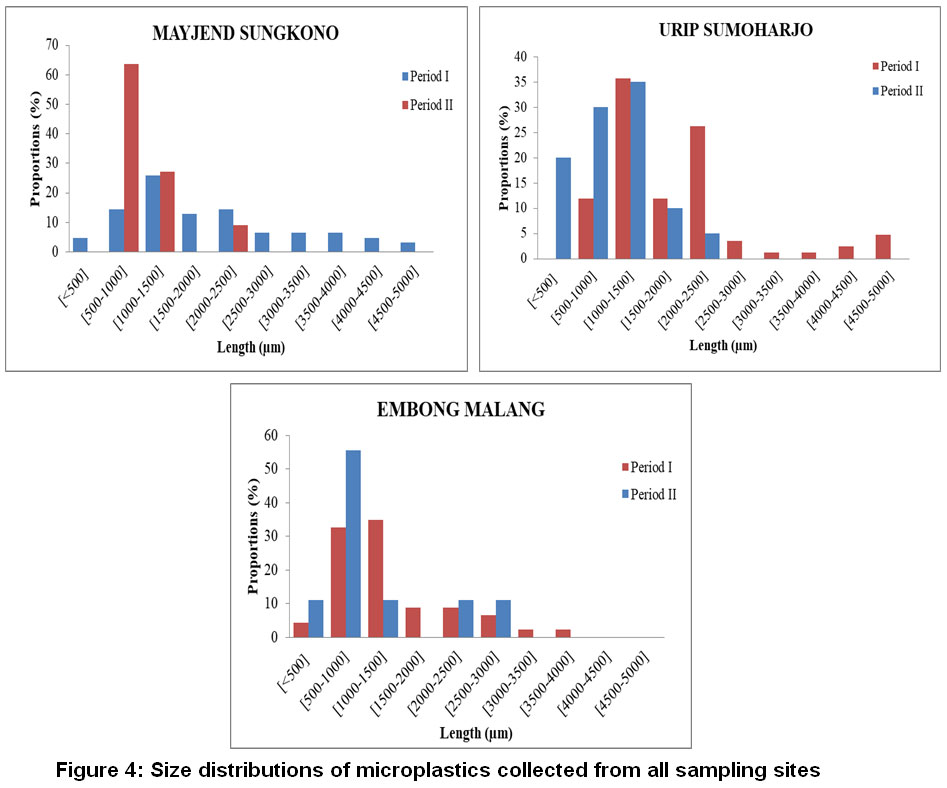 |
Figure 4: Size distributions of microplastics collected from all sampling sites Click here to view Figure |
The microplastic compositions in the samples obtained from the research sites is analyzed by FTIR testing. The FTIR test results showed that the microplastic particles identified included portions of plastic polymers. The types of polymers identified were polyester (Figure 5a), polyethylene-terepthalate (PET) (Figure 5b) and cellophane (Figure 5c). The majority of the polymers were cellophane (58.3%). Polyethylene-terephthalate (PET), and polyester which are used widely in the textile industry. In addition, polyester is also often used when making vehicle tires.22 The cellophane polymer is a polymer made from regenerated cellulose and is used in packaging various types of food, the clothing industry, the fiberglass industry and the rubber industry. Vehicle tires are also composed of synthetic rubber.22 Hence, most of the particles identified in the roadside areas might be mainly derived from synthetic textiles and the erosionof synthetic rubber tires.
Microplastics in the air can contribute to microplastic contamination of the soil and aquatic environments. A study states that microplastic particles in the atmosphere can be transported by wind to the aquatic environment or stored on the surface of the city,23 then deposited or carried away to the aquatic environment through runoff.14 Such contamination can affect organisms, including humans. According to Gasperi et al.,24 some inhaled microplastic fibers will settle in the lungs and cause biological responses, including inflammation.Further, a study also reported that microplastic particles consumed by an organism can cause a variety of effects, including serving as intestinal barriers.25The result research by Dehghani et al.,26 reported that microplastic particles in urban dust stored in the city of Tehran were 88–605 microplastic particles/30 grams of dust (3–20 particles/dust), with particles sizes of 250 μm to 500 μm. Some studies also show large amounts of fiber found in ambient air containing at least part of plastic polymers.6 Microplastic particles in ambient air can enter the human airways which can be harmful to health. Therefore, people along the roadside areas of Surabaya City face potential health complications.
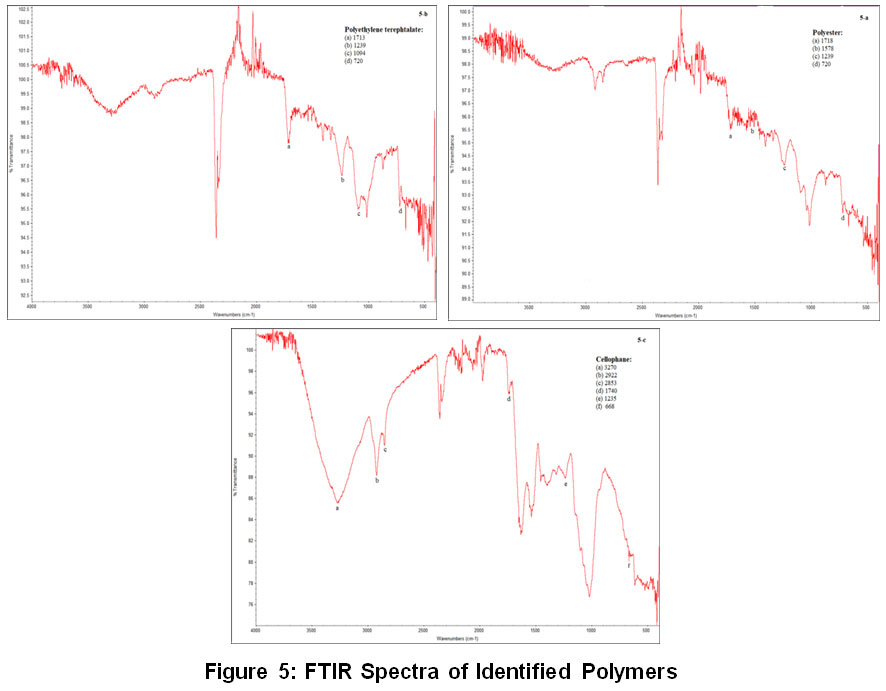 |
Figure 5: FTIR Spectra of Identified Polymers Click here to view Figure |
Conclusions
This paper show that microplastics are present in the ambient air of roadside areas. In this study, it was found that the dominant microplastic shape in the ambient air of roadside areas is fiber, with microplastic particles identified as containing portions of plastic polymers. The traffic volume affects the number of microplastic particles in the ambient air of a roadside area. A greater number of vehicles will increase the number of microplastic in ambient air. The clothing from road users and the tire wear of vehicles contribute to the number of microplastic in the ambient air in roadside areas.
The microplastic fibers in the air can be ingested and inhaled by humans. There is currently no available data or information which provides evidence of the potential human health effects of ingested or inhaled microplastics. Thus, further research is needed. Individual particles present in the PM2.5 to PM10 breathable particle fraction should also be investigated. Further research is also needed at other locations to determine the sources of the microplastics directly, be they tire wear from vehicles or clothing from road users
Acknowledgements
The authors wish to thank the Department of Environmental Engineering, Faculty of Civil,Environmental, and Geo Engineering, Institut Teknologi Sepuluh Nopember (ITS) for facility support during the study. We also wish to extend our appreciation and thank to the Directorate of Research and Community Services, Directorate General of Research and Development, Ministry of Research, Technology and Higher Education of the Republic of Indonesia for providing funding of the project under the umbrella of microplastic research project. We would like to express our thank to LembagaPengelolaan Dana Pendidikan (LPDP) consulting support for this paper.
References
- UNEP Division of Early Warning and Assessment. Emerging Issues in Our Global Environment. Plastic Debris in the Ocean. Nairobi (KE): United Nations Environment Programme (UNEP) Year Book 2014; 2014. www.unep.org. Accessed date: July, 2018.
- Tankovic M.S, Perusco V.S.J, Godrijan D, Pfannkuchen M. Marine plastic debris in the northeastern Adriatic. National Oceanic and Atmospheric Administration (NOAA). 2015; Book of abstracts. Programmatic environmental assessment (PEA) forthe NOAA Marine Debris Program (MDP). Maryland (US): NOAA. 2015; 168 p.
- Gall S.C and Thompson R.C. The impact of debris on marine life. Marine Pollution Bulletin. 2015; 92(1–2): 170. DOI: 10.1016/j.marpolbul.2014.12.041.
CrossRef - Kelly J.J, McCormick A, Hoellein T.J, Mason S.A, Schluep J. Microplastic is an abundant and distinct microbialhabitat in an urban river.Environmental Science and Technology. 2014; 48(20), 11863-11871.
CrossRef - Cai L, Wang J, Peng J, Tan Z, Zhan Z, Tan X, Chen Q. Characteristic of microplastics in the atmospheric fallout from Dongguan city, China: preliminary research and first evidence.Environmental Science and Pollution Research. 2017; 1-8. DOI: 10.1007/s11356-017-0116-x.
CrossRef - Dris R, Gasperi J, Mirande C, Mandin C, Guerrouache M, Langlois V, Tassin B. Synthetic fibers in atmospheric fallout: A source of microplastics in the environment? Marine Pollution Bulletin. 2016; 104 (1): 290-293. http://dx.doi.org/10.1016/j.marpolbul.2016.01.006.
CrossRef - Eerkes-Medrano D, Thompson R.C, Aldridge D.C. Microplastics in freshwater systems: a review of the emerging threats, identification of knowledge gaps and prioritisation of research needs. Water Research. 2015; 75: 63-82. DOI: 10.1016/j.watres.2015.02.012.
CrossRef - Tahir, A. Threats of Plastic Pollutants in the Safety of Food In the Sea (in Indonesia). May, 2018. http://repository.unhas.ac.id/bitstream/handle/123456789/10997/Artkel%20Plastik_Akbar%20Tahir.docx?sequence=1. Accessed date: August, 2018.
- Magnusson K, Eliasson K, Fråne A, Haikonen K. Swedish sources and pathways for microplastics to the marine environment. A Review of Existing Data. 2016. Number C183, March 2016.http://www.ivl.se/download/18.7e136029152c7d48c205d8/1457342560947/C183+Sources+of+microplastic_160307_D.pdf. Accessed date: August, 2018.
- Zubris K.A.V and Richards B.K. Synthetic fibers as an indicator of land application of sludge. Environment Pollution. 2005; 138, 201. DOI: 10.1016/J.ENVPOL.2005.04.013.
CrossRef - Norén, F. Survey of microscopic anthropogenic particles in Skagerrak. Pilot study October-November 2010. S. Institute of Marine Research.2010; 22 pag.
- Jartun M, Ottesen R.T, Steinnes E, Volden T. Run-off of particle bound pollutants from urban impervious surfaces studied by analysis of sediments from storm water traps. Science of The Total Environment. 2008; 396(2-3): 147-163. DOI: 10.1016/j.scitotenv.2008.02.002.
CrossRef - Verschoor A, Poorter L, Droge R, Kuenen J, Valk, E. Emission of microplastics and potential mitigation measures. RIVM Report. 2016-0026. www.rivm.nl. Accessed date: October, 2018.
- Sharon and Deirdre. Ten stealth microplastics to avoid if you want to save the oceans. 2018. http://theconversation.com/ten-stealth-microplastics-to-avoid-if-you-want-to-save-the-oceans-90063. Accessed date: December, 2018.
- Cole M, Lindeque P, Fileman E, Halsband C, Goodhead R, Moger J, Galloway T.S. Microplastic ingestion by zooplankton. Environmental Science Technology. 2013; 47: 6646-6655. DOI: http://dx.doi.org/10.1021/es400663f,130606145528005.
CrossRef - Transportation Agency of the Surabaya City Government. Surabaya, Indonesia: Surabaya City Traffic Performance Survey. 2017.
- Noguchi, M, Mizukoshi, A, Yanagisawa Y, Yamasaki A. Measurements of volatile organic compounds in a newly built daycare centre. International Journal of Environmental Research and Public Health. 2016; 13(7): 736. DOI: http://dx.doi.org/10.3390/ijerph13070736.
CrossRef - Qiu Q, Peng J, Yu X, Chen F, Wang J, Dong F. Occurrence of microplastics in the coastal marine environment: first observation on the sediment of China. marine pollution Bulletin. 2015; 98(1):274-280. DOI: https://doi.org/10.1016/j.marpolbul.2015.07.028.
CrossRef - Yu X, Peng J, Wang J, Wang K, Bao S. Occurrence of microplastics in the beach sand of the Chinese inner sea: the Bohai Sea. environment pollution. 2017; 214:722–730.DOI: 10.1016/j.envpol.2016.04.080.
CrossRef - Vianello A, Boldrin A, Guerriero P, Moschino V, Rella R, Sturaro A, Da Ros L. Microplastic particles in sediments of lagoon of Venice, Italy: first observations on occurrence, spatial patterns and identification. Estuarine, Coastal and Shelf Scince. 2013; 130:54–61. DOI: https://doi.org/10.1016/j.ecss.2013.03.022.
CrossRef - Kingfisher, J. Microplastic Debris Accumulation on Puget Sound beaches. Port Townsend Marine Science Center. 2011. http://www.ptmsc.org/Science/plastic_project/Summit%20Final%20Draft.pdf.
- OECD (Organisation for Economic Co-operation and Development). Nanotechnology and tyres: greening industry and transport. 2014. DOI: 10.1787/9789264209152-en.
CrossRef - Free C.M, Jensen O.P, Mason S.A, Eriksen M, Williamson N.J, Boldgiv B. High levels of microplastic pollution in a large, remote, mountain lake. Marine Pollution Bulletin. 2014; 85: 156-163. DOI: http://dx.doi.org/10.1016/j.marpolbul.2014.06.001.
CrossRef - Gasperi J, Stephanie L, Wright, Dris R, Collard F, Mandin C, Guerrouache M, Langlois V, Kelly F.J, Tassin B. Microplastics in air: Are we breathing it in? Environmental Science and Health. 2018; 1:1-5. DOI: https://doi.org/10.1016/j.coesh.2017.10.002.
CrossRef - Carpenter E.J, Anderson S.J, Harvey G.R, Miklas H.P, Peck B.B. Polystyrene spherules in coastal waters. Science. 1972; 178(4062): 749-750. DOI: 10.1126/science.178.4062.749.
CrossRef - Dehghani S, Moore F, Keshavarzi B, Beverley A.H. Health risk implications of potentially toxic metals in street dust and surface soil of Tehran, Iran. Ecotoxicology and Environmental Safety. 2017; 136: 92-103. DOI: https://doi.org/10.1016/j.ecoenv.2016.10.037.
CrossRef


