A Study of Change in Rainfall Pattern in Anand (middle Gujarat) in the last 60 years (1958-2017)
Kapil Mandloi1 , G.J. Kamani1 and S.S. Chinchorkar1 *
http://dx.doi.org/10.12944/CWE.14.1.11
Copy the following to cite this article:
Mandloi K, Kamani G. J, Chinchorkar S. S. A Study of Change in Rainfall Pattern in Anand (middle Gujarat) in the last 60 years (1958-2017). Curr World Environ 2019;14(1). DOI:http://dx.doi.org/10.12944/CWE.14.1.11
Copy the following to cite this URL:
Mandloi K, Kamani G. J, Chinchorkar S. S. A Study of Change in Rainfall Pattern in Anand (middle Gujarat) in the last 60 years (1958-2017). Curr World Environ 2019;14(1). Available from: https://bit.ly/2XXfjvI
Download article (pdf)
Citation Manager
Publish History


Introduction
India’s economy is dependent on the agricultural production, which in turn is dependent one of the monsoon rainfall and its distribution. The year to year fluctuation in rainfall as well as the fluctuation within the monsoon season governs the crop growth, development and yield. Earlier studies on rainfall probability in India have been carried by many workers (Singh et al., 2009; IMD, 2010 and Halikatti et al., 2010). Rainfall, the main driver of the hydrological cycle, has been varying in part of the world in various ways. Rainfall is the main source of water. But rainfall is scares and erratic in Gujarat, especially in Saurashtra region. So, its preservation and conservation have become the most important aspect in relation to water resources development planning. Its magnitude, variation and distribution play an important role in hydrological response of the area. The analysis of rainfall records for long period provides information about rainfall pattern and variability. And also rainfall studies are the utmost utility for understanding the nature and behaviour of climate change. (Solanki et.al.,)
Climate change is one of the main challenges in the world that is being studied by scientists and researchers. Rainfall is a key input in the management of agriculture and irrigation projects and any change in this variable can influence on sustainable management of western resources, agriculture and ecosystems. Mainly, studies of climate change science are focused on the probable changes in the annual series of a variable such as rainfall and variability of this is important for crop planning. Globally the averaged precipitation is projected to increase; both increases and decreases are expected at the regional scale.
The impact change on water resources has received much attention globally. The analysis of rainfall records for long period provides information about rainfall pattern and variability (Lazaro et al.,). The main objective of this paper is to analyse the rainfall data to study variation in rainfall pattern.
Material and Methods
Study Area
The rainfall at Anand (Middle Gujarat Agro-Climatic Zone-3) ranged between 286.9 mm to 1693.4 mm. The Rainfall variability (Annual and Seasonal) in Anand for the period 1958-2017 (60 years) were studied for their variability. The Anand (Middle Gujarat Agro-Climatic Zone-3) located (latitude - 220 35’ N, longitude- 720 58’ E) in Fig 1.
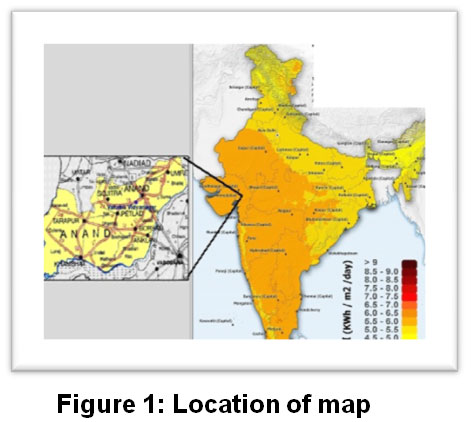 |
Figure 1: Location of map Click here to view Figure |
Data and Methodology
In this paper average of total mean rainfall (mm), maximum rainfall intensity of the month (mm/day) and rainy days data was used during 1958 – 2017 (60 years). The trend is determined by the relationship between the two variables as rainfall and time. The statistical method such as linear regression analysis and coefficient of determination R2 are used.
Result and Discussion
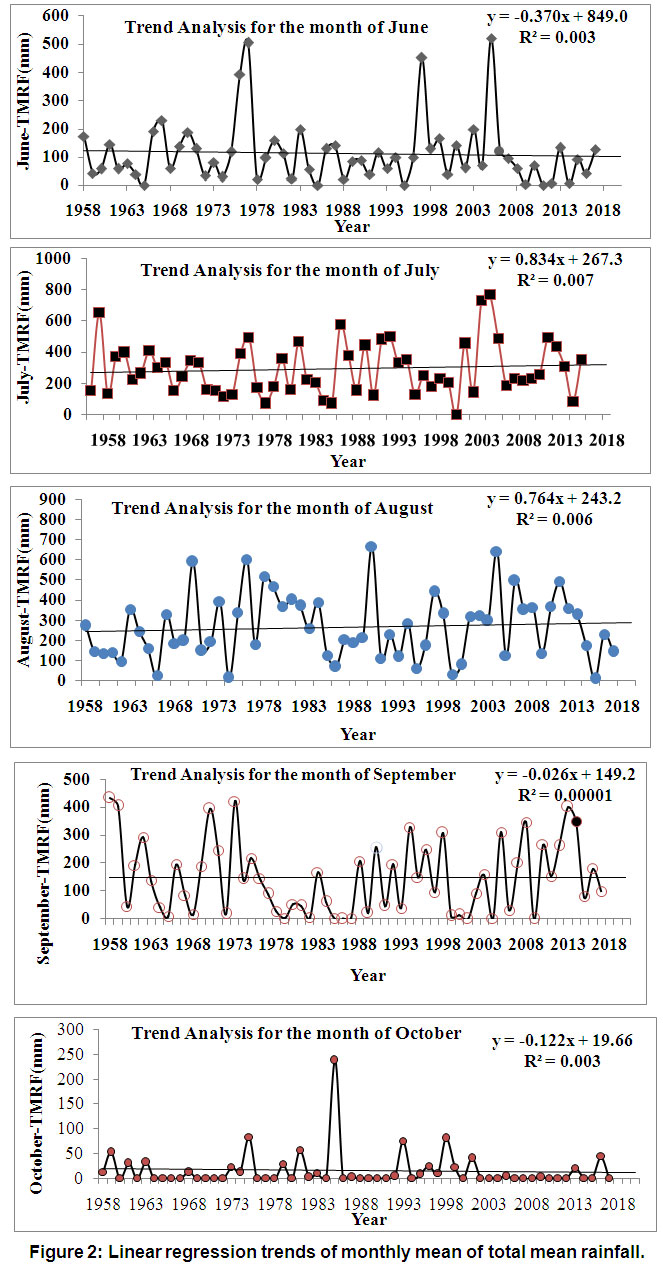 |
Figure 2: Linear regression trends of the monthly mean of total mean rainfall Click here to view Figure |
A. Trend Analysis of Monthly Mean of Total Mean Rainfall (TMRF)
The linear regression trends with their linear regression equations and coefficient of determinations for the months from June to October (Monsoon season) are represented in figure 2.
It is evident from figure 2 that the monthly mean of TMRF has increased significantly for the months June to October but in July and has increased by 50.04 mm during the last 60 years.
B. Trend Analysis of Annual Mean of total Mean Rainfall (TMRF) from figure 3, the annual mean of total mean rainfall observed an increasing trend having an increase of 0.877 mm per year. This implies that in Anand (middle Gujarat) annual rainfall has increased by 52.62 mm during the last 60 years.
 |
Figure 3: Linear regression trends of an annual mean of total mean rainfall Click here to view Figure |
 |
Figure 4: Linear regression trends of annual rainy days Click here to view Figure |
Trend Analysis of Annual Rainy Day
The trend for annual maximum rainfall intensity (mm/day) that Annual MRFI. Figure 4 indicates the trend for annual rainy days that Annual Rainy Day (RD) and time.
Monthly Rainfall Pattern
From table 1 and figure 5 indicate that rainfall variation for first 20 years (1958-1978) and second 20 years (1979-1999) are similar rainfall pattern whereas it differs for last decade (2000-2017) because of the change in magnitude however the overall trend is similar.
Table 1: Monthly rainfall variation for 1958-1978, 1979-1999 and 2000-2017
|
Month |
Monthly Average Rainfall(mm) |
||
|
1958-1978 |
1979-1999 |
2000-2017 |
|
|
June |
128.2 |
107.3 |
98.5 |
|
July |
283.9 |
274.3 |
324.9 |
|
August |
250.3 |
262.1 |
290.7 |
|
September |
177.5 |
106.5 |
163.3 |
|
October |
12.7 |
27.3 |
6.5 |
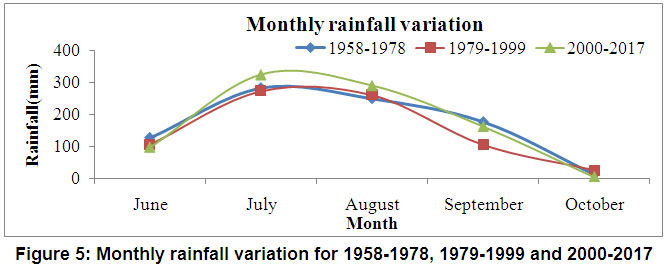 |
Figure 5: Monthly rainfall variation for 1958-1978, 1979-1999 and 2000-2017 Click here to view Figure |
Climate change is a continuous process but it is analyzed in this study that there is a significant change in rainfall over the last decade.
Conclusion
Long term data analysed for 60 years (1958-2017) annual data suggest that there is a significant change in rainfall over the last decade. However, annual rainfall is erratic with a wide range from 1693.4 mm maximum and 286.9 mm minimum in Anand(middle Gujarat). It observed total mean rainfall June to October but in July 50.04 last 60 years and annual rainy days decreased by 0.017 mm per year. From the average monthly rainfall analysis, it is observed that rainfall variation for first 20 years (1958-1978) and second 20 years (1979-1999) are similar rainfall pattern whereas it differs for last decade (2000-2017) because of the change in magnitude however the overall trend is similar. Average monthly rainfall analysis indicates there is maximum rainfall in the month of June and minimum rainfall in the month of October.
Acknowledgements
Authors are thankful to Head, Department of Agricultural Meteorology and IMD to providing data for this study.
References
- Halikatti, S.I., Potdar, M.P, Hiremathi, S.M. and Dineshkumar, S.P. (2010). Annual and seasonal rainfall variability at Dharwad, Karnataka J. Agrometetorol., 12(1):136-137
- IMD (2010). Long range forecast of south-west monsoon for 2010 issued on IMD’s website: www.imd.gov.in
- Lazaro R, Rodrigo FS, Gutierrez L, Domingo Fand Puigdefafregas J (2001), “Analysis of a 30-year rainfall record (1967-1997) in semi-arid SE Spain for implications on vegetation”, J. Arid Environ. 48: 373-395.
CrossRef - Singh, Mohan, Kumar Jayant and Bharadwaj, S.S. (2009).Rainfall probability during dormant and growing seasons of apple in Himachal Pradesh. J. Agrometetorol., 11(1): 47-50.
- Solanki, P.N., Shrimali, N. J., Gohil, K.B., "A Study of Change in Rainfall Pattern in Dhatarwadi Reservoir Catchment, Amreli, Gujarat” IJSRD - International Journal for Scientific Research & Development| 2014; Vol. 1: Issue 11.


