Sub-Surface Investigation Using Vertical Electrical Sounding: Chennai Metropolitan Area
J. Saravanan1
 , Kishan Singh Rawat 1
*
and Sudhir Kumar Singh 2
, Kishan Singh Rawat 1
*
and Sudhir Kumar Singh 2
1
Centre for Remote Sensing and Geo-Informatics,
Sathyabama Institute of Science and Technology, Jeppiaar Nagar,
Chennai,
600119
Tamil Nadu
India
2
K. Banerjee Centre of Atmospheric and Ocean Studies,
IIDS, University of Allahabad,
Allahabad,
21102
Uttar Pradesh
India
http://dx.doi.org/10.12944/CWE.13.3.06
Copy the following to cite this article:
Saravanan J, Rawat K. S, Singh S. K. Sub-Surface Investigation Using Vertical Electrical Sounding: Chennai Metropolitan Area. Curr World Environ 2018;13(3). DOI:http://dx.doi.org/10.12944/CWE.13.3.06
Copy the following to cite this URL:
Saravanan J, Rawat K. S, Singh S. K. Sub-Surface Investigation Using Vertical Electrical Sounding: Chennai Metropolitan Area. Curr World Environ 2018;13(3). Available from: https://bit.ly/2RrC8bc
Download article (pdf)
Citation Manager
Publish History

Introduction
Groundwater is becoming an increasingly scarce resource.1,2,3,4 With industrial and domestic water demand expected to double by 2050.5 competition among urban, peri-urban, and rural areas on groundwater resources is likely to increase. Increasing population and rapid urbanizationare already aggravating the demand on fresh water supply in the cities and it is expected to increase in future.6 The impact of climate change on precipitation patterns, river flows, and groundwater tables7 is likely to aggravate the groundwater resource availability, particularly in the urban context. On the contrary, the dependence on groundwater sources in urban centres is increasing many folds.8
Adadzi9 performed hydrogeological investigations and geophysical surveys are important methods in many subsurface characterization studies. This work examines the importance of geophysical surveys in the construction and development of boreholes to provide potable drinking water to rural communities. The paper discusses the interpretation of subsurface features that can be used to assist in the evaluation of groundwater resources in a typical rural area. Lack of infrastructure in these areas is a constraint on borehole drilling due to limited subsurface data availability. Further, they have estimated the depth of groundwater, aquifer geology, and recharge and discharge zones.
Vasantrao10 the area chosen for the study is Dhule district, which belongs to the drought-prone area of Maharashtra State, India. Dhule district suffers from a water problem, and therefore, there is no extra water available to supply for the agricultural and industrial growth. To understand the lithological characters in terms of its hydro-geological conditions, it is necessary to understand the geology of the area.
The geophysical assessment of groundwater in Awa-Ilaporu, near Ago Iwoye southwestern Nigeria was carried out with the aim of delineating probable areas of high groundwater potential. The area falls within the Crystalline Basement Complex of southwestern Nigeria which is predominantly underlain by banded gneiss, granite gneiss and pegmatite.11
Abdullahi12 have performed a groundwater exploration study in the rystalline rocks of Tudun Wada Kano State, Nigeria has been developed. The study area is located within the sedimentary rocks, igneous, and metamorphic with alluvial as common types of rocks. The VES results revealed heterogeneous nature of the subsurface geological sequence. The geological profile sequence in the study area includes the topsoil, weathered layer, fractured basement, and fresh basement.
Singh and Singh1 have identified the aquifer zone and subsurface lithology by geoelectrical resistivity method using Schlumberger configuration in parts of Naveda block, Kaushambi, Uttar Pradesh, India. Vertical electrical sounding (VES) was carried out at 50 locations to identify the suitable conditions of groundwater.
Ariyo and Banjo13 used the same method to study groundwater zone in a sedimentary terrain of Ilara-Remo, southwestern Nigeria. Their investigation involved the utilization of vertical electrical sounding (VES) technique with Schlumberger array system; applied in ten (10) stations and the results were interpreted using the spatial curve-matching method and computer-assisted iteration technique. Fadele14 also used vertical electrical sounding (VES) for groundwater exploration around Nigerian College of Aviation Technology, Zaria Kaduna State, Nigeria.
Mukherjee15 used the magnetic and resistivity surveys can further confirm subsurface aquifer configuration. Due to the heterogeneity of aquifer materials, it is essential to take a holistic approach that includes geological information supplemented with remotely sensed data and supported by resistivity and magnetic anomaly detection. This approach is used for locations of higher spectral reflectance and lineament density which are assumed to be areas of aquifer recharge. This investigation focused on the Aravali quartzite terrain of Delhi, India at the Research and Referral Hospital and Jawaharlal Nehru University areas. Suitable areas are identified for construction of check dams, roof-top rainwater harvesting pits, and drilling sites in the difficult terrain of the Aravali quartzite.
Application of conventional geophysical techniques in mapping urban groundwater aquifers is also limited due to urbanization. Hence alternate but appropriate methodologies need to be evolved in mapping the urban groundwater resources. The present study is one such attempt to explore a methodology to map the urban groundwater aquifers in the city of Chennai where the aquifer is heavily exploited for meeting the water requirements of the city.16
Reference made on the Geological Quadrangle Map (1:250,000 Scale) of the Madras Quadrangle covering part of Tamil Nadu and Andhra Pradesh and published by the Geological Survey of India, Kolkatta, indicates the presence of hard rock terrain in the south of Chennai. The hard rocks are classified under charnockite group of Achaeans comprises mainly of a thin band of pyroxene granulate occurring south of Saidapet and charnockite mainly in the rest of the areas. The charnockites trend in a north-east and south-western direction dipping towards east mainly at an angle varying from 60 to 70 degrees.
Reference was also made on the District Resource Map (1: 50,000 Scale) published by the Geological Survey of India, 2005 which covers the Chennai city area of 172 km2. The southern part of the city, to the south of Guindy Railway Station, falls in the hard rock terrain comprising mainly of charnockites of achaeans. The average depth of the bedrock in the city is reported to vary from 20 to 25 m.17 The bedrock is reported to slope towards the sea (east) In the western part of the city covering Saidapet, Saligramam, Kodambakkam, Arumbakkam, Anna Nagar and Villivakkam areas, it is covered by Inter distributary flood basin deposit comprising of sandy clay and black clay. The Paleo tidal deposits of marine origin comprising of Black Clay under sandy cover covers the areas of Theagarayanagar, Triplicane, Egmore, and Perambur. Further east, lays a thin strip of Tidal Flat deposits of marine origin comprising of Black clay. Gondwana sediments comprising of clay, shale, claystone with intermittent sandstone are reported to occur below the alluvial formation. Along the coast, beach deposits of medium grey-brown sand and sand flat deposits of aeolian origin are reported. In between the beach sand and Tidal Flat, Strand Flat deposits comprising of medium grey-brown sand is reported to occur.
The Central Ground Water Board(CGWB),18 Ministry of Water Resources, Government of India has published the Groundwater Resources and Development Prospects in Madras District, Tamil Nadu during March 1993. Later on, during November 2008, District Groundwater Brochure of Chennai district was published. The area covered under the study includes the erstwhile city area of 172 km2 and its surrounding areas. It covers, redhills lake in North, Guindy in South, Porur in west with the eastern boundary being the coast of Chennai city. As per the map published in the report, it is reported that the southern part is underlain by hard rock of Archaeans. The area surrounding the redhills lake is classified under the Gondwanas comprising of shale and clay with sandstone lenses. A thin strip of tertiaries is reported to the south of redhills lake comprising of shale clay and sandstone. The rest of the areas have been classified under alluvial formations of recent age. Isopach of alluvium thickness and depth to basement contour have been prepared based on borehole data. Both the reports give a fairly better overview of the thickness of sediments in each hydrogeological unit. Two sections Drawn along Mugappair to Thiruvanmiyur and Perambur to Tharamani gives the vertical disposition of the formations and the likely faulting and shear zones occurring within the city area.18
The earlier studies are either restricted to the city area and slightly beyond covering the core area of 172 km2. The vertical disposition of the formations have been spelt out in the report of CGWB covering the city area, but not so in the case of the rest of the study done earlier. The vertical and spatial distributions of hydrogeological formations, their yield characteristics are not available atleast in the public domain.
Study Area
The Chennai Metropolitan Area
Chennai – popularly termed as the Detroit of Indiafor its automobile industry - is the capital city of Tamil Nadu and is the fourth largest Metropolitan City in India. Chennai is one of the fastest growing cities in the world and the only Indian city to be rated in the “Forbes-Top 10 Fastest Growing Cities in the World”. It lies between with latitude 12°50'49" and 13°17'24", and longitude between 79°59'53" and 80°20'12". It is located on the Coramandal coast insouthern India. The Chennai Metropolitan Area comprising Chennai city and the contiguous area around was notified in 1974. It extends over 1189 km2 and includes Chennai City Corporation area, 16 Municipalities, 20 Special Village Panchayats (SVP’s) and 213 villages comprised in 10 Panchayat Unions (CMDA 2006).20 It is one of the preferred destinations for IT / ITES companies in India. Tamilnadu is the second largest software exporter in the country, and 90% of the export is contributed from Chennai. Figure 1 study area with sampling locations.
As per 2011 census (ORGCC),21 the population of Chennai city (426 km2) is 6.8 Million and that of the CMA is about 9 Million. The population density of the city is on the rise and it is 247/ha in 2001 and about 266 in 2011. The population of CMA in 2016 is 10 Million and in 2026 is 12.5 Million.22
The land use of Chennai City as published by the Chennai Metropolitan Development Authority (CMDA) is given in Figure2.
There has been a remarkable change in the land use of open space which got reduced by about 12% over a period of 25 years while comparing the land use of 1975 and 2001. At present, the parks and playgrounds in the city constitutes 0.6 % of the total area.
While it is understandable that such a change is likely to happen in the course of development in any city, the repercussion of such a change on the groundwater recharge will be alarming that too in a coastal city like Chennai which is under the threat of saline ingression. Data is not available for 5% of the land use during 1975 (Source: Development Plan for CMA 2006 page 19 table 4.2) and the details of the 13.75% land area classified under others in 2001. It is interesting to note that about 0.53% of the land use classified under agriculture in 2001 and no such classification reported in 1975.23
The area has one of the most well connected systems of roads to all the important towns and villages from the center of the city and between the various towns and villages in the state of Tamilnadu. The main railway lines between Chennai and Vijayawada, Chennai and Arakonam and Chennai and Villupuram pass through the metropolitan area. Besides the age-old suburban railway service between Tambaram and Beach stations, there are suburban railway services from Central station to Gummidipoondi and to Thiruvallur. The Mass Rapid Transit System (MRTS) is in operation between Beach and Velachery in the city limits and construction of the Chennai Metro Rail connecting the corners of the city area is in progress.
There are many Industrial Estates located in Guindy, Ambattur, Manali and Thirumazhisai. The Chennai Export Processing Zone (CEPZ), where many export oriented Industrial units are located, is situated near Tambaram to the west of the GST road. Besides these industrial states, the leather industries are concentrated in Pallavaram–Chromepet area, the automobile related industries are located in Padi and Sembium, and rubber, chemical and thermal units are located in Thiruvottiyur – Ennore – Attipattu belt. The TIDEL Software City promoted by the Government of Tamilnadu is located in Taramani. The IT Corridor developed along the Old Mahabalipuram road houses all major software companies of the country.
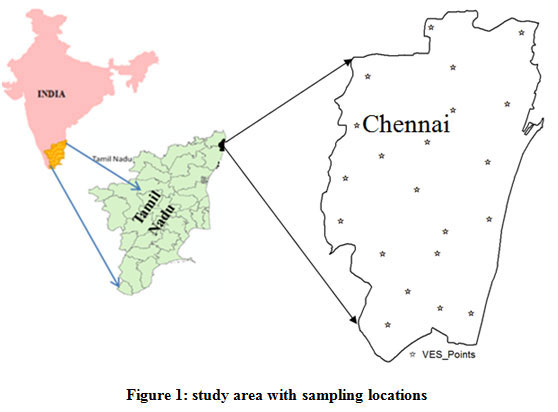 |
Figure 1: Study area with |
 |
Figure 2: Land use/land cover information of Chennai (Source: CMDA22). |
Geomorphology of Chennai metropolitan area
The eastern part of the area is coastal plain, which is covered by sand dune and sandy and loamy soil. Due to the rapid urbanization of the city, the old sand dunes and beach ridges have been covered by residential colonies. Wave cut cliffs are seen to the north of the Chennai port area, where the beach landform has been completely eroded. The worst affected area is near Ennore on the northern side, where it is subjected to coastal erosion. The western portion of the Metropolitan area has a gentle gradient with a regional easterly slope. Some mountain ridges near St.Thomas Mount,Pallavaram, Tambaram and Kundrathur can be seen.
The two important rivers that drain through the area are the Adyar River on the south and the Coovam River on the north. The Adyar river originates within the Metropolitan area to the west of Tambaram. It has a total length of around 42km before it joins the sea. The river has meager flow throughout the year, but it is flooded during the Northeast monsoon season when there are heavy spells of rainfall. Coovam river originates to the west of the Metropolitan area from the surplus waters of the Coovam tank in Thiruvallur district and discharges into the sea to the north of the Marina beach. The river, which is not polluted much till it enters the Chennai city limits, is highly polluted due to the discharge of untreated sewage. The Buckingham canal is a manmade channel originating in the north in Nellore district of Andhra Pradesh and drains through the Metropolitan area in a north-southdirection. This canal, which was earlier designed for the transportation of goods by boats from Nellore in the north to Marakkanam in the south, acts at present mostly as a sewage carrier. The Otterinalla originating near Annanagar in the city limits joins the Buckingham canal near Basin Bridge.
The important tanks in the Metropolitan area are the Redhills lake, the Cholavaram tank, Chembarambakkam tank and Porur tank. These tanks serve as major sources of drinking water for the Chennai city and many areas falling within the Metropolitan area. Many of the tanks like the Velachery tank and Ambattur tank are being encroached by residential areas or whatever water body is left is being polluted due to the disposal of sewage from the nearby residential colonies and industries.
Methods
Deciphering the subsurface in an urban context using conventional geophysical methods such as Electrical Resistivity Profiling and Vertical Electrical Soundings is a difficult task as most of the areas have been urbanized. Conducting surveys to desired depths to study the subsurface variations become next to impossible in such areas. In Chennai, almost every household has groundwater source either in the form of open well and borewell.8,24 These are constructed through the local drillers through rotary and compressor drilling rigs. During the boreholes drilling the drillers do not keep the systematic records of lithology in Chennai except for a very few. However, in the case of geotechnical investigations, it is carried out.
As the nomenclature adopted in geotechnical reports differ from the conventional hydrogeological terms, the collated data was cleaned, in order to adopt a uniform nomenclature in recording the borehole lithologs. The locations were then geocoded using the open source Google Earth. The data was then cross checked with other secondary data and cleaned to avoid misrepresentation of sub stratum. For quality check, the data was shared with experienced hydrogeologists who earlier worked in Chennai and their inputs, corrections and suggestions were obtained and incorporated wherever it was found relevant. The data was then integrated using Geographical Information System to evolve the hydrogeological map of Chennai Metropolitan Area.
Areas exposed with crystalline rocks with thin soil cover are classified as hard rock terrain of archaeans. Along the coastal area where it comprises of coastal alluvium of Aeolian origin overlying unconfirmably over the crystallines, it is classified as alluvium over lying hard rock; similarly along the course of Adyar river on its either sides, a strip of 4 – 5km also comprises of alluvial formation overlying the hard rock’s; these are also grouped under alluvium over lying hard rock. In the northern part of CMA to the north and south of Coovam river, the alluvium overlies the Gondwana and Tertiary group of rocks; this area is classified as alluvium Overlying Gondwana and Tertiary. To the west of CMA, where the Gondwana are exposed and in the north - west where the tertiary group of rocks occur, it has been classified as Gondwana and Tertiary respectively. The alluvium thickness is represented in the alluvium isopach prepared for the Chennai Metropolitan Area. The updated land use/land cover statistics has been shown in figure 2.
Vertical Electrical Sounding (VES)
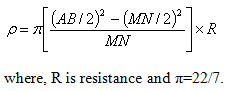
Electromagnetic (EM) field is generated by passing an alternate current (AC=I) through a wire transmitter or coil. If there is conductive medium in the ground, magnetic component of the EM wave induces eddy I in the conductor. The eddy I produce a secondary EM field which is detected by the receiver. The Schlumberger array or configuration was adopted. Applying current I to the ground through two I electrodes (A and B) and then measuring the resultant potential difference (ΔV) between two V electrodes (M and N). I electrode spread of AB/2 was varied from 1 to a maximum of 75m. The expected depth of investigation was 0.125×L, where L= AB/2, and AB, I electrode separation length. Observed field data (AB/2 and MN/2) were converted to apparent resistivity values. The apparent resistivity (ρ) of h thickness of earth surface is calculated using the following eq. 1:
Results and Discussion
Hydrogeology of Chennai Metropolitan Area
The Metropolitan area is covered by both Precambrian hard rock and sedimentary deposits consisting of sandstone, shale, boulders, gravel, sand and clay. The major part of the area is covered by recent alluvial deposit, consisting of sand dunes, marine and lacustrine deposits. The Recent deposits generally cover the Older formations consisting of consolidated and semi- consolidated sedimentary formations of Tertiary and Gondwana deposits and crystalline rocks of the Archaean age over the major part of the area, except on the south western side, where crystalline rock exposures are seen and on the northwestern side, where the sedimentary formations are encountered very near the surface (CGWB 2008). The geological succession seen in the area is presented in Table 1. Figure 3 geology of the study area and figure 4,5 and 6 shows the lithologs of the study area.
Archaean
The Archaeans consisting of Charnockites, gneisses and dolerite occupy the southern part of the Metropolitan area. They occur as Charnockite exposures in the railway cuttings near Guindy and as hills in St. Thomas Mount, Pallavaram, Tambaram and Vandalur. They are overlain by Recent Alluvium of varying thickness on the eastern side from Chemmancheri on the south to Ennore on the north. On the western side, they are overlain by Talchirs and Sripembudur stage of Gondwana age. The crystalline rocks are highly weathered and sometimes jointed and fractured. The zone of weathering is varying from 1 to 6m. The maximum thickness of weathering was observed in the achaeans is 10m. Borewell data suggest that major water bearing fractures are generally restricted to a depth of around 40m below ground level and there are some rare fractures to a depth of 60m below ground level. Beyond this depth, the rock is generally hard, massive and compact.
Groundwater occurs under water-table conditions in weathered, fractured, jointed and faulted portions of granitic and dyke rocks and semi-confined conditions in the weathered zone, joints and fractures. The weathered zones were once tapped through openwells; with the depletion of water level, borewells have become the order of the day to tap the deeper fractured rocks.
One borewell drilled in the Guindy Industrial estate in confirmed the presence of saturated fractures between 40 and 50m depth. The borewell tapping this zone yielded around 4000 litres per hour. In Perumbakkam in one of the housing colonies that is being developed recently, a borewell drilled to a depth of 80m confirmed the presence of yielding fractures at 55m and 60m depth yielding about 8000 litres per hour. The presence of fracture at 55m and 60m depth is also established in Jalladianpet. In the Vijayanagar area of Velacherry, joints at 20m depth are tapped to yield around 3000 litres per hour.
Gondwana Sediments
The lower portion of Gondwana belonging to the Talchir beds consists of light brown and green colored shales occurring below the alluvium in the area between Nandanam on the east to Nandambakkam on the west. These shales are overlying the older crystalline rocks. It is quite possible that these shales have undergone extensive erosion before the deposition of the overlying Sriperumbudur beds, with the result that these beds have very small thickness and limited areal extent.
The upper portions of the gondwanas in this area are the Sriperumbudur beds, which have large areal extent. They occur as brown and grey shales, at the surface to the west of Poonamallee on the Chennai-Bangalore National Highway and near Avadi. In the other areas, they are overlain by Alluvium of varying thickness. On the northwestern side between Thirunindravur and Villiwakkam, they are overlain by Tertiary beds.
In general, the groundwater potential in the Gondwana group of rocks is poor. The intermittent sandstones and the sandy clays to some extent yield meager quantity of groundwater. Groundwater is tapped mainly in the form of borewells. The yield of the borewell varies from 500 to 2000 litres per hour. The poor transmissivity of these formations restricts continuous pumping of the borewells.
Tertiary
The Tertiary bed comprising friable white and reddish brownsandstone occurs on the western side near Chembarambakkam and on the northwestern side between Thirunindravur and Villiwakkam. They also occur on the southern bank of the Kortalaiyar River near Redhills. These are overlain by the younger alluvium on the east west direction to the north of Coovum River between Thirumazhisai on the west to Thiruverkadu. The tertiary beds have a small thickness of around 30 to 45m. Groundwater is taped through shallow tubewells in these formations. Tubewells drilled to 50m in Paruthipattu tapping the Tertiary’s are observed to yield around 5000 litres per hour.
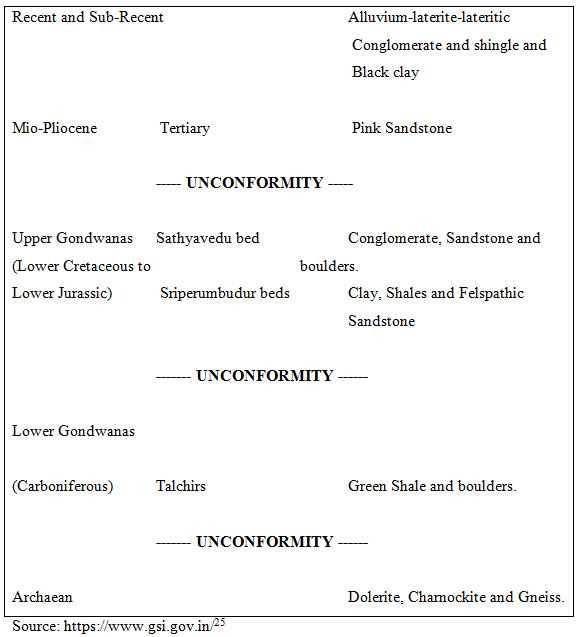 |
Table 1: Showing the stratigraphy of the study area. Click here to view table |
Alluvium
Groundwater occurs mainly under water table conditions in the alluvium. Large dimension open dugwells in the industries in Thiruvottiyur(alluvium over lying hard rock in coastal area) were observed to yield more than 10,000 litres per hour pumped from about 2 – 3 hours continuously. In MRC Nagar located very near the coast open well of 8 – 10m depth yields around 5000 litres per hour. In Porur the housing colonies under development, the yield test recordsa yield of about litres per hour just by penetrating 1m.
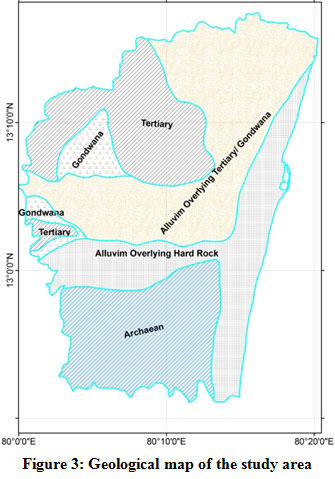 |
Figure 3: Geological map of the study area. |
Structure
There are major NE-SW trending faults on the southern side. One of them cuts across both Adyar and Coovum rivers between Saidapet and Egmore. The presence of a tectonic zone in this area is evidenced from the data on the borewells drilled in Srinagar colony, Kotturpuram and Thousand lights area. The rocks have undergone intensive fracturing and the borewells give comparatively higher yield.19 Another major NE-SW trending fault is seen between Kadapperi near Tambaram on the south to Ashok nagar on the north. The borewells along this line show that the rocks have undergone fracturing and shearing. East West faults along the Adyar River are seen in Ekkaduthangal and Kotturpuram. Faulting has resulted in the upliftment of the basement rock near AshokNagar.19 There are instances of mudloss during drilling in the Alluvium and the underlying weathered rock near these fault zones.
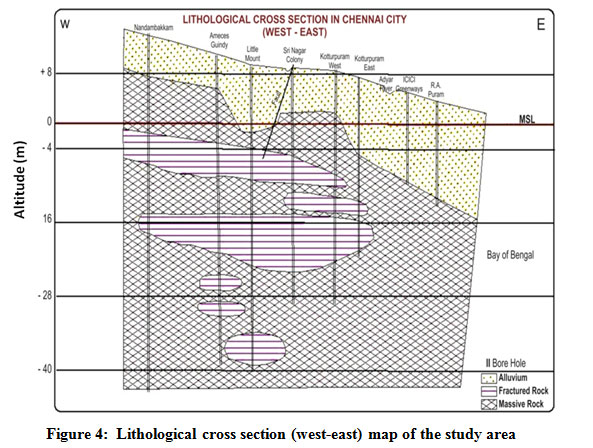 |
Figure 4: Lithological cross section (west-east) map of the study area. |
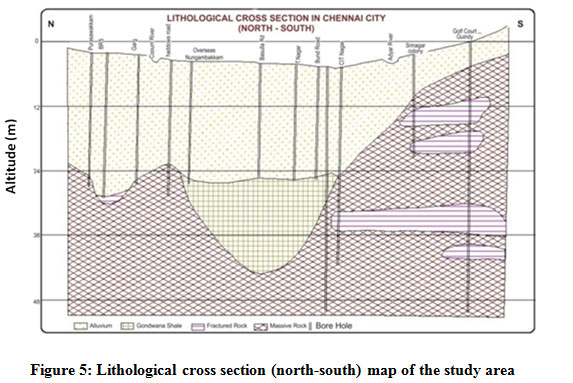 |
Figure 5: Lithological cross section (north-south) map of the study area. |
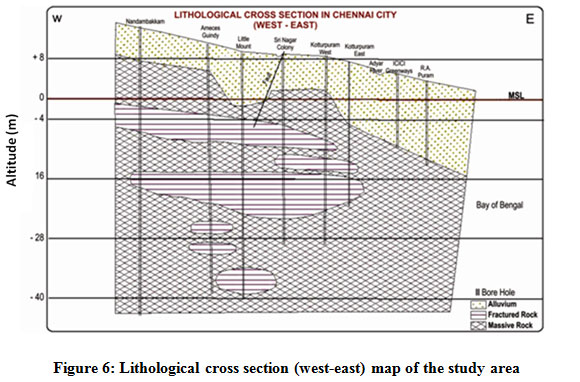 |
Figure 6: Lithological cross section (west-east) map of the study area. |
The west and north-west of Chennai, formations comprising of Conglomerates, Sandstone and Claystone of the Sriperumbudur Formation belonging to the Upper Gondwanas ranging from early Cretaceous to late Jurassic is reported to occur. Green splintery Shales which is typical of the Talchirs are encountered in the borewells drilled in Nandambakkam and Kodmabakkam areas of Chennai city. These gondwana formations lie unconformably over the Achaeans.
In the north-west of Chennai in and around Redhills and Sholavaram, laterite and pockets of Cuddalore formation are reported to occur. The Cuddalore formation comprises mainly of mottled, gritty and argillaceous sandstones. Both the laterite and Cuddalore formation belongs to the Tertiary group.
The coastal areas are characterized by the presence of recent to sub recent, fine beach sand of Quarternary age. Along the coast, towards south, grey and black clay with shells of estuarine origin are reported to occur. The central part of Chennai is characterizedby grey-brown to black sandy clays of fluvial origin. Paleo-channels comprising of medium to coarse sand with clay is reported to the north of Coovam River and to the north-east and north-west of Poonamallee.
Water level Contour
The contour of the water level has been plotted for three distinct seasons (pre-monsoon,monsoon and post-monsoon). The groundwater elevation contours with equal elevation change, also called the contour interval, were plotted. In this case, the contour interval is 1m. The groundwater flow direction can be obtained through the groundwater contour lines. These contour maps help decipher the changes in hydrochemistry with water level fluctuations. The spatial and temporal variation of water level controls the physicochemical properties of wells. In general, the shallow well has more chance4 of anthropogenic pollution compared to deep wells.
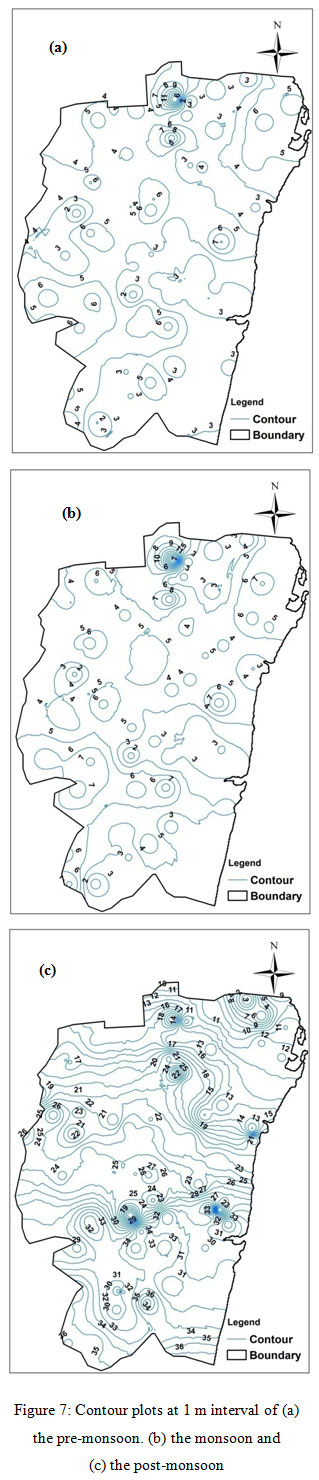 |
Figure 7: Contour plots at 1 m interval of (a) the pre-monsoon. (b) the monsoon and (c) the post-monsoon. |
Conclusion
The demand for fresh water is continuously increased under the climate and population stress. The coastal area like Chennai receives rainfall in both monsoon seasons. Even though the continuous rise of fresh water is not meeting. Therefore new groundwater recharge and prospects zones need to be identified. For this purpose, the vertical electrical sounding method is very robust and provides the detailed subsurface information. In order to conserve and manage the scarce resource as groundwater water in urban areas, it becomes essential to understand the nature of aquifers, their spatial distribution, annual recharge and draft, groundwater quality etc. Hence the information of sub-stratum, nature of aquifers, their spatial disposition, and their hydrogeological characteristics in urban areas needs to be studied with the advanced surveying techniques. These advanced techniques and tool provide high accuracy and precise results required for sustainable development of groundwater resources in the region is recommended alongwith rainwater harvesting structures.
Acknowledgements
The authors wish to acknowledge Dr. Anil Kumar Mishra, Principal Scientist, Water Technology Centre (WTC)- IARI, New Delhi for the support rendered for the successful completion of the work.
This research did not receive any funding or financial support or specific grant from funding agencies or government or non-government or non-profit organizations.
References
- Singh P., Singh S. K. Investigation of Groundwater Condition using Geoelectrical Resistivity Technique: A case study of Naveda Block, Kaushambi, India. Bulletin of Environmental and Scientific Research. 2015;4(3):18-24.
- Santhanam K., Abraham M, Rawat K. S. Assessment of groundwater potential for upper thurinjalar watershed in Tamil Nadu. IJCIET. 2018; 9(6):672–682.
- Rawat K. S., Jacintha T. G. A, Singh S. K. Hydro-chemical Survey and Quantifying Spatial Variations in Groundwater Quality in Coastal Region of Chennai, Tamilnadu, India – a case study. 50(1):55 – 67. https://doi.org/10.22146/ijg.27443.
CrossRef - Jacintha T. G. A., Rawat K. S., Mishra A. K., Singh S. K. Hydrogeochemical characterization of groundwater of peninsular Indian region using multivariate statistical techniques. Appl Water Sci. 2016; DOI 10.1007/s13201-016-0400-9.
CrossRef - UNDP (United Nations Development Program), Human Development Report 2006. Beyond Scarcity: Power, Poverty And The Global Water Crisis. Undp, New York.
- Central Pollution Control Board (CPCB), Status of Water Supply, Wastewater Generation and Treatment In Class-I Cities & Class-II Towns of India–Control of Urban Pollution, Ministry of Environment and Forests, Govt. of India. 2010,34-50,Cups/70/2009–10.
- UN-Habitat. 2011. Cities And Climate Change: Global Report On Human Settlements 2011. Earthscan, London.
- Vaidyanathan A., Saravanan J. Household Water Consumption in Chennai City – A Sample Survey. Centre for Science and Environment, 2003, New Delhi.
- Adadzi P., Coffie H., Afetorgbor E., Takase M. Vertical Electrical Sounding Survey for Groundwater Exploration for Rural Water Supply in Parts of Ketu South in the Volta Region of Ghana. J HydrogeolHydrolEng. 2018; 7:1. doi: 10.4172/2325-9647.1000163.
CrossRef - Vasantrao B.M., Bhaskarrao P. J., Mukund B. A. Comparative study of Wenner and Schlumberger electrical resistivity method for groundwater investigation: a case study from Dhule district (M.S.), India. Appl Water Sci. 2017;7:4321-4340. https://doi.org/10.1007/s13201-017-0576-7.
CrossRef - Bayewu O. O., Oloruntola M. O., Mosuro G. O. Geophysical evaluation of groundwater potential in part of southwestern Basement Complex terrain of Nigeria. Appl Water Sci 2017;7: 4615-4632. https://doi.org/10.1007/s13201-017-0623-4.
CrossRef - Abdullahi M. G., Toriman M. E., Gasim M. B. The Application of Vertical Electrical Sounding (VES) for Groundwater Exploration in Tudun Wada Kano State, Nigeria. J GeolGeosci 2015;4(186). doi: 10.4172/2329-6755.1000186.
CrossRef - Ariyo S. O., Banjo A. A. Application of Electrical Resistivity Method for Groundwater Exploration in a Sedimentary Terrain: A case study of Irara-Remo Southwestern Nigeria. Continental J. Earth Sciences. 2008; 3:53-58.
- Fadele S.I, Sule P.O, Dewu B.B.M. The Use of Vertical Electrical Sounding (VES) for Groundwater Exploration around Nigerian College of Aviation Technology (NCAT), Zaria, Kaduna State, Nigeria. PJST. 2013; 14: 549-555.
- Mukherjee S., Sashtri S., Gupta M., Pant M. K., Singh C., Singh S. K., Srivastava P. K., Sharma K. K. Integrated water resource management using remote sensing and geophysical techniques: Aravali Quartzite, Delhi, India. J Environ Hydrol. 2007;15:1-10.
- Ballukraya P. N., Ravi R. Chracterisation of groundwater in the unconfined aquiers of Chennai city, India Part 1–Hydrogeochemistry. J Geol S In. 1999; 54(1)1-11.
- Shri A. M. M. MurugappaChettiar Research Centre (MCRC), Sustainable Fresh Water Supply for Madras City, Tamil Nadu, India. Shri AMM Murugappa Chettiar Research Centre, Chennai, May 1997; 1-9, http://www.transparentchennai.com/wp-content/uploads/downloads/2013/05/Sustainable-Fresh-Water-Supply-for-Chennai-City.pdf.
- Central Ground Water Board (CGWB), Groundwater Resources and development Prospects in Madras District, Tamil Nadu, CGWB Southern Region, March 1993. http://cgwb.gov.in/district_profile/tamilnadu/madras.pdf.
- Central Ground Water Board (CGWB), District Groundwater Brochure Chennai District Tamil Nadu. 2008, http://cgwb.gov.in/District_Profile/TamilNadu/chennai.pdf.
- Chennai Metropolitan Development Authority (CMDA), Development Plan for Chennai Metropolitan Area, April 2006, www.transparentchennai.com/wp-content/uploads/.../2013/03/CDP_CHENNAI.pdf.
- Office of the Registrar General & Census Commissioner (ORGCC), India, Ministry of Home Affairs, Government of India. Census of India Provisional Population Totals, 2011,http://censusindia.gov.in/2011-prov-results/prov_results_paper1_india.html.
- Chennai Metropolitan Development Authority (CMDA), Second Master Plan for Chennai Metropolitan Area, 2026, Volume I, II & III. 2008, www.transparentchennai.com/wp-ontent/uploads/.../03/draftmasterplanii_short.pdf.
- Ground Water Estimation Committee (GEC)-1997, Ground Water Resource Estimation Methodology, Ministry of Water Resources, Government of India, New Delhi, 1997, 1-101, www.india-wris.nrsc.gov.in/wrpinfo/index.php?title...Ground_water_resource.
- Mohamed S .K. M., Zahir H. A. Monitoring the quality of groundwater on the bank of Cooum River at Chennai City, Tamil Nadu, India, Pelagia Research Library. Adv Appl Sci Res. 2012;3(6):3587-3592.
- Geological Survey of India (GSI). Table 1. https://www.gsi.gov.in/. 02-July-2018.


