Seasonal Assessment of Groundwater Quality in Bhagwanpur, Varanasi
Garima Jhariya1 * , R.M. Singh1 and Devendra Mohan2
1
Department of Civil Engineering,
Indian Institute of Technology,
Banaras Hindu University,
Varanasi,
221005
India
http://dx.doi.org/10.12944/CWE.13.3.21
Water is an essential component of an environmental unit; sustainability of life on the earth depends only on this vital natural resource. This study focuses on assessing the groundwater quality since it is contaminated due to various anthropogenic activities. Water contamination is one of the environmental challenges now days. In this work groundwater samples are collected for determination of various physicochemical parameters (temperature, pH, turbidity, acidity, alkalinity, hardness, TDS, nitrate, sulphate, chloride, andfluoride) for the duration of pre-monsoon and post-monsoon periods. Groundwater samples are taken for the analysis from Bhagwanpur since utilization of secondary treated municipal sewage for irrigating has been shown in that area. The study reveals that the parameters like pH, temperature, alkalinity, salinity and nutrient concentration in the analyzed sample falls within the permissible limitas per drinking water standards. Also the variation in mean values of the parameter within the samples was found very less whereas the variation recorded more in different seasons.
Copy the following to cite this article:
Jhariya G, Singh R.M, Mohan D. Seasonal Assessment of Groundwater Quality in Bhagwanpur, Varanasi. Curr World Environ 2018;13(3). DOI:http://dx.doi.org/10.12944/CWE.13.3.21
Copy the following to cite this URL:
Jhariya G, Singh R.M, Mohan D. Seasonal Assessment of Groundwater Quality in Bhagwanpur, Varanasi. Curr World Environ 2018;13(3). Available from: https://bit.ly/2ScS0vF
Download article (pdf) Citation Manager Publish History


Introduction
Water is critical and mainly used natural resource. It is fundamental unit of the environment to sustain all kind of life in this planate. Elevated water demand in agricultural as well as industrial sector has been shown in developed country due to unpredicted population growth; urbanization, advancement of technology and higher standards of living.From the total available water on earthonly 0.16% is suitable for individual consumption and the remaining is polluted due to various ecological reasons.1 Without water, life would not be sustained on earth since all the plants and animals contained water around 60% by volume. Discharging the domestic sewage and industrialized effluents into natural streamis one of the reason due to which water resources has become polluted in India or in developing countries.2
Groundwater pollution has become a major subject of public concern over the world since water quality performs important role for all living beings. Water quality is a term that is repeatedly defined among marine scientists, engineers, managers, andguiding principle. Assessment of water quality impairment presents challenges to water resource planners.3 The sequence of changes in quality characteristics of water due to various reasons, in these days have become the subject of numerous investigations which played a considerable role in assessing water quality. Also the possible correlations among these parameters, significant ones fairly indicate the quality of water.4
The present work focus on the study of the physicochemical characteristics of groundwater in Bhagwanpur area situated near by BHU where treated municipal sewage being discharged for irrigation since decades. Quality examination of water is critical mainly for monitoring purpose check whether the examin water is in compliance with the water quality standards, and hence, it is suitable or not for the designated best use. The results of the study will help in gathering significant information about quality status of groundwater in focused area. Also the outcomes of the study possibly will help the groundwater preservation managers, technocrats and urban planners to improve andrestore the groundwater. Thus the aim of the learning is to find out the physical and chemical (physico-chemical) characteristic of groundwater collected from the area nearby treated municipal sewage irrigation in Bhagwanpur.
Study Area
The present study was carried out at Bhagwanpur, Varanasi an ancient religious city, famous for its cultural heritage, music, art, craft and education, lies on the bank of holy river Ganges, one of the largest rivers of the world. Being an important pilgrimage center, thousands of tourists visit the holy city Varanasi from India and abroad. Varanasi is a major commercial and industrial center of eastern U.P situated in north-eastern part of the country at 25°0' to 25°16' N latitude and 82 5' to 83°1'E longitude. Groundwater is taken for the analysis is sampled from Bhagwanpur area situated around sewage treatment plant near by BHU where municipal sewage after treatment being utilized for irrigating crops. Groundwater sample is collected from different sources (tube wells, open well) in randomly selected eight sampling locations. The water samples lifted (with the help of rope and bucket) from these sources is not given any treatment except disinfection by bleaching powder. The quality parameters of groundwater samples are studied for each season (pre & post monsoon).
Material and Methods
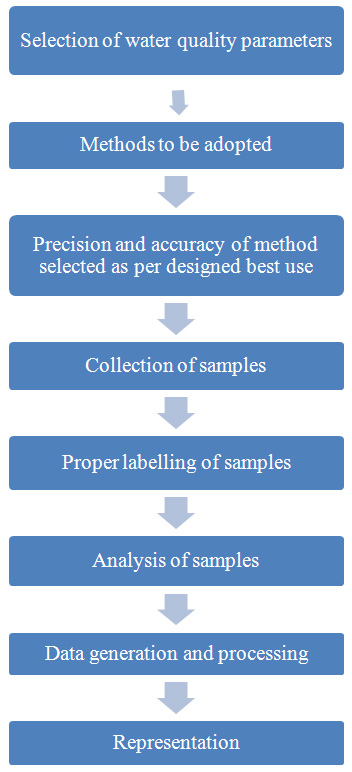
The study deals with manual random field sampling of shallow groundwater from eight different locations in Bhagwanpur. Water collected from the different sources (open well, tube well) named as GWS-1, GWS-2, GWS-3, GWS-4, GWS-5, GWS-6, GWS-7 and GWS-8. The samples collected for the analysis in different seasons early morning around 7:30 to 8:30 in plastic bottles. The plastic bottles should be thoroughly washed with strong acid (HNO3) after that distilled water should be used. The sampling bottles have to rinsed twice or thrice with the samples to be collected so as to lastly filled the bottles with samples. 2000 ml of groundwater was taken as samples and brought to the laboratory to analyze for determination of physiochemical characteristics using standard methods. Physical and chemical parameters like pH, electrical conductivity (EC), total dissolved solids (TDS), total hardness, calcium, magnesium, chloride and alkalinity were determined as per standard method.5 The general procedures followed for water quality analysis were represented using flow chart.
Results and Discussion
The Physicochemical parameters analyzed and data are presented in Table 1 for means of variables and the special and temporal variation represented graphically. Compression of result should be done for the analyzed quality parameters with the related drinking water standards given by (BIS:2012).6
Table 1: Result of Analysis of Groundwater Quality Parameters in Bhagwanpur
|
Parameters |
Pre-monsoon |
Post-monsoon |
IS 10500 : 2012 |
|
Temp(ºC) |
37.29± 0.10 |
26.33 ±0.10 |
- |
|
pH |
6.68 ±0.08 |
6.80 ±0.09 |
6.5-8.5 |
|
Turb (NTU) |
6.87 ±1.27 |
17.89 ±2.89 |
1-5 |
|
Cond (dS/m) |
0.87 ±0.06 |
1.01 ± 0.05 |
- |
|
TDS (mg/L) |
555 ±39.25 |
645± 33.98 |
500-2000 |
|
Acidity (mg/L) |
57.00 ±6.18 |
54.50 ± 3.29 |
- |
|
T. Alk (mg/L) |
331 ±9.94 |
170 ±15.54 |
200-600 |
|
T. Hard (mg/L) |
267.50 ±23.00 |
336.13 ±20.31 |
200-600 |
|
Cl-(mg/L) |
48.44± 4.19 |
40.62 ±3.92 |
250-1000 |
|
SO42+(mg/L) |
40.65 ± 2.88 |
34.04 ± 2.91 |
200-400 |
|
NO-3(mg/L) |
27.89± 2.74 |
19.49 ± 2.32 |
45 |
|
F (mg/L) |
0.13± 0.04 |
0.1 ± 0.03 |
1-1.5 |
Temperature
It is found that study area (Bhagwanpur) utilizing groundwater for human consumption (drinking, domestic purposes). The temperature recorded maximum 37.6oC in pre-monsoon period and it is minimum 26.7oC in post-monsoon. Hear seasonal difference, place, and time of sample collected possibly will influence the water temperaturewhich is also discussed.7,8 Worldwide heated atmosphere and development of subsurface infrastructures (e.g. subways, sewage systems and Ground Source Heat Pump (GSHP) systems) will likely to cause a swift in the temperature of relatively shallow groundwater reservoirs.
pH
The acidic or basic characteristic of water is determined by degree of concentration of hydrogen ions. It was evident from the present study; pH within BIS2012 limit recorded varies from 6.48 to 7.22 premonsoon and 6.57 to 7.35 for the post monsoon season (Fig.1). pH less than 7 may cause tuberculation and rust while higher the values may produce incrustation, residue deposits and difficulty in chlorination for disinfection of water. The pH value of 6.5 or higher for drinking water to prevent corrosionalso suggested by World Health Organization (WHO, 2010)9 and a pH values between 6.5 and 8.5 usually indicate good water quality generally in most of the drainage basins of the world (UNEP/GEMS, 2007).10
Electrical Conductivity (EC)
The conducting capacity of water is EC which in turn is determined by the presence of dissolved ions and solids. The EC of groundwater samples recorded 0.87±0.06 dS/m in pre-monsoon and it is 1.01±0.05 dS/m in post monsoon seasons more in post monsoon. Variation in EC of groundwater samples during both the seasons recorded as shown (Fig.2). This gives a picture of very little solute suspension generally in the groundwater, rapid ion-exchange between the soil and water (leaching of salts), or basically a poor and rather insoluble geologic rock and mineral types.
Turbidity
Water turbidity reflects the clearness of water and is due to the substances present in suspended form. Average values of turbidity recorded 6.87±1.27 and 17.89±2.89 in pre and post-monsoon respectively in the selected area. Variation in turbidity can be shown in pre monsoon and post monsoon seasons (Fig.3). Shallow or poorly-built wells or springs may be contaminated from surface water, especially during heavy rains or spring runoff. Turbidity recorded very high due to flooding in wet season, heavy rainfall and generation of runoff from agricultural lands.11 Turbidity in groundwater is mostly inorganic and caused by natural geological factors. High turbidity levels, or sudden changes in turbidity has been observed in this area because thewater systems in this area that rely on shallow or poorlybuilt wells that do not have proper filtration, may include high turbidity levels. Therefore it is advised to the community to filter and disinfect (boil) their drinking water for few minutesor may switch to an alternate drinking water supply (ex: bottled water, a deeper well or a cistern) for this particular period.
Total Dissolved Solids (TDS)
TDS present in water are useful measure to indicate Salinity. It includes all mineral constituents and other solids dissolved in the water. Mean values of TDS reported varied over the study having concentration 555 mg/L to 645 mg/L respectively in both the seasons (pre & post monsoon). Also the variation in TDS of groundwater samples for both the seasons represented in Fig.4. The analyzed water samples were classified as acceptable using the BIS recommended guidelines value of 2000 mg/L.The little higher concentrations of TDS in groundwater founded due to the presence of sulphates and chlorides in the water, which may instigate from natural sources, sewage effluents urban run off etc. High values of TDS influence the taste, hardness, and corrosive property of the water.12,13
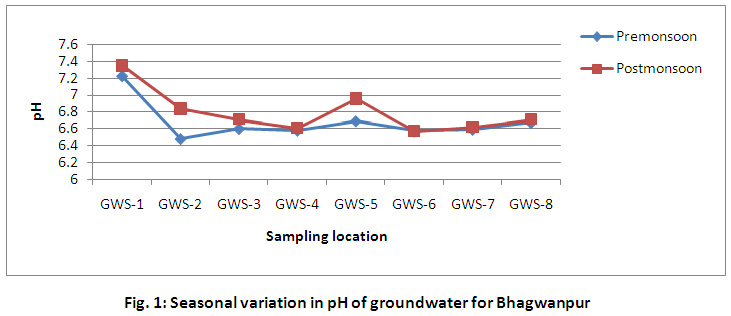 |
Figure 1: Seasonal Variation in pH of Groundwater for Bhagwanpur |
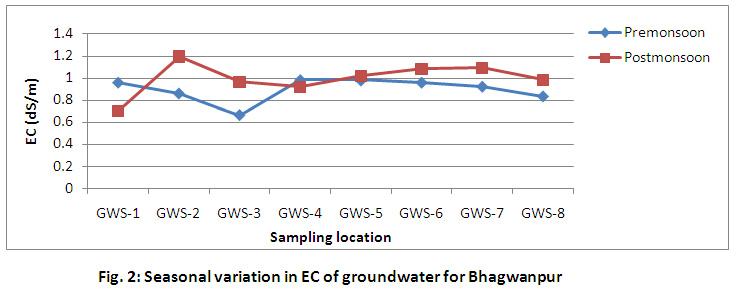 |
Figure 2: Seasonal Variation in EC of Groundwater for Bhagwanpur |
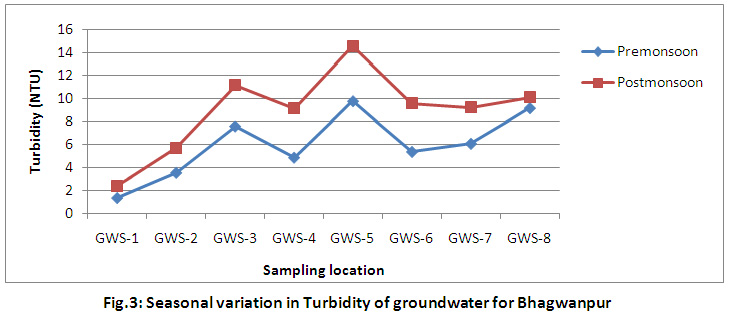 |
Figure 3: Seasonal Variation in Turbidity of Groundwater for Bhagwanpur |
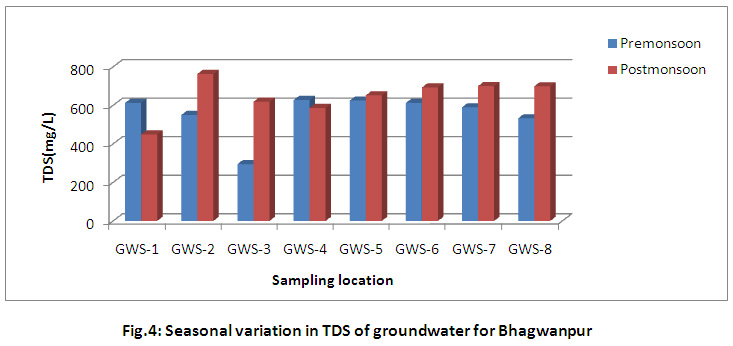 |
Figure 4: Seasonal Variation in TDS of Groundwater for Bhagwanpur |
Acidity, Alkalinity and Hardness in Groundwater
Alkalinity value in ground water of the study area in normal range but the variation according to different seasons can be shown. Summer sample (pre monsoon) showed a high value of alkalinity 331mg/L followed by 171 mg/L in winter (post monsoon).The mild alkalinity in groundwater samples found may be due to more leaching of effluent, household sewage etc. Presence of Acidity in the water influences pH of any solution. In the present study, mean value of acidity recorded high 57 mg/Lat some stage in pre monsoon and low value of 54 mg/L was recorded in post monsoon season. Whereas Hardness of water is objectionable for laundry and domestic purposes since it consumes a large quantity of soap. In this work, hardness varies over the area 212 mg/Lt o 400mg/L and 256 mg/L to 416 mg/L respectively in pre and post monsoon seasons and is above the permissible limit in both the seasons which is also supported by various works.14,15 The acidity, alkalinity and Hardness in groundwater varied over the area for both the seasons as illustrated in Fig 5 and Fig 6.
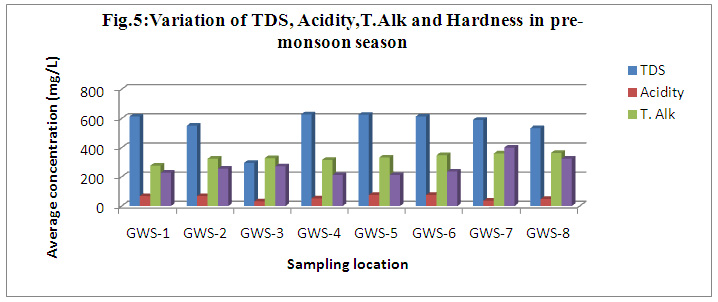 |
Figure 5: Variation of TDS, Acidity, T.Alk and Hardness in Pre-Monsoon Season |
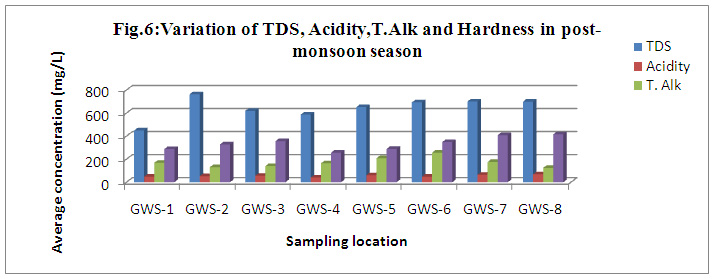 |
Figure 6: Variation of TDS, Acidity, T.Alk and Hardness in Post-Monsoon Season |
Chloride
Agricultural actions, industries and the presence of chloride affluent rocks affect the presence of chloride content in natural water bodies. Study reveals that the chloride concentration recorded 48.44 ± 4.19 in summer (pre monsoon) and it was 40.62 ± 3.92mg/L in winter (post monsoon). The variation of Chloride during both the seasons represented using Fig.7 and Fig.8. The makeable Chloride concentration is added in groundwater since it receiving municipal waste, farm drainage, and sewage effluent. The sewage effluents to water sources are bound to increase the chloride concentration in ground gives an undesirable taste to water and beverages.
Sulphate
The sulphate content of natural water is a necessary thought in formative their aptness for community. Observed value of sulphate ranges from 40.65mg/Lto 34.04mg/L respectively in pre monsoon and post monsoon season. Leaching of salts and other minerals affect the presence of sulphate16 and is also due to release of manufacturing wastes and domestic sewage in this area. A high concentration of sulphate in water bodies produces toxic effect to fish life17 and diarrhea, laxative effects in human life.
Nitrate
The production of wastes (domestic sewage, agricultural waste) rich in nitrates causes nitrate pollution in Groundwater. The nitrate content within the study area recorded mean value of nitrate ranges from 27.89 mg/L to 19.49 mg/L in pre monsoon and post monsoon season respectively. The heavy rainfall, leaching of salts, run off from agricultural wastes possibly will be the major cause of nitrates in aquifers (groundwater). Spatial distribution of nitrate in groundwater can be shown (Fig 7 and Fig 8) even though nitrate is naturally occurring it is common groundwater contaminants at low concentrations. As its concentration less than 45 mg/L as per standards it is considered safe for human and live stock consumption.
Fluoride
Weathering and movement of water in rocks and soils profile can be the probable source of fluoride in groundwater. Small amount of fluoride is needed in drinking water for human consumption as produces beneficial effect on human body but in higher concentration causes dental and skeletal fluorosis.18 Concentration of fluoride in analyzed ground water samples was observed 0.13 mg/L to 0.10 mg/L for the period of investigation and which is very less than permissible limit of 1.5 mg/L. The subsurface lithological formations could be one of the reasons for significantly contributing the fluoride concentration in groundwater of the study area.
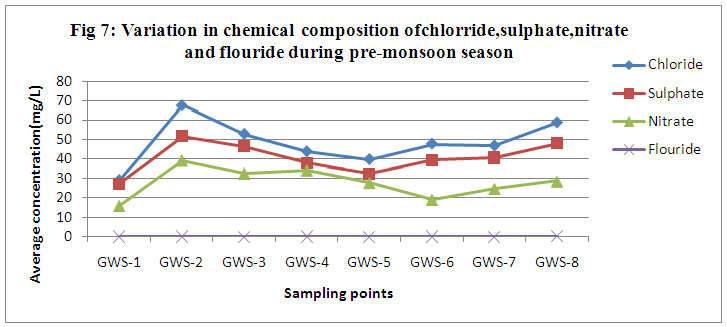 |
Figure 7: Variation in Chemical Composition of Chlorride, Sulphate, Nitrate and Flouride During Pre-Monsoon Season |
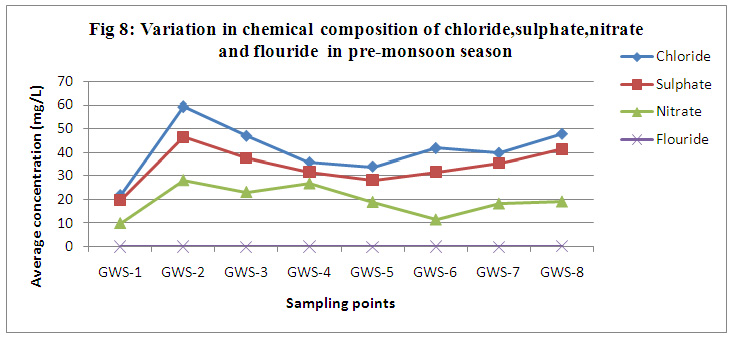 |
Figure 8: Variation in Chemical Composition of Chloride, Sulphate, Nitrate and Flouride in |
Conclusion
Understanding the quality of groundwater is vital because it is the major feature which decides its appropriateness for designed best use. Physicochemical characteristics of groundwater samples from randomly selected eight water sources (tub-well, open-well) were analyzed in the area surrounding the sewage treatment plant to evaluate potential quality of groundwater. The boreholes, hand pumps are founded dominant source of water (drinking and domestic purposes) for the inhabitants of the study area. Except turbidity the majority of the selected parameters fall within permissible level for drinking water. The study shows that groundwater is suitable for drinking purposes and public health. The public's awareness of health risks associated with poor disinfection of water should be occurred.
Acknowledgements
This paper has been greatly improved by the input of two anonymous reviewers. The authors wish to thank Environment Engineering Laboratory, Civil Engineering Department, Indian Institute of Technology, Banaras Hindu University, Varanasi-221005 for conducting experimental and analytical work.
References
- Mustaqeem, M. S. and Usmani, G. A. Evaluation Of Trends In Chemical And Physical Properties Of Ground Water And Its Modeling: A Correlation Regression Study. Rasayan Journal of Chemical, (2010); 3(2): 236-239
- Radhakrishnan, R. Dharmaraj, K. and Ranjitha Kumari B. D.A Comparative Study On Physicochemical & Bacterial Analysis Of Drinking, Borewell & Sewage Water In Three Different Places Of Sivakasi.Journal of Environmental Biology, (2007); 28(1): 105
- Parparov, A., Hambright, K.D., Hakanson, L., Ostapenia, A., Water Quality Quantification: Basics And Implementation. Hydrobiologia, (2006); 560: 227–237
CrossRef - Dhembare, A.J. and G.M. Pondhe Correlation of Ground Water Parameters Of Pravara Area Maharashtra State, India. J. Aquatic Biology, (1997); 12(1&2): 32-33
- APHA. American Public Health Association, Standard Methods for Examination Of Water And Wastewater. 21st Eds., Washington,D.C.(2005)
- IS, Bureau of Indian Standards, Manak Bhavan, 9 Bahadur Shah Zafar Marg New Delhi-110002, 2012, Drinking Water Sectional Committee, FAD 25
- Garg, R. K., Rao, R. J., Uchchariya, D., Shukla, G. and Saksena, D. N.Seasonal Variations In Water Quality And Major Threats To Ramsagar Reservoir, India. African Journal of Environmental Science and Technology, (2010); 4(2): 061-076.
- Verma, P. U., Chandawat, D. K. and Solanki, H. A. Seasonal Variation In Physic Chemical And Phytoplankton Analysis Of Kankaria Lake, Ahmedabad. Life Sciences Leaflets, (2011); 19: 842-854
- WHO.World Health Organization, Guideline for Drinking Water Quality. 3rd Edn., Geneva, Switzerland (2010)
- UNEP/GEMS.United Nations Environmental Programme (UNEP)/Global Environmental Monitoring System (GEMS), Water quality outlook. Burlington, Ontario, Canada(2007)
- Offem, B. O., Ayotunde, E. O., Ikpi, G. U., Ochang, S. N. and Ada, F. B. Influence Of Seasons On Water Quality, Abundance Of Fish And Plankton Species Of Ikwori Lake, South-Eastern Nigeria. Fisheries and Aquaculture Journal, (2011); 2(1): 1-18
- Haydar S., Haider H., Bari A. J. and Faragh A. Effect of Mehmood Booti Dumping Site in Lahore on Ground Water Quality, Pak. J. Engg. & Appl. Sci., (2012); 10: 51-56
- Balakrishnan P., Saleem A., Mallikarjun N. D. Groundwater quality mapping using geographic information system (GIS): A case study of Gulbarga City, Karnataka, India,” African Journal of Environmental Science and Technology, (2011); 5: 1069-1084
CrossRef - Saini, Y., Bhardwaj, N. and Gautam, R.Physico - Chemical Analysis of Groundwater Of Jhotwara Panchayat Samiti, Jaipur (Rajasthan). The Ecoscan, (2010); 4(1): 137-139
- Khan, A. A., and Khan M. N.International Science Congress Association Physico-Chemical Study of Groundwater at Shahjahanpur city, Uttar Pradesh, India, Research Journal of Chemical Sciences, (2015); 5(1), 55-59
- Manivaskam, N.Physicochemical examination of water sewage and industrial effluent, 5th Ed. Pragati Prakashan Meerut (2005)
- Anitha, G., Chandrashekara, V. A., Kodarkar. Limnological studies in Mir Alam lake, Hyderabad. Pollution Research, (2005); 24(3): 681-687
- Khattak, M. A., Ahmed, N., Qazi, M. A., Izhar, A ., Ilyas, S., Chaudhary, M. N., Khan M. S. A., Iqbal, N. and Waheed, T. Evaluation Of Ground Water Quality For Irrigation And Drinking Purposes of The Areas Adjacent To Hudiara Industrial Drain, Lahore, Pakistan. Pak. J. Agri. Sci. (2012); 49(4): 549-556


