Estimation of Design Flood for Rivers of Saurashtra Region Contributing into the Gulf of Khambhat
Priyanka Kumari 1 * and Sushil Kumar Himanshu1
1
Indian Institute of Technology Roorkee,
Roorkee,
India
Corresponding author Email: priyankasiwan@gmail.com
DOI: http://dx.doi.org/10.12944/CWE.11.3.23
Design flood has been estimated for rivers of Saurashtra region contributing into the Gulf of Khambhat using deterministic as well as statistical approach for planning, design and management of hydraulic structures. By comparing the results obtained by these approaches, one can easily estimate the flow rate or peak discharge to a given design return period and can establish the suitability of approach for this study area. Nine river basins with 20 dams of Saurashtra region were analyzed in this study. Though Saurashtra is one of the most water scarce regions of India yet it suffers from the flooding problem, as the numbers of rainy days are very less and the rainfall intensity is very high. Due to being a regulated basin, dam wise study was preferred. Deterministic approach was carried out using synthetic unit hydrograph (SUH) and regional flood formulae (RFF) methods for subzone-3a provided in Central Water Commission (CWC) report, 2001. Statistical approach was carried out using Rainfall frequency analysis employingGumbel’s EV1distribution. As there is no spill by these hydraulic structures and the annual flood data for the nine river sites are heavily affected by the storage dams in the upstream. Hence these data violate the basic principle of virgin flow. Hence the analysis of these data was not attempted further. The main objective of study was to carry out the rainfall frequency analysis for these river basins to get 24 hour rainfall for a return period of 25, 50 and 100 years for an individual basin instead of using the value obtained by iso-pluvial map to estimate the design flood. The overall results reveals that due to construction of number of dams in 9 river basins, design flood estimation on each dam by using deterministic approach is more feasible.Revised design floods using SUH and RFF method on the basis of estimated rainfall indicates over-estimated and under-estimated design floods. Since the percentage difference is very less between revised SUH and revised RFF method. So, for safety purpose one with higher value should be used.
Copy the following to cite this article:
Kumari P, Himanshu S. K. Estimation of Design Flood for Rivers of Saurashtra Region Contributing into the Gulf of Khambhat. Curr World Environ 2016;11(3). DOI:http://dx.doi.org/10.12944/CWE.11.3.23
Copy the following to cite this URL:
Kumari P, Himanshu S. K. Estimation of Design Flood for Rivers of Saurashtra Region Contributing into the Gulf of Khambhat. Curr World Environ 2016;11(3). Available from: http://www.cwejournal.org/?p=16430
Download article (pdf)
Citation Manager
Publish History
Select type of program for download
| Endnote EndNote format (Mac & Win) | |
| Reference Manager Ris format (Win only) | |
| Procite Ris format (Win only) | |
| Medlars Format | |
| RefWorks Format RefWorks format (Mac & Win) | |
| BibTex Format BibTex format (Mac & Win) |
Article Publishing History
| Received: | 2016-08-09 |
|---|---|
| Accepted: | 2016-10-25 |
Introduction
Flood, a natural disaster is responsible for loss of life and property world over. Floods damage property and endanger the lives of humans and animals and also affect the environment and aquatic life negatively. Floods have been occurring repeatedly in India. Approximately 40 million ha area (12%) in India has been identified as flood prone.18 For mitigating the flood disasters, various structural and non-structural measures are adopted. Structural measures include protection works and flood embankments while non-structural measures include flood forecasting, flood warning and flood plain zoning. Design flood estimates are required for the design of various hydraulic structures such as weirs, barrages, dams, embankment etc. and flood protection / relief schemes.5,14 Flood forecasts are required for operation of various flood control structures, for taking emergency measures such as maintenance of flood levees, evacuating the people to safe localities etc. Whenever rainfall or river flow records are not available at or near the site of interest, it is difficult for hydrologists or engineers to derive reliable flood estimates directly. In such situation, flood formulae developed for the region are one of the alternative methods for estimation of design floods, particularly for small-to-medium catchments. The conventional flood formulae developed for different regions of India are empirical in nature and do not provide estimates for a desired return period.
A number of studies have been carried out for estimation of design floods for various structures by different Indian organizations. Among these the prominent studies are carried out jointly by the Central Water Commission (CWC), Research Designs and Standards Organization (RDSO), and India Meteorological Department (IMD) using the method based on synthetic unit hydrograph and design rainfall, considering physiographic and meteorological characteristics for estimation of design floods3 and regional flood frequency studies carried out by RDSO using the USGS and pooled curve methods12 for various hydro-meteorological subzones of India. The concept of the geomorphologic instantaneous unit hydrograph (GIUH) was introduced by Rodriguez-Iturbe and Valdes.17 The topographic and geometric properties of the watershed and its drainage channel network are reflected by geomorphology.6 Snyder (1938) proposed synthetic unit hydrograph approach (SUH) for ungauged basin.21 A desirable method should satisfy the requirements of universal acceptability; ease in use with a minimum of data; robustness in nature; and reliability.14 Now a days GIS and remote sensing techniques are being used extensively to monitor the disasters like droughts and floods.7
Practically in the design of all hydrologic structures the peak flow that can be expected with an assigned frequency (say 1 in 100 years) is of primary importance to adequately design the structure to accommodate its effect. The design of bridges, culvert waterways and spillways for dams and estimation of scour at a hydraulic structure are some examples wherein flood-peak values are required. To estimate the magnitude of a flood peak the following methods are available: (1) Rational method; (2) Empirical method; (3) Unit-hydrograph technique and (4) Flood-frequency studies.10 The use of a particular method depends upon (i) the desired objective, (ii) the available data and (iii) the importance of the project. Further, the rational method is applicable only to small-size (<50 km2) catchments and the unit-hydrograph method is normally restricted to moderate-size catchments with areas less than 5000 (km2).13,15
In present study, design floods for various structures in the 9 river basins namely Wadhavan-Bhogavo, Limbdi-bhogavo, Sukhbhadar, Utavali, Padalio, Khalkhalia, Ghelo, Keri and Kalubhar have been estimated. Deterministic approach based on unit hydrograph theory developed by CWC4 and statistical approaches based on frequency analysis has been used for the design flood estimation.
Study Area and Data Availability
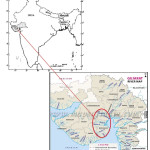
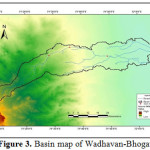
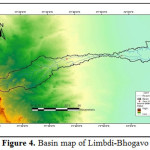
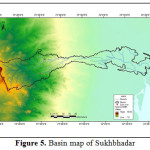
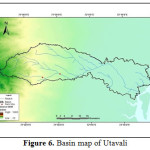
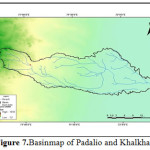
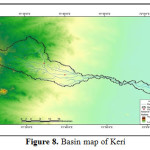
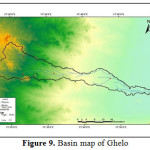
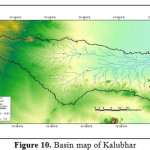
Saurashtra basin is a region of western India, located on the Arabian Sea coast of state of Gujarat. Saurashtra is bounded on three sides by waters of sea, namely in the north by the Gulf of Kutch with some part by the little Rann, in the west and south by the Arabian Sea and in the South-East by the Gulf of Khambhat; while in the east is the Mainland of Gujarat and are shown in Figure.1,8,9,19 The area covered by Saurashtra region is 59,360 sq. km. of which 9000 sq. Km. area is under study.20 Suarashtra basin lies between latitude 20ËšN to 24ËšN and longitude 69ËšE to 73ËšE. The rivers of Saurashtra region under study are: Wadhavan-Bhogavo, Limbdi-Bhogavo, Sukhbhadar, Utavali, Khalkhalia, Padalio, Keri, Ghelo and Kalubhar. There are 20 dams situated in these river basins. Details of river basins and dam situated in these river basins are shown in Table 1 and 4. Basin maps with dam site are shown in Figure 3 to 10.
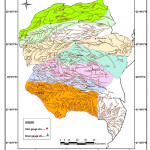
There are 13 rain gauge stations and 9 G&D stations in these river basins which are shown in Figure 2. The rainfall data are collected from IMD as well as Kalpasar Department and G&D data are collected from Kalpasar Department of Gujarat. Details of G&D stations and raingauge stations are shown in Table 2 and 3.For Synthetic Unit Hydrograph analysis, data related to catchment like river length, catchment area and equivalent slope are required and the same are computed using SWAT model and Arc-GIS. SRTM data of 90 m resolution are used for this purpose.
 |
|
 |
|
 |
|
 |
|
 |
|
 |
|
 |
|
 |
|
 |
|
 |
|
Table 1: Details of River Basins
|
Sr.No. |
Basin Name |
Area (km2) |
Length (km) |
Eq. Slope (m/km) |
|
1 |
Wadhavan-Bhogavo |
1517 |
128 |
1.19 |
|
2 |
Limbdi-Bhogavo |
915 |
118 |
1.4 |
|
3 |
Sukhbhadar |
1774 |
145 |
0.997 |
|
4 |
Utavali |
1206 |
98 |
0.751 |
|
5 |
Padalio |
311 |
50 |
0.779 |
|
6 |
Khalkhalia |
436 |
47 |
0.779 |
|
7 |
Keri |
556 |
110 |
1.537 |
|
8 |
Ghelo |
626 |
94 |
1.565 |
|
9 |
Kalubhar |
2047 |
90 |
1.42 |
Table 2: Details of G&D stations of Saurashtra region
|
Sr. No. |
Station Name |
Longitude |
Latitude |
Type |
Data Availability (Years) |
River Basin |
|
1 |
Limbdi |
71Ëš43'8.39" |
22Ëš33'28.79" |
Daily |
1991-2011 |
Limbdi |
|
2 |
Ranpur |
71Ëš43'29.99" |
22Ëš 21' 18" |
Daily |
1991-2010 |
Sukhbhadar |
|
3 |
Bhimnnath |
72Ëš 5' 59.99" |
22Ëš 13' 1.2" |
Daily |
1999-2010 |
Utavali |
|
4 |
Barwala |
71Ëš 46' 8.4" |
22Ëš12'10.79" |
Daily |
1991-2009 |
Utavali |
|
5 |
Keria |
71Ëš 52' 33.6" |
22Ëš 6' 7.2" |
Daily |
1991-2010 |
Padalio |
|
6 |
Muldharoi |
71Ëš55'51.59" |
22Ëš3'14.39" |
Daily |
1997-2010 |
Padalio |
|
7 |
Goradka |
71Ëš 28' 26.4" |
22Ëš 5'20.39" |
Daily |
1991-2010 |
Keri |
|
8 |
Vallabhipur |
71Ëš 52' 22.8" |
21Ëš 53'9.59" |
Daily |
1991-2010 |
Ghelo |
|
9 |
Umrala |
71Ëš 47' 56.4" |
21Ëš 50'56.4" |
Daily |
1991-2008 |
Kalubhar |
Table 3: Details of Rain gauge stations of Saurashtra region
|
Sr.No. |
Station Name |
Longitude |
Latitude |
Type of Data |
Data Availability (Years) |
River Basin |
|
1 |
WB II |
71Ëš31' 58.8" |
22Ëš43' 55.19" |
Hourly |
1906-2003 |
WB |
|
2 |
Sayla |
71Ëš27' 21.6" |
22Ëš32' 42" |
Hourly |
1969-2003 |
WB |
|
3 |
Chotila |
71Ëš12' 46.79" |
22Ëš25' 15.59" |
Hourly |
1968-2003 |
WB |
|
4 |
Limbdi |
71Ëš43' 19.19" |
22Ëš34' 15.6" |
Hourly |
1991-2010 |
Limbdi |
|
5 |
Dhandhuka |
71Ëš 58'29.99" |
22Ëš 23'27.59" |
Hourly |
1901-2006 |
Sukhbhadar |
|
6 |
Chorvira |
71Ëš 45'28.79" |
22Ëš 20' 45.6" |
Hourly |
1991-2010 |
Sukhbhadar |
|
7 |
Lakhavad |
71Ëš 31'55.19" |
22Ëš 19' 12" |
Hourly |
1982-2010 |
Sukhbhadar |
|
8 |
Dholera |
72Ëš11'41.99'' |
22Ëš15'7.19" |
Hourly |
1901-2006 |
Sukhbhadar |
|
9 |
Bhavnagar |
72Ëš 8' 13.2" |
21Ëš 46' 55.2" |
Hourly |
1901-2006 |
Kalubhar |
|
10 |
Vallavipur |
71Ëš52'44.4" |
21Ëš53'27.59" |
Hourly |
1960-2003 |
Ghelo |
|
11 |
Umrala |
71Ëš48' 21.59" |
21Ëš 50' 38.4" |
Hourly |
1961-2007 |
Kalubhar |
|
12 |
Dedava |
71Ëš21' 18" |
21Ëš53' 45.6" |
Hourly |
1982-2010 |
Kalubhar |
|
13 |
Pipardi |
71Ëš20' 9.59" |
21Ëš50' 9.59" |
Hourly |
1983-2007 |
Kalubhar |
Table 4: Details of Dam with river-wise
|
Sr. No. |
Name of River |
Name of the Dam |
Location |
Area (km2) |
River Length (km) |
Eq. Slope (m/km) |
|
|
Longitude |
Latitude |
||||||
|
1 |
Wadhwan-Bhogavo |
WB I |
71°28’57.7” |
22°40’49.6” |
389 |
50 |
1.86 |
|
WB II |
71°36’26.8” |
22°43’17.2” |
159 |
14 |
1.22 |
||
|
WB III |
71°48’50.0” |
22°39’45.6” |
303 |
24 |
1.81 |
||
|
2 |
Limbdi-Bhogavo |
LB I |
71°27' 21.6" |
22°28' 48" |
329 |
33 |
1.727 |
|
LB II |
71°36' 39.6" |
22°32' 34.8" |
201 |
19 |
2.142 |
||
|
LB III |
71°56' 45.6" |
22°33' 17.9" |
192 |
36 |
1.504 |
||
|
3 |
Sukhbhadar |
Sukhbhadar |
71°32' 13.2" |
22°20' 45.6" |
591 |
45 |
1.937 |
|
Goma |
71°30' 3.6" |
22°14' 23.9" |
165 |
24 |
3.211 |
||
|
4 |
Utavali |
Khambhada |
71°50' 41.9" |
22°10' 22.8" |
255 |
40 |
2.431 |
|
Senthali |
71°44' 27.6" |
22°9' 43.2" |
62 |
18 |
3.332 |
||
|
5 |
Keri |
Bhimdad |
71°34' 37.2" |
22°4' 51.6" |
126 |
24 |
2.931 |
|
Gala |
71°34' 22.8" |
22°2' 45.6" |
169 |
26 |
3.892 |
||
|
6 |
Ghelo |
GheloSomnath |
71°24' 7.2" |
22°3' 10.8" |
56 |
12 |
5.662 |
|
GheloItaria |
71°23' 49.2" |
21°58' 4.8" |
111 |
16 |
3.681 |
||
|
Limbali |
71°31' 48" |
21°58' 8.4" |
142 |
27 |
3.427 |
||
|
Navagam |
71°47' 24" |
21°56' 20.4" |
60 |
15 |
1.988 |
||
|
7 |
Kalubhar |
Kalubhar |
71°38' 27.6" |
21°51' 28.8" |
592 |
46 |
3.139 |
|
Rangholi |
71°39' 35.9" |
21°45' 36" |
397 |
31 |
2.570 |
||
|
Malpara |
71°32' 56.4" |
21°51' 39.6" |
114 |
23 |
2.470 |
||
|
8 |
Padalio |
Bhambhan |
71°41' 6" |
22°6' 0" |
66 |
14 |
3.66 |
Methodology
In this study, deterministic approach based on unit hydrograph theory and statistical approaches based on frequency analysis are used for design flood estimation.
1 Deterministic Approach
Due to paucity of data, regional approach based on synthetic unit hydrograph developed by Central Water Commission (CWC), 1987 has been used.2 The study area falls under the subzone 3(a).
- Synthetic Unit Hydrograph (SUH) method
The following relationship for SUH method has been developed by CWC (1987):
tp= 0.433(L/Sc)0.704 (1)
qp =1.161/(tp)0.635 (2)
TB = 8.3758(tp)0.512 (3)
W50 = 2.284/(qp)1.00 (4)
Qp=qp * A (5)
W75 =1.331/(qp)0.991 (6)
WR50 = 0.827/(qp)1.023 (7)
WR75 = 0.561/(qp)1.037 (8)
Tm =tp+ 0.5 (9)
Where,
A = Total catchment area in km2
L = Length of longest main stream along the river course in km
Sc = Equivalent stream slope in m/km
tp= Time from the centre of effective rainfall duration to the peak in hr.
qp = Peak rate of discharge in cumec per sq. km.
Qp = Peak discharge of U.G. in m3/s
TB = Base width of U.G. in hr.
Tm = time from the start of rise to the peak of U.G. in hr.
W50 = Width of U.G. measured at 50% of peak discharge ordinate in hr.
W75 = Width of U.G. measured at 75% of peak discharge ordinate in hr.
WR50 = Width of rising limb of U.G. measured at 50% of peak discharge ordinate in hr.
WR75 = Width of rising limb of U.G. measured at 75% of peak discharge ordinate in hr.
Regional flood formulae method
The regional flood formulae have been developed by CWC to estimate 25, 50 and 100 year return period flood values. The meteorological variability has been accounted from region to region in these formulae. The others factors such as shape of the catchment, slope of the stream etc, which have influence on the peak, have also been included in these formulae thereby improving over most of the limitations of the empirical / rational formula. Thus to estimate design flood for sub-zone 3(a), Regional flood formula is given as2:

Where,
a, b, c, d and e are coefficient and the value of this coefficient is provided in CWC report.
QT = Design flood for a desired return period T in m3/s
A = Catchment Area in km2
S = Equivalent slope of main stream in m/km
Rt = Storm depth of return period t in cm
L = Longest length of main stream in km
Thus,
Qâ‚‚â‚… = 1.005 * A(0.978) * S(0.25) * Rt(1.19) / L(0.618) (11)
Qâ‚…â‚€ = 1.164* A(0.947) * S(0.242) * Rt(1.143) / L(0.566) (12)
Qâ‚₀₀ = 1.161* A(0.96) * S(0.241) * Rt(1.126) / L(0.568) (13)
Statistical Approach
The statistical approach, otherwise also called frequency analysis, may be performed on the past recorded data of annual peak data series. Frequency analysis is carried out on the available record of annual flood peak discharge or annual rainfall events of the region.
Frequency Analysis for individual gauged sites
Frequency analysis study interprets a past record of events to predict the future probabilities of occurrence and estimate the magnitude of an event corresponding to a specific return period.1 If the event records are of sufficient length and reliability, they may yield satisfactory estimates. The method, however, does not provide a hydrograph shape but gives only a peak discharge of known frequency. The processed data series are to be analysed to ensure that the fundamental assumption of frequency analysis are satisfied. The data series is to be checked for randomness, presence of trend and outliers. The presence of trend is tested by using Kendall’s rank correlation test and Turning point test. The presence of randomness and outliers is tested by Anderson’s correlogram test and Chow test respectively. Detailed at site flood frequency analysis is carried out by using various distributions like Normal, Log-Normal, Pearson type III, Log-Pearson type III, Gumbel’s Extreme value distribution.9 Gumbel EV1 is the commonly used distributions and the details about these distributions are given below.1,15,16
Gumbel EV-1 type distribution
It is one of the most commonly used distributions in flood frequency analysis and was introduced by Gumbel in 1941. It is widely used for extreme values in hydrologic and meteorological studies for prediction of flood peaks, maximum rainfalls, maximum wind speed, etc. It is the double exponential distribution (known as Gumbel’s distribution or extreme value type 1 or Gumbel’s EV-1 distribution). The CDF of EV-1 distribution is defined as
F (x) = exp [-exp(-(x-u)/α (14)
Where, u and a are the location and scale parameters of the distribution.
Using method of moments, u and a are obtained by following equation:

Where, and SX are mean and standard deviation of the variate X.
Equation (16) can be written in the reduced variate form as
F(y) =exp (-exp (-YT)) (17)
Where,

The reduced variateYT can be written in terms of return period, T, by replacing F(x) by 1-1/T as

Regional flood frequency analysis
Kumar (2009), developed the Regional flood frequency relationship using L-moment approach for ungauged catchments for 17 Subzones hydro-meteorologically homogeneous. Out of 17 subzones, Saurashtra region falls under Subzone 3(a) and the relationship for this subzone developed by Kumar (2009) is given as follows11:
QT = CT * Ab (22)
Where,
QT = Flood estimate for an ungauged catchment in m3/s for T year return period
CT = a regional coefficient
A = Catchment area in km2
b = a regional coefficient, for subzone 3(a) this value is 0.383.
Value of CT for Various return period for Subzone 3(a) are shown in Table 5.
Table 5: Value of CT for Various return period for Subzone 3(a)
|
Coeff. (b) |
CT for Subzone 3(a) |
||||
|
Return Period (Years) |
|||||
|
2 |
10 |
25 |
50 |
100 |
|
|
0.383 |
23.283 |
68.862 |
94.629 |
114.058 |
133.488 |
Results and Discussion
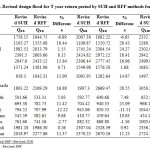
In this study initially the above approach are used for 20 dams as well as for 9 river basins on the basis of 24 hour rainfall for T year return period given in the iso-pluvial map. After rainfall frequency analysis, it is revised only for dams because these basins are heavily affected by dams situated on upstream. The result obtained by the above approach by the use of 24 hour rainfall for a T year return period given in the iso-pluvial map (IMD, Pune) are shown in Table 6 and 7 as well as developed by rainfall frequency analysis for basin wise are shown in Table 8 and 9.From Table 6, it can be seen that design flood estimates for return period of 25, 50 and 100 years for dams namely Wadhavan-Bhogavo, Limbdi-Bhogavo, Sukhbhadar, Utavali, Khalkhalia, Padalio, Keri and Kalubhar are underestimating except Ghelo which is overestimating when compares with the result obtained from Table 8. The reason behind this variation in result is the use of value T year return period 24 hour rainfall. By rainfall frequency analysis it has been found that the river basins namely Wadhavan-Bhogavo, Limbdi-Bhogavo, Sukhbhadar and Kalubhar have higher value of rainfall from what recommended by IMD Pune while Ghelo river basin has lower value. T year return period 24 hour rainfall recommended by IMD Pune for these river basinsis: R25 = 20 cm, R50 = 24 cm and R100 = 28cm. Since only 5 basins namely Wadhavan-Bhogavo, Limbdi-Bhogavo, Sukhbhadar, Ghelo and Kalubhar have sufficient rainfall data availability so by using Gumbel EV1 distribution T year return period 24 hour rainfall are estimated for 5 river basins and are shown in Table 8. Thus this estimated value of 24 hour rainfall for return period of 25, 50 and 100 years is used to revise design floods for the dams present in these river basins. Revised design floods for dams in these river basins for return period of 25, 50 and 100 years are computed and tabulated in Table 9 and from Table 9 it is found that the % difference is very less between revised SUH and revised RFF method.
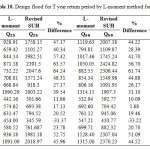
By using the relationship developed by Kumar (2009), the design flood estimates for return period of 25, 50 and 100 years for dams and rivers are computed below in Table 10 and 11. From Table 10 and 11 it is found that the % difference is very large between L-moment and revised SUH method. L-moment method underestimates the design floods for dams as well as river basins.
The annual flood data for the nine river sites are heavily affected by the storage dams in the upstream. Hence these data violate the basic principle of virgin flow. Hence the flood frequency analysis of these data was not attempted further.
Table 6: Design flood (Cumec) for 20 dams
|
Basin Name |
Dam |
SUH Method |
RFF method |
||||
|
Qâ‚‚â‚… |
Qâ‚…â‚€ |
Qâ‚₀₀ |
Qâ‚‚â‚… |
Qâ‚…â‚€ |
Qâ‚₀₀ |
||
|
Wadavan-Bhogavo |
WB I |
1345.53 |
1676.05 |
1868.75 |
1261.18 |
1566.76 |
1882.22 |
|
WB II |
754.02 |
929.89 |
1105.27 |
1039.06 |
1290.82 |
1550.72 |
|
|
WB III |
1348.32 |
1666.65 |
2029.65 |
1544.16 |
1918.30 |
2304.54 |
|
|
Limbdi-Bhogavo |
LB I |
1303.96 |
1503.09 |
1929.6 |
1384.68 |
1720.19 |
2066.53 |
|
LB II |
1140.6 |
1389.58 |
1658.26 |
1293.99 |
1607.52 |
1931.18 |
|
|
LB III |
749.15 |
926.93 |
1103.8 |
734.48 |
912.44 |
1096.15 |
|
|
Suhkbhadar |
Goma |
1034.31 |
1204.52 |
1497.79 |
983.51 |
1221.82 |
1467.82 |
|
Sukhbhadar |
1789.9 |
2550.71 |
3050.28 |
2046.92 |
2542.89 |
3054.88 |
|
|
Utavali |
Senthali |
437.17 |
533.07 |
630.93 |
455.27 |
565.58 |
679.46 |
|
Khambhada |
1118.01 |
1380.51 |
1642.09 |
906.15 |
1125.71 |
1352.36 |
|
|
Padalio |
Bhambhan |
510.88 |
623.08 |
735.27 |
578.64 |
718.84 |
863.58 |
|
Keri |
Bhimdad |
745.08 |
914.13 |
1082.44 |
738.48 |
917.41 |
1102.12 |
|
Gala |
1057.66 |
1294.23 |
1531.72 |
1005.44 |
1249.05 |
1500.54 |
|
|
Ghelo |
Somnath |
562.15 |
683.43 |
804.03 |
604.54 |
751.02 |
902.24 |
|
Itaria |
830.22 |
1013.49 |
1197.47 |
887.28 |
1102.27 |
1324.21 |
|
|
Limbali |
895.08 |
1094.84 |
1251.58 |
802.56 |
997.01 |
1197.75 |
|
|
Navagam |
388.78 |
475.89 |
562.89 |
433.71 |
538.80 |
647.29 |
|
|
Kalubhar |
Malpara |
721.43 |
882.32 |
1044.39 |
699.35 |
868.80 |
1043.73 |
|
Rangholi |
1871.56 |
2307.04 |
2744.37 |
1874.26 |
2328.39 |
2797.20 |
|
|
Kalubhar |
1904.34 |
2370.23 |
2843.88 |
2149.38 |
2670.16 |
3207.78 |
|
Table 7: Design flood (Cumec) for 9 river basins
|
Sr. No. |
Basin Name |
SUH Method |
RFF method |
||||
|
Qâ‚‚â‚… |
Qâ‚…â‚€ |
Qâ‚₀₀ |
Qâ‚‚â‚… |
Qâ‚…â‚€ |
Qâ‚₀₀ |
||
|
1 |
Wadhavan-Bhogavo |
2710.72 |
3472.33 |
4228.19 |
2473.45 |
3129.90 |
3832.12 |
|
2 |
Limbdi-Bhogavo |
1832.21 |
2326.2 |
2821.62 |
1638.00 |
2095.30 |
2548.53 |
|
3 |
Sukhbhadar |
3192.12 |
4068.33 |
4947.0 |
2519.04 |
3200.88 |
3926.56 |
|
4 |
Utavali |
2208.94 |
2686.26 |
3101.49 |
2085.64 |
2630.09 |
3213.83 |
|
5 |
Padalio |
754.38 |
952.94 |
1149.27 |
1178.52 |
1480.72 |
1787.92 |
|
6 |
Khalkhalia |
1032.13 |
1319.2 |
1572.23 |
815.14 |
1038.28 |
1248.04 |
|
7 |
Keri |
1306.05 |
1635.35 |
1971.73 |
1237.48 |
1581.81 |
1912.50 |
|
8 |
Ghelo |
1413.24 |
1791.38 |
2170.07 |
1337.6 |
1709.47 |
2069.72 |
|
9 |
Kalubhar |
3862.14 |
4952.84 |
5334.61 |
4274.00 |
5256.78 |
6464.61 |
Table 8: 24 hour Rainfall (cm) for T year return period for river basins
|
Sr. No. |
Basin Name |
R25 |
R50 |
R100 |
|||
|
After analysis |
As per Iso-pluvial map |
After analysis |
As per Isopluvial map |
After analysis |
As per Isopluvial map |
||
|
1 |
Wadhavan-Bhogavo |
25 |
20 |
28 |
24 |
32 |
28 |
|
2 |
Limbdi-Bhogavo |
34 |
20 |
38 |
24 |
41 |
28 |
|
3 |
Sukhbhadar |
21 |
20 |
25 |
24 |
28 |
28 |
|
4 |
Ghelo |
18 |
20 |
21 |
24 |
23 |
28 |
|
5 |
Kalubhar |
21 |
20 |
24 |
24 |
27 |
28 |
 |
|
 |
|
Table 11: Design flood for T year return period for river basins
|
Basin Name |
Area (km2) |
Return Period (years) |
||||||||
|
25 |
PD |
50 |
PD |
100 |
PD |
|||||
|
L-moment |
SUH |
L-moment |
SUH |
L-moment |
SUH |
|||||
|
WB |
1517 |
1564.38 |
2710.72 |
36 |
1885.57 |
3472.33 |
40 |
2206.78 |
4228.19 |
42 |
|
LB |
915 |
1288.99 |
1832.21 |
21 |
1553.64 |
2326.20 |
25 |
1818.30 |
2821.62 |
29 |
|
Sukhbhadar |
1774 |
1661.01 |
3192.12 |
34 |
2002.05 |
4068.33 |
37 |
2343.10 |
4947.0 |
40 |
|
Utavali |
1206 |
1432.78 |
2208.94 |
31 |
1726.96 |
2686.26 |
34 |
2021.15 |
3101.49 |
37 |
|
Padalio |
311 |
852.61 |
754.38 |
0 |
1027.67 |
952.94 |
1 |
1202.73 |
1149.27 |
3.6 |
|
Khalkhalia |
436 |
970.39 |
1032.13 |
17 |
1169.63 |
1319.20 |
21 |
1368.88 |
1572.23 |
23 |
|
Keri |
556 |
1065.09 |
1306.05 |
13 |
1283.78 |
1635.35 |
18 |
1502.47 |
1971.73 |
21 |
|
Ghelo |
626 |
1114.58 |
1413.24 |
17 |
1343.43 |
1791.38 |
21 |
1572.28 |
2170.07 |
24 |
|
Kalubhar |
2047 |
1754.62 |
3862.14 |
59 |
2114.87 |
4952.84 |
59 |
2475.14 |
5334.61 |
60 |
[Note: PD- % Difference]
Conclusions
After the analysis of these river basins and dams situated on it, the following conclusions are drawn:
- For the study area, 24 hr rainfall for the return period of 25, 50 and 100 years are different for 9 river basins which also differs from iso-pluvial map recommended by IMD, Pune for this region.
- Revised design floods using SUH and RFF method on the basis of estimated rainfall indicates over-estimated and under-estimated design floods.
- Due to construction of number of dams in 9 river basins, design flood estimation on each dam by using deterministic approach is more feasible.
- The percentage difference is very less between revised SUH and revised RFF method. So, for safety purpose one with higher value will be used.
- Regional flood frequency relationship based on L-moment under-estimates the design floods with average percentage difference of 32.023% for dams and 28.28% for river basins.
- The reason for large average percentage difference was investigated and the data analysis reveals that there are large storages in these basins and hence application of either RFF or L-moment based methods may not be applicable.
Acknowledgement
We acknowledge the IMD, Pune as well as Kalpasar Department of Gujarat, India, for providing hydro-meteorological data of the Saurashtra region of Gujarat.
References
- Chow, V.T., Maidment, D.R. and Mays, L.W. ‘Applied Hydrology’, McGraw-Hill, New York, (2010).
- CWC, ‘Flood estimation report for Mahi and Sabarmati (Sub-zone-3(a))’, Directorate of Hydrology, New Delhi, (1987).
- CWC, ‘Flood estimation report for Upper Narmada and Tapi (Sub-zone-3(C))’ Report No. UNT/7/1983, Directorate of Hydrology, New Delhi, (1983).
- CWC, ‘Manual of estimation of Design Flood’, Hydrology studies Organisation, New Delhi, (2001).
- Himanshu, S. K., Garg, N., Rautela, S., Anuja, K. M., & Tiwari, M., ‘Remote sensing and GIS applications in determination of geomorphological parameters and design flood for a Himalayan river basin, India’, Res. J. Earth Sci, 1(3), 11-15, (2013).
- Himanshu, S. K., Pandey, A., & Palmate, S. S.,‘Derivation of Nash Model Parameters from Geomorphological Instantaneous Unit Hydrograph for a Himalayan River using ASTER DEM’, Proceedings of International Conference on Structural Architectural and Civil Engineering, Dubai, (2015).
- Himanshu, S. K., Singh, G., &Kharola, N. ‘Monitoring of Drought using Satellite Data’,International Research Journal of Earth Sciences, 3(1), 66-72, (2015)
- http://guj-nwrws.gujarat.gov.in/ (Narmada Water Resource and Kalpasar Department).
- http://www.gsdma.org/hazards/flood.aspx(Gujarat State Disaster Management Authority).
- http://www.mapmyindia.com/solutions/emergency-and-disaster-management(Emergency and Disaster Management).
- Kumar, R. ‘Regional flood frequency analysis in India, D. thesis report, Department of Hydrology, IIT Roorkee, (2009).
- Kumar, R., Singh, R. D., & Seth, S.M., ‘Regional flood formulae for seven subzones of zone 3 of India’, Journal of Hydrology, 4:240-244, (1999).
- Mutreja, K. N., Applied Hydrology, McGraw-Hill, New York, (1986).
- Pandey, A., Himanshu, S. K., Mishra, S. K., & Singh, V. P. ‘Physically based soil erosion and sediment yield models revisited’,CATENA, 147, 595-620, (2016).
CrossRef - D.S.O. Estimation of Design Discharge based on Regional Flood Frequency Approach for Subzone 3(a), 3(b), 3(c) and 3(e). Bridges and Floods Wing Report No. RBF-20, (1991).
- Rao, A. R. &Hamed, K. H. ‘Flood Frequency Analysis’, CRS Press, Washington, D.C., (2000).
- Rodriguez-Iturbe, I. and Valdes, J.B., ‘The geomorphologicstructure of hydrologic response, Water Res. Res., 15(6), 1409–1420, (1979).
CrossRef - Sathe, B. K., Khir, M. V. &Sankhua, R. N., ‘Rainfall analysis and design flood estimation for Upper Krishna River Basin Catchment in India’, International Journal of Science &Engg. Reasearch,3 (8), ISSN 2229-5518, (2012).
- Singh, V.P., Hydrologic systems: Rainfall-runoff modeling, N J Prentice Hall. Englewood, 1, (1988).
- Subramanya, K. ‘Engineering Hydrology’, McGraw-Hill, New York, (2009).
- Snyder, F. F., “Synthetic Unit graphs”, Transactions of American Geophysics Union, 19th Annual Meeting, Part 2, p. 447-454 (1938).
CrossRef


