Modelling Integrated Wastewater Treatment Plant for Agro Industry Zone in Banyuasin, South Sumatera, Indonesia
Hasmawaty Hasmawaty 1 *
1
Department of Industrial Engineering,
Bina Darma University,
Palembang,
30137
Indonesia
Corresponding author Email: hasmawaty@binadarma.ac.id
DOI: http://dx.doi.org/10.12944/CWE.11.2.04
The purpose of this article is to analyze integrated wastewater treatment plant (WWTP) design for Tanjung Api-Api (TAA) agro-industrial area, South Sumatra, Indonesia, using Environmentally Sensitive Investment System (ESIS). This article is based on empirical research that conducted in Banyuasin District, South Sumatera Province, Indonesia. Our result show that wastewater discharge (Q) release into river at E5 has reachton/day and contain 87.16 mg/l TSS. This number does not exceed200 mg/l, TSS threshold for industry area, which regulated by South Sumatra Province through Regulation of the Governor of South Sumatera 18/2005 on Liquid Waste Quality Standard (LWQS). It also produced BOD (100 mg/l) lower than LQWS standard (200 mg/l). Sludge dewatering generate 724,48mg/l/day TSS which can be converted into value-added product. Our WWTP design for TAA area can protect wetland ecosystems in South Sumatra Province. We also give recommendation for TAA multi-stakeholder and propose several topics for further research.
Copy the following to cite this article:
Hasmawaty H. Modelling Integrated Wastewater Treatment Plant for Agro Industry Zone in Banyuasin, South Sumatera, Indonesia. Curr World Environ 2016;11(2) DOI:http://dx.doi.org/10.12944/CWE.11.2.04
Copy the following to cite this URL:
Purushottama G. B, Deshmukh V, Kavungal V, George R. M. An Assessment on Economic Impact of Growth Overfishing of Commercially Important Marine Ariids Along Mumbai, Northwest . Curr World Environ 2016;11(2). Available from: http://www.cwejournal.org/?p=14
Download article (pdf)
Citation Manager
Publish History
Select type of program for download
| Endnote EndNote format (Mac & Win) | |
| Reference Manager Ris format (Win only) | |
| Procite Ris format (Win only) | |
| Medlars Format | |
| RefWorks Format RefWorks format (Mac & Win) | |
| BibTex Format BibTex format (Mac & Win) |
Article Publishing History
| Received: | 2016-05-29 |
|---|---|
| Accepted: | 2016-06-24 |
Introduction
In the era of Susilo Bambang Yudhono’s government (2009-2014), South Sumatra Province, due to its ownership on natural resources, will be developed as a new center for economic growth in western region of Indonesia. This commitment has following by Government of Banyuasin District policy– one of district government in South Sumatra Province –who has making local regulation, Regulation of Banyuasin District 25/2009, to legalizing 8.000 hectares’ wetland area in Tanjung Api-Api (TAA) as new industry area. Similar to experience in many place, industrial area growth due to disruption of hydrological cycle will reducing water quantity and quality. It also can reduce vegetation of forest ecosystem and biodiversity. However, we still have an opportunity to minimize it if all multi-stakeholder committed to realize Sustainable Development Goals (SDGs) which is voiced by United Nations.1
As we know, long time before SDGs, environmental issues have been expressed by Thomas Malthus through his famous statement: "population, when unchecked, increases in a geometrical ratio. Subsistence increases only in an arithmetical ratio".2 It has been developing more complexity when industrialization, as a result of Industrial Revolution (1750-1870) in United Kingdom, spread up around the world.3 In the 19th century, environmental issues has been articulated by the Limits to Growth4 and Our Common Future.5 United Nations, then, has been guard this issues through Millennium Development Goals (MDGs) and Sustainable Development Goals (SDGs) in 21th century.1,6
In the 21st century, complexity of environmental problems has challenging governments to: (a) assessing the state of environmental pollution; (b) evaluating this pollution in relation to human welfare or ecosystem; (c) controlling polluting activities by means of regulations, economics incentives and/or training, moral persuasion, information campaign, and collaborative contractual arrangement with a target selected groups7. Government should be involving non-governmental actors (markets and society) due to the fact that environmental issues are very dynamic, heterogeneous, local but global impact, and cannot be managed by government alone. Governments could choose a variety of policy instruments to maximize its role in preserving the environment.8
From academic point of view, one of instrument to controlling environmental problems is understanding the interplay of human activity with the physical environment, biological, and social represented in certain models.9 There are a lot of models in literature and reality. Its development is never ending process, because it still continues to developing until now. One type of these models is Environmentally Sensitive Investment System (ESIS).10 The final goal of this model is to provide industry and governmental departments or agencies with a tool to assess the technical and economic implications of capital-intensive projects, in response to stated environmental policies. More specifically, the ESIS prototype helps to find wastewater management alternatives that meet environmental regulatory standards given in a technologically sound and cost-efficient manner. The use of this decision support system will enhance the ability of managers and planners to explore the quantitative implications of a wide range of options.11
In this paper, we apply ESIS framework to analyze WWTP design for TAA area in Banyuasin District, South Sumatera Province, Indonesia. This study is very important because of selecting appropriate technology for wastewater treatment should be based on area-specific integrated factors such as land availability, wastewater quality, desired finished water quality, socio-economic factors and local and provincial regulations12.
Material and Methods
We use quantitative approach to guide this research. We choose Gasing area in Banyuasin district as location to collecting primary and secondary data due to its similarity with TAA area. For example, Gasing area has agro-industry (i.e.: rubber, palm oil, and coconut) and its natural landscape does not much different with TAA area. Table 1 summarized location, time and type of data that will collected in this research.10
Table 1: Location, time, and type of research data
|
Location and research time |
Primary and secondary data |
|
Several WWTP agro-industry in Gasing area, Banyuasin District, such as rubber, palm oil, and coconutoil (Nov – Dec 2009) |
Primary data, chemistry: (a) organic waste (fatty oils); (b) non-organic waste (pH, BOD, COD); (c) waste concentration. Primary data, physic: (a) TSS; (b) WWTP capacity; (c) waste discharge |
|
Note: All data had been analyzed in Laboratory of Environment, Environmental Agency (BLH), South Sumatera Province. |
|
We are conducted this research through two phases. In the first phase, we collecting physical and chemical parameter of wastewater from several WWTP of agro-industry in Gasing area. All data will be compared to value in Liquid Waste Quality Standard (LWQS) (see, Table 2). We apply composite technique (in water surface to a depth of 0,5 m)13to collect waste sample.
Table 2: Liquid Waste Quality Standard (LWQS) for severalagro-industry in South Sumatra
|
Wastewater discharge (m3/ton) |
Liquid waste quality standard Maximum level of content(mg/l)/Maximum load (kg/ton) |
||||||
|
BOD5 |
COD |
TSS |
O & G |
N-Tot |
PO4 |
Phenol |
|
|
Tire (40) |
60/2,4 |
200/8 |
100/4 |
- |
10/0,4 |
- |
- |
|
Rubber(40) |
100/4 |
250/10 |
100/4 |
- |
25/1,0 |
- |
- |
|
Soap (8) |
75/0,60 |
180/1.44 |
60/0,48 |
15/0,12 |
- |
2/0,016 |
- |
|
Detergent (1) |
75/0,075 |
180/1,18 |
60/0,06 |
15/0,015 |
- |
2/0.002 |
- |
|
Plywood(0,3) |
75/0,0225 |
125/0,0375 |
50/0,015 |
- |
4/0,0012 |
- |
0,25/0,0007 |
|
Tools from rubber (40) |
60/2,4 |
200/8 |
100/4 |
- |
10/0,4 |
- |
- |
|
Coconut oil (25) |
75/1,875 |
180/4,50 |
60/1.50 |
5/0,375 |
- |
2/ 0,05 |
- |
|
Palm oil (2,5) |
100/0,25 |
350/0,88 |
250/0,63 |
25/0,063 |
50/0,125 |
- |
- |
|
Coffee (40) |
75/3,0 |
200/8,0 |
100/4,0 |
20/0,8 |
- |
- |
- |
|
Source: Regulation of South Sumatra Governor Number 18 of 2005 on Liquid Waste Quality Standard (LWQS) for Industry |
|||||||
We analyzed BOD, TSS, and X from several WWTP influent of agro-industry in Gasing area. We take wastewater sample during WWTP operation in the daytime and stored it in the space provided. These data had been analyzed in Laboratory of Environment, South Sumatra Environment Agency, and compared to LWQS data (see, Table 2).10
Further more, we make WWTP design for TAA area based on calculation material balance for each of treatment stage, that is: (a) primary treatment (primary clarifier, sludge thickener, spill basin and equalization); (b) secondary treatment (secondary clarifier, aeration tank, sludge mixing, and sludge dewatering). We expected the final result of TSS should be below from LWQS value. In primary and secondary treatment, we following algorithm, variable, constant, and unit as developed by Fels & Lycon (1995).10
Table 3: Agro-industry WWTP parameter in Gasing area
|
WWTP influent |
Parameter |
Sampling frequency |
|
Rubber, palm oil, and coconut oil |
Q , TSS, BOD, and X |
One time for each category of parameter |
In the second phase, we compared three models of WWTP (Gasing WWTP, TAA WWTP, and Theoretical WWTP) by simulating variables in primary and secondary treatment. In this simulation, range of each variable following Fels & Lycon (1995)10 data. Our goal is to get dimension of unit in each treatment that can be used as a reference for TAA WWTP (e.g., Q1/A1, H, T, QE4/AR4, and r4). We are looking for WTTP that release TSS value lower than LWQS agro-industry threshold. Simulation data are shown in Table 4.
Table 4: WWTP variable for simulation
|
Variable in Gasing WWTP, TanjungApi-Api (TAA) WWTP, and Theoretical WWTP |
Parameter |
|
Primary clarifier over flow, Q1/A1, |
TSS |
|
Tinggi primary and secondary clarifier, H |
TSS |
|
Temperature in the aeration tank, Ta and Temperature in the clarifier, Tc |
TSS |
|
Secondary clarifier over flow concentration, QE4/AR4 |
TSS |
|
Average MLSS bio-solids in the reactor, XE4 |
TSS |
|
Residence time in reactor, r4 |
TSS |
Result and Discussion
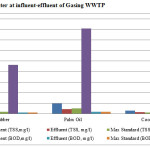
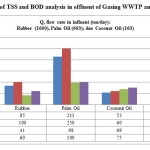
In Gasing area, rubber industry WWTP outlet produce TSS (125 mg/l) and BOD (64,1 mg/l) that exceeded LWQS value. For palm oil industry, its WWTP outlet release TSS (220 mg/l) and BOD (89,9 mg/l) that lower than LWQS value. However, its distance is not too far. Meanwhile, TSS (83 mg/l) and BOD (69,9 mg/l) value for coconut oil industry WWTP indicate that their WWTP does not functioning properly (see, Figure 1).
 |
|
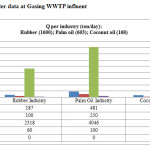
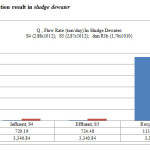
In the second phase, we analyzed and calculated mass balance in TAA WWTP for each stage (pre-treatment, primary treatment, and secondary treatment). Figure 2 shows sample data from Gasing WWTP as an input for primary treatment.
 |
|
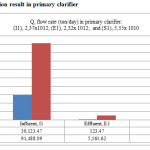
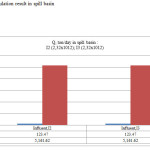
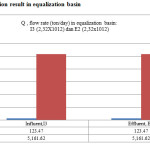
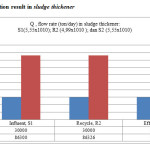
The early stage of primary treatment is primary clarifier which aims to separate wastewater and sludge. Through physical and chemical process, primary clarifier will be forming two zones. Chemical process using coagulation technique, adding CaCO3. In this process, we maintain wastewater pH between 6,5 to 8,5. Figure 3, Figure 4, Figure 5 show primary treatment result.
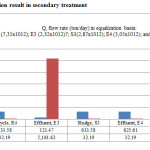
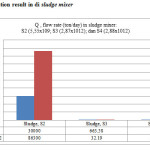
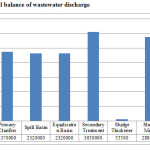
In secondary treatment, activated sludge is derived from equalization basin. We injected air, nitrogen, and phosphorus into reactor to trigger anaerobic process. Waste flow are discharged into river, while sludge directing to sludge mixing and sludge dewatering. We injected polymer to sludge dewatering so that it can produce more precipitate. All sludge from sludge dewatering will collected and save into removal facilities. Calculation result of secondary treatment is visualized by Figure 6 – Figure 9. Meanwhile, Figure 10 display mass balance of wastewater discharge calculation in each treatment.
 |
|
 |
|
 |
|
 |
|
 |
|
 |
|
 |
|
 |
|
If we compare TSS and BOD value from E5 in TAA WWTP and Gasing WWTP effluent, then our simulation shows that TAA WWTP will produce TSS and BOD lower than LWQS. This simulation using data from Fels & Lycon (1995)10 experiment (see Table 5). Even though quantity and quality of wastewater in Gasing area sill under LWQS threshold for each industry, but its value is near to LWQS limits as indicated by TSS (rubber: 85 mg/l; palm oil: 213 mg/l; coconut oil: 53 mg/l) and BOD (rubber: 41 mg/l, palm oil: 98 mg/l; coconut oil: 69 mg/l) value. In addition, palm oil and coconut oil industry have solid waste that contain high organic compound so that it takes longer time to unravel.
Table 5: Result of TSS and BOD analysis in effluent of Gasing WWTP and TAA WWTP
|
Wastewater parameter in effluent |
Agro-industry WWTP, with Q Influent (ton/day) |
|||
|
Gasing WWTP |
TAA WWTP, (2.371) |
|||
|
Rubber, (1600) |
Palm oil, (603) |
Coconut oil, (163) |
||
|
TSS, mg/l |
85/100* |
213/250* |
53/60* |
87,16/200* |
|
BOD, mg/l |
41/60* |
98/100* |
69/75* |
32,19/50* |
|
(*) mg/l/load or kg/ton (max), based on Regulation of South Sumatra Governor Number 18 of 2005 on Liquid Waste Quality Standard (LWQS) for Industry |
||||
 |
|
Furthermore, we will explain Q1/A1 value based on simulation in primary clarifier for TAA WWTP and Gasing WWTP (rubber, palm oil, and coconut oil). We call output of these WWTP as effluent (E5). Range value for this simulation using data from Fels & Lycon (1995) experiment. This simulation will produce the best model as reference for development of TAA WWTP. In this simulation, we achieve the best model when TSS does not exceeded LWQS value and it is safety when it released into river. As show Table 6, according to our simulation, the best model for TAA WWTP design is achieved when: TSS (78,16 mg/l), Q1/A1 range value (20,25 m3/m2/day), and Q (2.371 ton/day). We obtained different result for TSS due to different on wastewater treatment management in each industry. For example, there is agro-industry in Gasing area who (a) does not deposited sludge in primary treatment into sludge thickener so that sludge cannot be separated perfectly, and (b) primary treatment without going through spill basin so that many sludge passes to the next process.
Table 6: Result of Q1/A1 simulation in Primary Clarifier
|
Q1/A1, m3/m2hr |
TSS of Gasing WWTP |
TSS of TAA WWTP |
||
|
Rubber |
Palm oil |
Coconut oil |
||
|
10,00 |
209 |
227 |
218 |
105,29 |
|
20,25 |
183 |
215 |
196 |
87,16 |
|
30,00 |
- |
- |
- |
74,89 |
|
50,00 |
- |
- |
- |
58,12 |
If we compare TAA WWTP with WWTP in Gasing area, then we found that TAA WWTP can reduce TSS as much as 52,37% per day (rubber), 59,46% per day (palm oil), and 55,53% per day (coconut oil). It is mean that TAA WWTP can protect wetland ecosystem from agro-industry wastewater. The results of primary treatment simulation show that if variations for Q1/A1 between 10-50 m3/m2/day, where range value for TAA WWTP is Q1/A1> 50 m3/m2/day, then TSS in effluent (E5) were release into river will be smaller.
For secondary treatment simulation, our variation has produced result as follow: (a) if overflow limit in secondary treatment for TAA WWTP is QE4/AR4 (16-26) m3/m2/day, then safety condition is QE4/AR4< 16 m3/m2hr; (b) Simulation for recycle (XR4) stream for 12.000 – 15.000 mg/l variation produced safety condition for TAA WWTP at XR4 < 10.000 mg/hour;(c) variation XE4 between 2.500 – 5.000 mg/l produced XE4> 5000 mg/l; and (d) when residence time (r4) in reactor made between 14 – 22 hour, then r4 for TAA WWTP is r4< 14 hours. Based on these result, we can say that if QE4/AR4< 16 m3/m2hr, XR4 < 10.000 mg/hour, XE4> 5000 mg/l, and r4< 14 hours, then TAA WWTP will produces small TSS. Data simulation in primary and secondary treatment for TAA WWTP can be seen in Table 7.
Table 7: Primary and secondary treatment data variables in WWTP
|
Unit |
Range of TAA WWTP |
With theoretical WWTP value: TAA WWTP: TSS (87,16 mg/l) and sludge (719,21 mg/l) |
|||||
|
TSS |
Sludge |
TSS |
Sludge |
TSS |
Sludge |
||
|
Q1/A1,m3/m2/day |
Q1/A1> 50 |
10 |
30 |
50 |
|||
|
105,29 |
856,81 |
74,89 |
626,13 |
58,12 |
498,85 |
||
|
QE4/AR4,m3/m2/day |
QE4/AR4< 16 |
16 |
20 |
26 |
|||
|
87,16 |
719,21 |
93,47 |
718,78 |
102,93 |
718,14 |
||
|
XE4, mg/l |
XE4 > 5000 |
2.500 |
4000 |
5000 |
|||
|
91,75 |
744,90 |
77,99 |
671,64 |
68,81 |
68,81 |
||
|
XR4, mg/l |
XR4 < 10.000 |
10.000 |
13.000 |
15.000 |
|||
|
80,28 |
682,42 |
88,22 |
725,16 |
91,74 |
745,65 |
||
|
r4,hour |
r4 < 14 |
14 |
16 |
22 |
|||
|
87,161 |
719,21 |
87,162 |
719,21 |
87,166 |
719,21 |
||
|
Note: Limit for unit and variable in primary and secondary treatment following Fels and Lycon (1995)10 experiment. |
|||||||
Based on manual calculation using ESIS model, we find that wastewater discharge (Q) in E5 that will be release into the river as much as ton/day, contains 87.16 mg/l TSS and 32.19 mg/l BOD. Sludge dewatering has produce TSS as much as 724,28 mg/l/day and deposited it into sludge removal facilities. Although WWTP output in E5 and S5 still contains sludge, but to avoid new pollution, this sludge can be transformed into more valuable products. The same action can also be applied for sludge in secondary treatment (E5). If we compare TAA WWTP with WWTP in Gasing area, then we found that TAA WWTP can reduce TSS as much as 52,37% per day (rubber), 59,46% per day (palm oil), and 55,53% per day (coconut oil). It is mean that TAA WWTP can protect wetland ecosystem from agro-industry wastewater. Based on this finding, we recommend that (a) it is important to make baseline study to investigate physical and chemical parameters in Sungai Telang and Gasing River. This baseline study will be primary referencing to determine the impact of TAA WWTP to its environment; (b) for government and industry, we need concrete action to utilize sludge in Gasing area for profit-making activity.
As a conclusion, our research show that environmental problem is still important issue in industrial development, especially in South Sumatera, Indonesia. Local government need to apply various methods to managing it. Our research show that ESIS model could be appropriate model to assist local government for enhancing their role as environmental guard. However, in the future, we need attention to the possibility for applying mix-methods to analyzing WWTP in industrial zone.
Acknowledgement
This research was funded by Bina Darma University based on contract number: 006/SPK/LPPM/Univ-BD/VII/2011, 04/08/2011. We would like to thanks for all people who had been supported this project.
Reference
- United Nations. Transforming our world: the 2030 Agenda for Sustaianable Development. (United Nations, 2015).
- Malthus, T. An essay on the principle of population. (J. Jhonson, 1798).
- Hart, M. H. Uderstanding Human Story. (Washington Summit Publishers, 2007).
- Meadows, D. H., Meadows, D. L., Randers, J. & Behrens III, W. W. The limits to growth: a report for the Club of Rome’s project on the predicament of mankind. (Universe Books, 1973). doi:10.1016/0007-6813(73)90029-3
CrossRef - Bruntland et.al, G. H. Our Common Future: Report of the World Commision on Environtment and Development. (United Nations, 1989).
- United Nations. The Millennium Development Goals Report 2015. (United Nations, 2015).
- Knoepfel, P. Environtmental Policy Analysis: Learning from the Past for the Future. (Springer-Verlag, 2007).
- Huppes, G. & Simonis, U. E. in Principles of Environmental Sciences (eds. Boersema, J. J. & Reijnders, L.) 239–279 (Springer Science + Business Media B.V., 2009).
- de Vries, H. J. M. (Bert). in Principles of Environmental Sciences (eds. Boersema, J. J. & Reijnders, L.) 345–371 (Springer Science + Business Media B.V, 2009).
- Fels, M. & Lycon, D. Environmentally Sensitive Investment System (ESIS): Wastewater Treatment Models. (Technical University of Nova Scotia, 1995).
- Pintér, J., Fels, M., Lycon, D. S., Meeuwig, J. W. & Meeuwig, D. J. An intelligent decision support system for assisting industrial wastewater management. Annals of Operations Research 58, 455–477 (1995).
CrossRef - Abbassi, B. & Al-Baz, I. in Efficient Management of Wastewater (eds. Baz, I. Al, Otterpohl, R. & Wendland, C.) 29–40 (Springer Berlin Heidelberg, 2008). doi:10.1007/978-3-540-74492-4_3
CrossRef - Hadi, A. Prinsip Pengelolaan Pengambilan Sampel Lingkungan. (Gramedia Pustaka Utama, 1995).


