Qualitative Assessment of Mine Water of the Western Jharia Coalfield Area, Jharkhand, India
Anjani Kumar1 * and Prasoon Kumar Singh1
http://dx.doi.org/10.12944/CWE.11.1.37
A geochemical study of mine water in the Western Jharia coalfield area was undertaken to assess its quality and suitability for drinking and domestic purposes. To assess mine water quality of the study area, a systematic sampling was carried out during the monsoon season, 2013. Eighteen representatives mine water sample were collected from both underground (underground sump and surface water discharge) and opencast mines, and analyzed for pH, electrical conductivity (EC), total dissolved solids (TDS) , major cations (Ca2+, Mg2+, Na+ and K+) and major anions (HCO3- F-, Cl-, NO3-, SO42-). The pH of the analyzed mine waters ranged from 6.8 o 8.3 and electrical conductivity (EC) values ranged from 608 uS cm-1 to 1350 uS cm-1. TDS ranged from 432 to 1080 mg L-1 and the spatial differences in TDS reflect the geological formations, hydrological processes and prevailing mining conditions of the region. The anion and cation chemistry indicate the general ionic abundance as: HCO3-> SO42-> Cl-> NO3->F- and Mg2+>Ca2+> Na+> K+ in the mine water of the study area. The water quality assessment indicated that total dissolved solids (TDS), total hardness (TH), magnesium and sulphate are the major parameters of concern in the study area and make it unsuitable for drinking and domestic purposes.
Copy the following to cite this article:
Kumar A, Singh P. K. Qualitative Assessment of Mine Water of the Western Jharia Coalfield Area, Jharkhand, India. Curr World Environ 2016;11(1) DOI:http://dx.doi.org/10.12944/CWE.11.1.37
Copy the following to cite this URL:
Kumar A, Singh P. K. Qualitative Assessment of Mine Water of the Western Jharia Coalfield Area, Jharkhand, India. Curr World Environ 2016;11(1). Available from: http://www.cwejournal.org/?p=13731
Download article (pdf)
Citation Manager
Publish History
Introduction
Rapid urbanization and industrial development during last decade have provoked some serious concerns for the environment.1 In the last few decades, due to rapid industrialization and increase in human population, there has been a tremendous pressure on the demand of fresh water.2,3 Water quality plays an important role in promoting agricultural production and standard of human health. Water quality is much depending on the desired use of water, hence different uses require different criteria of water quality assessment as well as standard method for reporting and comparing result of water analysis.4,5 Water quality analysis and statistical methods are very useful and efficient for assessing the quality of water and for communicating the information on overall quality of water.14-28
Mining threatens the quality and quantity of surface and ground water resources in many parts of India.6-13 Water pollution in mining areas is mainly due to overburden (OB) dumps, surface impoundments, mine water, industrial effluents, acid mine drainage, tailing ponds etc.,2 Mining’s impacts on the natural water environment may be observed throughout the life cycle of a mine and even long after mine closure.29 The large volumes of water can be released from aquifers during opencast and underground coal mining operations. Even a few weight percent of sulphide minerals in coal or mine waste has the potential to generate acidic conditions and create significant environmental degradation.30 The coal mining activity in India started decades back, since then the groundwater is getting affected. Along with coal mining, leachates generated from large number of industrial waste and overburden dumps that are in abundance around the mining areas, may reach the groundwater and may adversely affect its quality.8 Several studies have reported that anthropogenic activities can adversely affect the water quality by introducing contaminants.31,32 Coal has relatively high importance for the economical growth of a country. The Mining industry in India is a major economic activity which contributes significantly to the economy of country. The GDP contribution of the mining industry varies from 2.2% to 2.5% only, but going by the GDP of the total industrial sector it contributes around 10% to 11%.33 Bharat Coking Coal Limited (BCCL), A Mini Ratna company (a subsidiary of Coal India Ltd.), Government of India undertaking, is the major coal mining company and only producer of prime coking coal in India. It operates in Jharia Coal Field (JCF), one of the oldest and important coalfields of India where mining is continuing since more than 125 years.33 The quality of mine water depends on a series of geological, hydrological and mining conditions, which vary significantly from mine to mine.29,37 The discharged mine water varies greatly in the concentration of contaminants and in some cases it may even meet the drinking water specifications.12 Many times, the discharged mine water as such is not usable and may contain unacceptable levels of heavy metals, toxic anions, organic and biological contaminants.8,7 A long history of unscientific exploitation of the Jharia coalfield has caused environmental problems, including water resource depletion and contamination.6,13,21,34-36 In recent times, many researchers in India have shown keen interest in the key environmental parameters in the mining regions of the country.9,20, 53-61
The mine water resources available in the study area may be harnessed for utilization in the irrigation, industrial and even in drinking water purposes after treatment. This will not only solve the problem of water scarcity of the area but also help in controlling the water pollution threat. In this background, it is observed that a proper study is required for the assessment/evaluation of this huge mine water, development of suitable techniques for ascertaining its suitability and utilization of the same for the society, thereby converting waste to wealth. Hence, the samples were collected from different mines of study area including Damoda underground, Phularitand 10 seam underground, Jogidih Adarsh colony, Kharkhari 16 seam, Shatabadi Open Cast Project (OCP), Muraidih OCP, Jamunia OCP etc. and the qualitative assessment was done to evaluate mine water quality relative to drinking and domestic uses.
Study Area
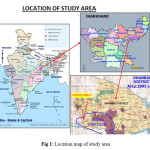
The study area lies in the Western part of the Jharia coalfield and is bounded within the latitude 23º42´ N and 23º49´ N and longitude 86º08´E and 86º19´E (Figure 1). The Jharia coalfield stretches from west to east in the shape of sickle. The Jharia coalfield (JCF) is India’s largest and most extensively developed coalfield, and has been mined for more than a century. It is India’s sole repository of much-needed coking coal. It is situated about 260 km northwest of Calcutta in the heart of the Damodar Valley, mainly along the north of this river. The coalfield lies within the district of Dhanbad and is in the northeastern margin. The coalfield is named after the chief mining centre Jharia that is situated in the eastern part of the field. The field is roughly sickle shaped its longer axis running northwest – southeast. The coal basin extends for about 8 km in an east west direction and a maximum of 18 km in north south direction. The climate of the place is typical monsoon type with maximum precipitation occurring in the month of June to September. During the summer months (April to June) the temperature goes as high as 48°C. The minimum summer temperature is around 20°C. The winters (November to February) are cold and temperature drops down to 6°C. The highest percentage of wind blows in the West. The monsoon breaks in June and lasts till October. The average rainfall for the area is 1272 mm. The highest recorded rainfall is 1851 mm in 1997 and the lowest recorded rainfall is 744 mm in 2004.41
 |
|
Geology of Study Area
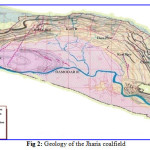
Geologically, the major feature is the great coal basin of this region with intervening areas of crystalline rocks. The ancient rock types of Dharwar and post Dharwars period form the basement rock over which the Lower-Gondwana group of sedimentary strata consisting of coal seams and patches of sandstone are formed.38 The region is important for its large reserves of Lower-Gondwana coal distributed in these fields, the Jharia and Chandrapura coalfields and the Barakar series, which extends into the Raniganj coalfield in the West Bengal. The main axis of the Jharia coalfield basin runs West- North - West-East-South-East and is petering gently towards West and can be seen by the dips of the Raniganj strata along the Jamunia River. This line of axis is neither straight nor curved in simple manner, but it is corrugated due to the forces probably coming from east to west. The Jharia coalfield is formed of sedimentary deposit in Damodar River valley. The geological sequences consist of metamorphic rocks in the base and overlain by Talchir formation followed by Barakar Formation.39,40 This Barakar Formation is the main coal bearing measure. In the places where there are high populations density mining is still done by underground methods. This occupies in the South-Central part of the coalfield where most of the mines are underground because of the thick layer of the Barren Measures and is the uppermost coal bearing sequence of the Jharia coalfield. This measure is located at the south west part of the coalfield. The detailed geology of the Jharia coalfield is shown in Figure 2.
 |
|
Materials and Methodology
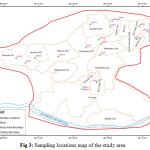
To assess mine water quality of the Western Jharia coalfield area, a systematic sampling was carried out during the monsoon season, 2013 for analysis. Eighteen representatives mine water samples were collected from different mines of the study area. Out of these, thirteen were from Underground coal mines and five were from OCP (Open Cast Project) coal mines (Table 1 and Figure. 3). The mine water samples were collected in 1 L narrow-mouthed pre-washed high-density polyethylene bottles. Water quality parameters such as pH, temperature, and electrical conductivity were measured immediately after the collection of the samples by using Portable Multi Parameter Tester 35 Series. For other parameters such as major cations (Ca2+, Mg2+, Na+ and K+) and major anions (F-, Cl-, HCO3- , SO4 2- and NO3 -), samples were suitably preserved and sent to the laboratory, where detailed analysis was carried out as per the Standard Methods for the Examination of Water and Wastewater.42 The details of sampling locations along with their latitude and longitude are illustrated in the Table 1 and Figure 3.
Table 1: Details of sampling locations of the study area.
|
Sampling Code |
Locations |
Latitude ( Degree decimal) |
Longitude (Degree decimal) |
|
MW1 |
Damoda Underground |
23.77 |
86.17 |
|
MW2 |
Phularitand 10 seam Underground |
23.78 |
86.23 |
|
MW3 |
Block IV, 3 Seam Undergound |
23.81 |
86.25 |
|
MW4 |
Jogidih (Adarsh Colony) |
23.81 |
86.26 |
|
MW5 |
Jogidih 5,6,7 Undergorund |
23.80 |
86.25 |
|
MW6 |
Maheshpur 9 top (VIII B) |
23.79 |
86.24 |
|
MW7 |
Kharkhari 16 seam |
23.78 |
86.24 |
|
MW8 |
Tituliya colliery (9 Bottom seam) |
23.79 |
86.28 |
|
MW9 |
Aakash Kinari 1 Seam Underground |
23.80 |
86.28 |
|
MW10 |
Chatabad 4 seam akash kinari |
23.80 |
86.29 |
|
MW11 |
Lohapatti colliery, Pathargaria B seam |
23.74 |
86.23 |
|
MW12 |
Bhurungia colliery |
23.75 |
86.24 |
|
MW13 |
Hantudih |
23.74 |
86.23 |
|
MW14 |
Jamunia OCP |
23.77 |
86.18 |
|
MW15 |
Damoda OCP |
23.77 |
86.16 |
|
MW16 |
Shatabdi OCP |
23.79 |
86.24 |
|
MW17 |
Muraidih OCP |
23.80 |
86.23 |
|
MW18 |
Block II OCP |
23.77 |
86.20 |
 |
|
Results and Discussion
Mine Water Chemistry
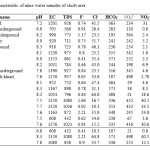
Hydro-chemical characteristic of mine water samples of study area and statistical summary of the analytical results of mine water were compared with the standard guideline values recommended by the World Health Organisation (WHO1997) and Bureau of Indian Standards (BIS 1991) for drinking and public health (Table 2 and Table 3). The pH ranged from 6.8 to 8.3 in the study area. The minimum pH values 6.8 were observed at Phularitand 10 seam underground and maximum values 8.3 observed at. Jogidih 5,6,7 Underground and Bhuringia colliery. The measured EC of the mine water in the study area varied from 608 to 1350 µS cm-1 with an average value of 1080 µS cm-1. The maximum values of electrical conductivity were observed high at Jamunia OCP of the Western Jharia coalfield. Concentration of total dissolved solids (TDS) in the mine water of the study area ranged from 432 to 1080 mg l-1 with an average value of 838 mg l-1. The differences in TDS values may be attributed to the variation in geological formations, hydrological processes and prevailing mining conditions in the region.25 The differences in the TDS and EC values in the water samples collected from the underground mine sumps and pump water discharges in the case of underground mine were not very significant except at few sites. Bicarbonate (HCO3-) and sulphate (SO42-) are the dominant anions in these mine waters, with minor contributions from chloride (Cl-), nitrate (NO3-), and fluoride (F-). The order of anions abundance in the mine water was found as HCO3-> SO42-> Cl-> NO3->F-. Concentration of HCO3 - ranges from 187 mg L-1 to 571 mg L-1, the average HCO3- concentration was 336 mg L-1. HCO3 - is the most dominant anion at the locations of Hantudih, Bhurungia colliery and Lohapatti Colierry. Concentration of sulphate ranged from 21 to 498 mg L-1 with an average value of 253 mg L-1. The variation of sulphate concentration showed higher values for the mine water of Block-II OCP, Hantudih, Phularitand 10 seam UG, Jogidih 5,6,7 seam UG, Kharkhari UG, Mahesh pur 9 top, Titulia colliery, Lohapatti Colliery, Bhurungia Colliery locations. Sulphates in the water are usually derived from the oxidative weathering of sulphide-bearing minerals such as pyrite (FeS2), gypsum (CaSO4. 2H2O) and anhydrite (CaSO4). Jharia coals are poor in sulphur; usually contain less than 1% sulphur. However, mineral pyrite (FeS2) is reported to occur as a secondary mineral in these coals and associated sediments.40 Sulphate causes odour and corrosion of sewers because it gets converted to hydrogen sulphide. It may also cause corrosion of metals in the distribution system, particularly in water with low alkalinity. Chloride concentration in the analysed samples ranged from 10.3 to 64.8 mg L-1 with an average value of 33.7 mg L-1. Chloride is present in lower concentrations in common rock types than any other major constituents of natural water. It is assumed that bulk of the chloride in water is derived primarily from halite, sea spray, brines and hot springs. Abnormal concentration of chloride may result from anthropogenic sources including agricultural runoff, domestic and industrial wastes and leaching of saline residues in the soil. The large lateral variation in the Cl- concentration and observed high values in some mine water samples indicate local recharge and may be attributed to the contamination by untreated industrial and mining waste effluents. Concentration of NO3- ranged from 0.8 to 40.5mg L-1 and average concentration value was 12.5 mg L-1. The chief sources of the nitrate are biological fixation, atmospheric precipitation and the application of fertilizers and industrial sewage.44 The use of explosive in the mining areas may also be one possible source of nitrate in the mine water. Concentration of fluoride in the samples ranged from 0.41 to 2.21 mg L-1 with an avg. 0.9 mg L-1. In general, concentrations of F- were found to be low as compared with the other anions. Higher F- values in these samples may be due to the weathering of fluoride bearing minerals such as biotite, muscovite, fluorite and apatite, which occur as accessory minerals in the granites, granite-gneisses and intrusive rocks of the area. Higher concentration of fluoride causes dental and skeletal fluorosis such as mottling of teeth, deformation of ligaments and bending of spinal chord.15 Except for a few samples, concentrations of F- did not exceed the prescribed limit.
Among major cations, magnesium was the dominant ions representing on average 37% of total cations. Calcium and sodium ions were of secondary importance, representing on average 34% and 26% of total cations, respectively. Potassium was least dominant cation and representing 3% of the total cations (Fig. 3b). The order of cation abundance in the mine water was Mg2+>Ca2+> Na+> K+. Concentration of Ca2+ in the samples varied from minimum value of 24.1 mg L-1 to maximum value of 133 mg L-1 with an average of 68.2 mg L-1. The higher values were found in the Block IV 3rd seam underground, Phularitand 10 seam underground, Maheshpur 9 top, and Chatabad 4 seam. Concentration of Mg2+ in the samples varied from16.9 to 123 mg L-1 with an average value of 73 mg L-1. Concentration of Ca2+ and Mg2+ are exceeding the desirable limits of 75 mg L-1 and 30 mg L-1 in 50 % and 78 % of the mine water samples respectively. The presence of calcium and magnesium make the water hard (4). Na +and K+ in the aquatic system are mainly derived from the atmospheric deposition; evaporate dissolution and silicate weathering.45 Weathering silicates such as albite, anorthite and orthoclase are the possible source minerals for the Na + and K + in the present study area.46,47 The evaporate encrustations of Na+/K+ salts developed due to cyclic wetting and drying periods of Damodar River cause the formation of alkaline/saline soils, which may also serve as a source of Na+ and K+.48 Total hardness (TH) is the property attributed to the presence of alkaline earths in solution. On the basis of hardness, water can be classified as soft (<75 mg L-1), moderately hard (75–150 mg L-1), hard (150–300 mg L-1) and very hard (>300 mg L-1 ) water (Sawyer and McCarty 1967(49). The hardness of the analysed samples varied from 135 to 738 mg L-1 (avg. 468 mg L-1), indicating moderately hard to very hard types of water in the study area. The data indicate that 33 % of the mine water samples have TH values higher than desirable limit of 300 mg L-1, and 40% samples exceed the maximum permissible limit of 600 mg L-1.43 Hardness has no known adverse effect on health, but it can prevent the formation of lather with soap and increases the boiling point of the water. The high TH may cause precipitation of calcium carbonate and encrustation on water supply distribution systems. Long-term consumption of extremely hard water might lead to an increased incidence of urolithiasis, anencephaly, parental mortality, some types of cancer and cardio-vascular disorders.50,51
 |
|
Table 3: Statistical summary of measured parameters in the mine water, compared to prescribed limits of WHO 1997 and Indian standards BIS 1991 for drinking water.
|
WHO (1997) |
BIS(1991) |
||||||
|
Parameters |
Minimum |
Maximum |
Average |
Maximum desirable |
Highest permissible |
Maximum desirable |
Highest permissible |
|
pH |
6.8 |
8.3 |
7.8 |
7.0-8.5 |
6.5-9.2 |
6.5-8.5 |
8.5-9.2 |
|
EC |
608 |
1350 |
1080 |
750 |
1,500 |
_ |
_ |
|
TDS |
432 |
1080 |
838 |
500 |
1.5 |
500 |
2,000 |
|
F- |
0.41 |
2.21 |
0.9 |
0.6-0.9 |
600 |
1 |
1.5 |
|
Cl- |
10.3 |
64.8 |
33.7 |
250 |
600 |
250 |
1,000 |
|
HCO3- |
187 |
571 |
336 |
200 |
600 |
200 |
600 |
|
SO42- |
21 |
498 |
253 |
200 |
200 |
200 |
400 |
|
NO3- |
0.8 |
40.5 |
12.5 |
_ |
_ |
45 |
100 |
|
Ca2+ |
24.1 |
133 |
68.2 |
75 |
200 |
_ |
_ |
|
Mg2+ |
16.9 |
123 |
73 |
30 |
150 |
75 |
200 |
|
Na+ |
15.2 |
196.9 |
52 |
_ |
_ |
_ |
_ |
|
K+ |
1.7 |
8.5 |
5.3 |
_ |
_ |
_ |
_ |
|
TH |
135 |
738 |
468 |
100 |
500 |
300 |
600 |
All concentration in mg L-1, except pH and EC (µS cm-1)
Conclusion
The mine water of the Jharia coalfield is mildly acidic to alkaline in nature. The chemistry of mine water is dominated by Mg2+ and Ca2+ and HCO3- and SO42-. In majority of the samples, the analyzed parameters are well within the desirable limits. However, higher concentration of EC, TDS, SO42- and TH in a number of mine water samples as such make it unsafe for drinking uses. Our results suggest that the chemical composition of the mine water of the study area is largely controlled by rock weathering with minor contributions from mining sources. The presence of water at mining sites creates a range of operational and stability problems and requires an effective water management strategy for drinking purpose after treatment and disinfection.
Acknowledgement
The authors are grateful to Professor D. C. Panigarhi, Director, Indian School of Mines for his kind support and sincerely thankful to the Head of the Department of Environmental Science & Engineering, Indian School of Mines, Dhanbad, India, for his moral support and suggestions in the preparation of the paper. We are also thankful to lab members for their support and encouragement.
References
- Reza R, and Singh G: Assessment of Heavy Metal Contamination and its Indexing Approach for River Water, Int. J. Environ. Sci. Tech., 7 (4), 785-792. (2010).
CrossRef - Singh P, Tiwari AK, Singh PK: Hydrochemical characteristic and quality assessment of groundwater of Ranchi township area, Jharkhand, India. Curr World Environ 9(3):804–813. DOI:10. 12944/CWE.9.3.30 (2014).
- Chandra S, Singh PK, Tiwari AK, Panigrahy B, Kumar A: Evaluation of hydrogeological factor and their relationship with seasonal water table fluctuation in Dhanbad district, Jharkhand, India. ISH Journal of Hydraulic Engineering 21(2):193–206. DOI:10.1080/ 09715010.2014.1002542. (2015).
- Tiwari AK, Singh AK, Singh AK, Singh MP: Hydrogeochemical analysis and evaluation of surface water quality of Pratapgarh district, Uttar Pradesh, India, Applied Water Science. DOI: 10.1007/s13201-015-0313-z. (2015).
CrossRef - Tiwari AK, Singh PK, Mahato MK: Hydrogeochemical investigation and qualitative assessment of surface water resources in West Bokaro coalfield, India. Journal of the Geological Society of India 87(1):85-96 (2016).
CrossRef - Choubey VD: Hydrological and environmental impact of coal mining, Jharia coalfield, India. Environ Geol 17:185–194(1991).
- Gupta DC: Environmental aspects of selected trace elements associated with coal and natural waters of Pench valley coalfield of India and their impact on human health. Inter Journ Coal Geol 40:133–149(1999).
CrossRef - Khan R, Israili SH, Ahmad H, Mohan: A Heavy metal pollution assessment in surface water bodies and its suitability for irrigation around the Nayevli lignite mines and associated industrial complex, Tamil Nadu, India. Mine Water Environ 24:155–161(2005).
CrossRef - Singh G: Augmentation of underground pumped out water for potable purpose from coal mines of Jharia coalfield. Proceedings of 5th International Mine Water Congress, vol 2, Nottingham, UK, pp 679–689(1994).
- Singh G: Impact of coal mining on mine water quality. Int J Mine Water 7:45–59(1998).
- Singh AK, Mondal GC, Singh S, Singh PK, Singh TB, Tewary BK, Sinha A: Aquatic geochemistry of Dhanbad district, coal city of India: source evaluation and quality assessment. J Geol Soc Ind 69:1088–1102 (2007).
- Singh AK, Mahato M, Neogi B, Singh KK: Quality assessment of mine water in the Raniganj coalfield area, India. Mine Water Environ 29:248–262 (2010).
CrossRef - Tiwary RK: Environmental impact of coal mining on water regime and its management. Water Air Soil Pollut 132:185–199(2001).
CrossRef - Krishan G, Rao MS, Kumar CP, Garg Pankaj SP: Assessment of salinity and groundwater quality with special emphasis to fluoride in a semi-arid region of India. J Earth Sci Clim Change 5:149 (2014).
- Tiwari AK, Singh AK: Hydrogeochemical investigation and groundwater quality assessment of Pratapgarh district, Uttar Pradesh. Journal of the Geological Society of India83(3):329-343 (2014).
CrossRef - Verma AK, Singh TN: Prediction of water quality from simple field parameters. Environ Earth Sci 69:821–829(2013).
- Krishan G, Singh S, Singh RP, Ghosh NC, Khanna A (2016). Water quality index of groundwater in Haridwar district, Uttarakhand, India. Water and Energy International. 58(10): 55-58 (2016).
- Tiwari AK, Singh PK, Mahato MK: Environmental Geochemistry and a Quality Assessment of Mine Water of the West Bokaro Coalfield, India. Mine Water and the Environment. DOI: 10.1007/s10230-015-0382-0. (2016)
- Shinde S, Patil K, Sadgir P: Gis based groundwater quality mapping in southern part of Aurangabad city, Maharashtra, India. International Journal of Advances in Engineering & Technology 9(1):129-134 (2016).
- Singh G, Kamal RK: Application of water quality index for assessmentof surface water quality status in Goa. Current World Environment 3:994-1000 (2014).
- Tiwari AK, De Maio M, Singh PK, Singh AK: Hydrogeochemical characterization and groundwater quality assessment in a coal mining area, India. Arabian Journal of Geosciences, 9(3):1-17 (2016). DOI: 10.1007/s12517-015-2209-5.
- Singh P, Tiwari AK, Singh PK: Assessment of groundwater quality of Ranchi township area, Jharkhand, India by using water quality index method. Int J Chem Tech Res 7(01):73–79(2015a).
- Singh AK, Raj B, Tiwari AK, Mahato MK: Evaluation of hydrogeochemical processes and groundwater quality in the Jhansi district of Bundelkhand region, India. Environmental Earth Sciences 70(3): 1225-1247 (2013).
- Nasri N, Bouhlila R, Riadh A: Multivariate statistical analysis of saline water—a case study: Sabkha Oum Lekhialate (Tunisia). Int J Environ Sci Dev 6:40–43. DOI:10.7763/IJESD (2015).
- Singh PK, Panigrahy BP, Tiwari AK, Kumar B, Verma P :A statistical evaluation for the groundwater quality of Jharia coalfield, India. Int J Chem Tech Res 7(4):1880–1888 (2015).
- Chopra RPS, and Gopal K: Assessment of groundwater quality in Punjab. Journal of Earth Science and Climate Change 5(10):243 (2014).
- Tiwari AK, De Maio M, Singh PK, Mahato MK: Evaluation of surface water quality by using GIS and a heavy metal pollution index (HPI) model in a coal mining area, India. Bull Environ Contam Toxicol 95(3):304-310 (2015). DOI:10.1007/s00128-015-1558-9.
- Chopra RPS, and Krishan G: Analysis of aquifer characteristics and groundwater quality in southwest Punjab, India. Earth Science and Engineering 4(10):597-604 (2014).
- Younger P, Banwart SA, Hedin RS: Mine water–hydrology, pollution, remediation. Kluwer Acad Publ, Dordrecht, The Netherlands (2002).
- Gladney ES, Burns CE, Rodandts I: Compilation of elemental concentration in eleven United States Geological Survey rock standards. Geostand Newslet 8:3–226(1983).
- Edraki M, Golding SD, Baublys KA, Lawrence MG: Hydrochemistry, mineralogy, and sulphur isotope geochemistry of acid mine drainage at the Mt. Morgan mine environment, Queensland, Australia. Appl Geochem 20:789–805(2005).
- Gomshei MM, Allen DM: Potential application of oxygen-18 and deuterium in mining effluent and acid rock drainage studies. Environ Geol 39:767–773(2000).
- Report submitted to Bharat Coking Coal Limited by Forest Ecology & Environment Division, Forest Research Institute, Dehradun-Uttarakhand(2015)
- Choubey VD, Sankaranarayana I: Hydrogeology of Jharia coalfield, India. Jour Geol Soc India 36:36–45(1990).
- Sarkar BC, Mahanata BN, Saikia K, Paul PR, Singh G: Geoenvironmental quality assessment in Jharia coalfield, India, using multivariate statistics and geographic information system. Environ Geol 51:1177–1196(2007).
- Singh G: Status of water quality in a coal mining environment– a case study in the Jharia coalfield. Jharkhand (India) J Ind Poll Cont 6:67–76(1990).
- Younger PL, Wolkersdorfer C: Mining impacts on the fresh water environments: technical and managerial guidelines for catchment scale management. Mine Water Environ 23:S2–S80 (2004).
- Status of Groundwater Quality in India-part I, Groundwater Quality Series: GWQS/09/2006-2007, Central Pollution Control Board, Ministry of Environment and Forests, Govt. of India (2007)
- Sharma NL, Ram KSV: Introduction to the geology of coal & Indian coalfields. Orient Publishers, Jaipur (1966).
- Chandra D: Jharia coalfields: Bangalore, Geological Society of India, Mineral Resources of India, v. 5 (1992).
- Report on Environmental Impact Assessment & Environmental Management Plan to Bharat Coking Coal Limited' by Central Mine Planning & Design Institute Ltd.', a subsidiary of Coal India Limited(2013)
- APHA:S tandard methods for the examination of water and waste water, 20th edn. American Public Health Association, Washington (2005).
- BIS Indian Standards Institution—Indian standard specification for drinking water. IS: 10500 (1991).
- Appelo CAJ, Postma D: Geochemistry, groundwater and pollution. AA Balkema Publishers, Rotterdam (1993).
- Berner EK, Berner RA: The global water cycle: geochemistry and environment. Prentice-Hall, Englewood Cliffs, NJ, USA (1987).
- Kumar M, Ramanathan AL, Rao MS, Kumar B :Identification and evaluation of hydrogeochemical processes in the groundwater environment of Delhi, India. Environ Geol 50:1025–1039 (2006).
CrossRef - Gaofeng Z, Yonghong S, Chunlin H, Qi F, Zhiguang L: Hydrogeochemical processes in the groundwater environment of Heihe river basin, northwest China. Environ Geol 60:139–153(2010).
CrossRef - Singh AK, Mondal GC, Singh PK, Singh S, Singh TB, Tewary BK: Hydrochemistry of reservoirs of Damodar River basin, India: weathering processes and water quality assessment. Environ. Geol. 48, 1014–1028 (2005).
CrossRef - Sawyer CN, McCarty PL: Chemistry of Sanitary Engineers, 2nd edn. McGraw Hill, New York City, NY, USA (1967).
- Agrawal V, Jagetia M :Hydrogeochemical assessment of groundwater quality in Udaipur city, Rajasthan, India. Proc. National Conf on Dimension of Environmental Stress in India, Univ of Baroda, India, pp 151–154(1997).
- Durvey VS, Sharma LL, Saini VP, Sharma BK :Handbook on the methodology of water quality assessment. Rajasthan Agriculture Univ, Bikaner, India(1991).
- WHO :Guidelines for drinking-water quality. Vol 1, Recommendations. World Health Organisation, Geneva, Switzerland, pp 1–4(1997).


