Assessment of Variation in Water Quality Index (WQI) of Groundwater in North Goa, India
Gopal Krishan 1 * , C.P. Kumar 1 , B.K. Purandara 2 , Surjeet Singh 1 , N.C. Ghosh 1 , Suman Gurjar1 and A.G. Chachadi3
Corresponding author Email: drgopal.krishan@gmail.com
DOI: http://dx.doi.org/10.12944/CWE.11.1.05
A water quality index (WQI) is a tool which numerically summarizes the information from multiple water quality parameters into a single value and this information can be used to assess spatial and temporal variations in overall water quality. However, these indices are time and region specific and may be influenced by local factors. In the present study, water quality index has been worked out to assess the spatial and temporal variation of groundwater quality status for future planning and management of North Goa. Data of 19 groundwater samples were collected in the year 2005 during January, March and April, are used for the analysis. The Water Quality Index has been computed using four parameters viz. pH, Total Dissolved Solids, Total Hardness and Chloride. The WQI results show that the overall water quality class is ‘good’ and water is acceptable for domestic use.
Copy the following to cite this article:
Krishan G, Kumar C. P, Purandara B. K, Singh S, Ghosh N. C, Gurjar S, Chachadi A. G. Assessment of Variation in Water Quality Index (WQI) of Groundwater in North Goa, India. Curr World Environ 2016;11(1) DOI:http://dx.doi.org/10.12944/CWE.11.1.05
Copy the following to cite this URL:
Krishan G, Kumar C. P, Purandara B. K, Singh S, Ghosh N. C, Gurjar S, Chachadi A. G. Assessment of Variation in Water Quality Index (WQI) of Groundwater in North Goa, India. Curr World Environ 2016;11(1). Available from: http://www.cwejournal.org/?p=13679
Download article (pdf)
Citation Manager
Publish History
Select type of program for download
| Endnote EndNote format (Mac & Win) | |
| Reference Manager Ris format (Win only) | |
| Procite Ris format (Win only) | |
| Medlars Format | |
| RefWorks Format RefWorks format (Mac & Win) | |
| BibTex Format BibTex format (Mac & Win) |
Article Publishing History
| Received: | 2016-02-22 |
|---|---|
| Accepted: | 2016-03-16 |
Introduction
Rapidly growing population and poor water supply facilities have encouraged people to dig their own wells in many areas which have resulted in large scale withdrawals of groundwater in Goa. Generally, water samples are analysed for a number of water quality parameters to assess its suitability for drinking and irrigation purposes. A water quality index (WQI) numerically summarizes the information easily from multiple water quality parameters into a single value that can be used to assess spatial and temporal variations in overall water quality. The WQI has been developed for surface water by many researchers1-5 but the efforts are being made to work out these indices for groundwater also in various geographical parts of India like in Indo-Gangetic plains where these indices have been computed for Haridwar district of Uttarakhand, Muzaffarnagar and Shamli districts of Uttar Pradesh6-7.
Though water quality evaluations have been done by many researchers in various areas but Water Quality Index (WQI) has not developed for most of the areas. Keeping this in view, the present work has been carried with the overall objectives (i) to assess the suitability of groundwater for drinking purpose, as per guidelines reported by Singh et al.8, in North Goa, India computing Water Quality Index (WQI) tool, (ii) to categorize the groundwater quality samples for drinking purpose.
Study Area
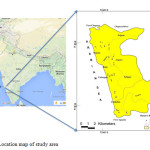
The study area lies in Bardez taluk of North Goa within the watersheds of BagaRiver and Nerul creek (around 74 km2) and covered by Survey of India toposheets number 48E/10, 48E/14 and 48E/15 on 1:50,000 scale. It is bound by rivers Chapora and Mandovi in north and south directions respectively, besides Arabian Sea in the west and encompasses coastal tract from Fort Aguada in the south to Fort Chapora in the north (15 km) and given in Figure 1. Around 30 km2 area close to the coast (15 km along the coast and 2 km wide) is more prone to seawater intrusion. The topography in the area consist of isolated hills of laterites ranging in height from 40 to 80 m above mean sea level surrounded by very gently sloping low elevation areas. The land elevation in the plain varies from 0 to 20 m above msl.
The general climate of the area is mainly tropical and is influenced to a large extent by the conditions in the Arabian Sea. The climate is characterized by high humidity and less extremes of temperature. The temperature varies between 20oC to 33oC and the average relative humidity is between 70 to 90%. The bulk of the rainfall is received during the south-west monsoon (June to October). The approximate numbers of rainy days are 110. The annual rainfall varies from 1700 mm to 3600 mm.
The rocks in the study area consist of crystalline and metamorphic rocks of the Precambrian age. The metagraywacke is a hard, compact, dark gray to green coloured rock. This rock is more prone to laterisation with the result that there are some outcrops in the area.
 |
|
Groundwater in the study area generally occurs under unconfined conditions in the sandy aquifers of the plains and under semi-confined conditions in the aquifers constituted of laterite and graywackes. The area occupied by phyllites and laterites may contain water in joints and weathered zones under semi-confined conditions. In the sandy formation, it is the primary porosity which controls the movement of groundwater whereas in laterites and phyllites, the secondary porosity including joints, fractures and shear zones play an important role in groundwater movement.
The water table is very shallow and mostly less than 10 m from ground. The main source of recharge to the aquifers is rainfall. Major part of the rainfall flows to the sea as direct surface runoff.
Methodology
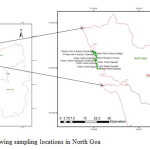
A part of the coastal area in Bardez taluk of North Goa was identified for the present study. Twenty observation wells were identified in the study area (Figure 2). Monthly groundwater level data were measured in observation wells during September 2004 to August 2005. Groundwater samples were collected from 19 observation wells in January, March and April, 2005. Groundwater samples were analysed using the standard methods9.
 |
|
For computing the Water Quality Index (WQI), the groundwater quality data of 19 sampling points (Figure 2) are used. For calculating the Water Quality Index (WQI), the methods followed by Singh et al.8 have been employed. In the present study, four parameters have been considered to compute the WQI. However, large numbers of parameters yields more reliable prediction of WQI but in the present work limited numbers of parameters were available viz. as pH, Total Dissolved Solids, Total Hardness and Chloride. The water quality index was calculated using quality rating scale and accordingly assigning the weight values to the selected parameters. The standards of the water quality parameter are governed as per BIS: 10500-2012 and Central Pollution Control Board (CPCB) standards and their respective weight used in the present study are highlighted in Table 1.
Methodology for overall Water Quality Index (OWQI) has been developed for surface water by Singh et al.8 which can be used for groundwater also10.
As reported by Singh et al.8, to gauge the influence of each individual parameter on a common single scale, the score generated by each parameter was averaged-out. The following weighted average aggregation function has been used for this purpose.

Where, wi = weight of the ith water quality parameter and Yi = sub-index value of the ith parameter (as reported by Singh et al.8). Sub-indices functions are basically the equations that transform the concentration ranges into the index score through mathematical equations. These scores are then converted to a common scale based on their relative importance to impact the quality of water. These sub-indices functions were developed based on the water quality standards and their concentrations in particular ranges. Mathematical expressions were fitted for each parameter to obtain the sub-index equations.
Based on the status of water quality data, the index value ranges from 0 to 100 and is classified into five categories: heavily polluted (0-24), poor (25-49), fair (50-74), good (75-94) and excellent (95-100). The status of water corresponding to different WQI values is presented in Table 2. If the index is low, then it indicates that some of the water quality parameters are beyond permissible ranges due to some particular reason and suitable measures are needed to improve the quality of water. Thus this index may be used as a guiding rule in management of quality of water resources. Various sub-indices functions and descriptive details are given by Singh et al.8 and have not reported here.
Table 1: Assignment of significance weight to the water quality parameter8
|
Sl. No. |
Parameter |
Weight Factor |
Standards (IS-10500) (1991) |
|
1 |
pH |
1 |
6.5-8.5 |
|
2 |
Total Dissolved Solids (mg/l) |
3 |
500-2000 |
|
3 |
Total Hardness (mg/l) |
1 |
300-600 |
|
4 |
Chloride (mg/l) |
1 |
250-1000 |
Table 2: WQI and corresponding class and status of water quality8
|
Class |
WQI Value |
Status of Water |
|
Heavily Polluted |
0 – 24 |
Unsuitable for All Purposes |
|
Poor |
25 – 49 |
Special Treatment needed |
|
Fair |
50 – 74 |
Needs Treatment (Filtration & Disinfection) |
|
Good |
75 – 94 |
Acceptable Quality |
|
Excellent |
95-100 |
Pristine Quality |
Results and Discussion
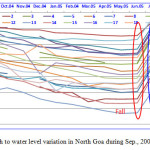
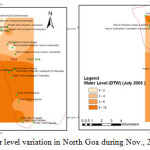
Depth to water level (DTW) observations in the study area from September, 2004 to August, 2005 showed that the maximum DTW was found during the period March, 2005 to May, 2005 while the minimum depth to water level was observed in the month of July, 2005 in all the wells (Figures 3, 4). As evident from Figure 4 that there was a rise in water level in July, 2005 as compared to November 2004, this may be due to monsoon rains.
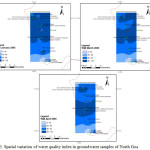
The statistical summary of measured parameters and WQI variation of 19 samples are given in Table-3 and Figure 5, respectively. The pH values ranged between 5.63 to 7.54 in January, 2005 while, in March and April, 2005 these were between 5.51-7.39 and 5.46-7.20, respectively, indicating samples were acidic to slightly alkaline. The TDS increased from 70-440 mg/l in January, 2005 to 80-500 mg/l and 90-1150 mg/l in March, 2005 and April, 2005, respectively. Compared to BIS standard limit of 600mg/l very high TDS in April, 2005 may be due to increase in chloride concentrations from 35.54 mg/l in January, 2005 to 67.91 mg/l in April, 2005. Average total hardness decreased from 62 mg/l in January, 2005 to 50.63 mg/l in April, 2005.
 |
|
 |
|
The maximum and minimum value of WQI has been found to be 100 and 69 which falls under ‘Excellent’ and ‘Fair’ category, respectively as per the Table 2. In the present study, in January, 2005 it is observed that 47% samples qualify in the ‘Excellent’ category and are of pristine quality, 53% samples fall in ‘Good’ category and are acceptable for domestic use. In March, 2005, 32% samples qualify in the ‘Excellent’ category and are of pristine quality, 68% samples fall in ‘Good’ category and are acceptable for domestic use. In April, 2005 it is observed that 37% samples qualify in the ‘Excellent’ category and are of pristine quality, 58% samples fall in ‘Good’ category and are acceptable for domestic use while 5% samples qualify in ‘Fair’ category which needs ‘Filtration and disinfection’ treatment. In overall, the groundwater quality is good (Figure5).
Similarly, in Haridwar district of Uttarakhand, India, WQI was computed using seven different quality parameters to assess the suitability of groundwater for drinking purposes and 95% groundwater samples qualified in the category of ‘good to excellent’6.
Krishan et al.7 computed WQI in groundwater of Muzaffarnagar and Shamli districts using WQI using data of 104 groundwater samples for five parameters viz. pH, Total Dissolved Solids, Total Hardness, Chloride and Sulphate. The WQI indicated that the overall water quality class is ‘good’ and water is acceptable for domestic use.
Tiwari et al.11 reported in a study conducted for developing WQI for groundwater resources in West Bokaro coalfield, India that despite the coal mining and industry, an analysis of the chemistry of 33 dug wells samples indicated that 79% of groundwater samples found under excellent to good category and suitable for drinking purposes.
For the present study in North Goa, samples were collected in pre-monsoon season of 2005, so continuous monitoring of groundwater well is required in the study area to assess the recent groundwater status for drinking purpose using water quality index. For this, a groundwater monitoring network should be designed and planned scientifically in the study area12. The water level should be analysed quantitatively for proper planning13-19.
Table 3: Statistical summary of physico-chemical parameters of groundwater samples (n =19)
|
Parameters |
pH |
mg/l |
Water Quality Index |
||
|
TDS |
Cl-
|
Total Hardness |
|||
|
January, 2005 |
|||||
|
Minimum |
5.63 |
70.00 |
15.95 |
40.00 |
81.30 |
|
Maximum |
7.54 |
440.00 |
65.58 |
94.00 |
100.00 |
|
Average |
6.47 |
220.53 |
35.54 |
62.00 |
92.44 |
|
Std. Deviation |
0.45 |
112.67 |
16.57 |
17.93 |
7.66 |
|
March, 2005 |
|||||
|
Minimum |
5.51 |
80.00 |
17.72 |
32.00 |
81.30 |
|
Maximum |
7.39 |
500.00 |
76.21 |
108.00 |
100.00 |
|
Average |
6.36 |
243.68 |
42.91 |
59.89 |
89.82 |
|
Std. Deviation |
0.47 |
122.39 |
20.40 |
20.81 |
7.56 |
|
April, 2005 |
|||||
|
Minimum |
5.46 |
90.00 |
19.49 |
14.00 |
69.60 |
|
Maximum |
7.20 |
1150.00 |
373.99 |
106.00 |
100.00 |
|
Average |
6.29 |
307.37 |
67.91 |
50.63 |
89.53 |
|
Std. Deviation |
0.46 |
242.44 |
79.86 |
26.12 |
9.45 |
 |
|
Conclusions
The WQI has been computed based on four different quality parameters to assess the suitability of groundwater for drinking purposes in Goa. The results show that in overall the groundwater quality is good.
Though the present WQI is based on four parameters, as per the available data,20 there is a need to include more water quality parameters for the assessment. The continuous monitoring of groundwater is required in Goa to get the recent groundwater quality status for better human health and economic development and also to check any possible contamination in future due to sea water intrusion. A re-assessment of the WQI based on the recent data will be useful for the proper management of the groundwater resources.
Acknowledgment
Authors thank Director, National Institute of Hydrology for all the support and encouragement.
References
- Kim, A.G. &Cardone, C.R. Scatterscore: a reconnaissance method to evaluate changes in water quality. Environmental Monitoring and Assessment, 111, 277-295 (2005).
CrossRef - Liou, S.M., Lo, S.L. & Wang, S.H. A generalised water quality index for Taiwan. Environmental Monitoring and Assessment, 96, 35-32 (2004).
CrossRef - Sargaonkar, A. & Deshpande V. Development of an overall index of pollution for surface water based on a general classification scheme in Indian context. Environmental Monitoring and Assessment, 89, 43-67 (2003).
CrossRef - Tsegaye, T., Sheppard, D., Islam, K.R., Johnson, A., Tadesse, W., Atalay, A., &Marzen, L. Development of chemical index as a measure of in-stream water quality in response to landuse and land cover changes. Water, Air, and Soil Pollution, 174, 161-179 (2006).
CrossRef - Tiwari, A. K. & Singh, A. K. Hydrogeochemical investigation and groundwater quality assessment of Pratapgarh district, Uttar Pradesh. Journal of the Geological Society of India, 83(3), 329-343 (2014).
CrossRef - Krishan, G., Khanna, A., Singh, S., Singh, R.P.& Ghosh, N.C. Water quality index of groundwater in Haridwar district, Uttarakhand. Water and Energy International, 58, 55-58 (2016).
- Krishan, G, Singh, S, Kumar, C.P, Garg, P.K., Gurjar, S., Ghosh, N.C.& Chaudhary, A. Assessment of groundwater quality for drinking purpose using water quality index in Muzaffarnagar and Shamli districts, Uttar Pradesh, India. Hydrology: Current Research, in press (2016).
- Singh, S., Ghosh, N.C., Krishan G., Galkate R., Thomas T. & Jaiswal R.K. Development of an Overall Water Quality Index (OWQI) for Surface Water in Indian Context. Current World Environment, 10(3), 813-822 (2015).
CrossRef - APHA. Standard Methods for the Examination of Water and Wastewater. 22nd Edition. Published by the American Public Health Association, American Water and Waterworks Association and Water Environment Federation (2012).
- Stigter, T. Y., Ribeiro, L. & Dill, A. M. M. C. Application of groundwater quality index as an assessment and communication tool in agroenvironmental policies - Two Portuguese case studies. Journal of Hydrology. 327(3-4): 578-591 (2006).
CrossRef - Tiwari, A. K., Singh, P. K. &Mahato, M. K. GIS-Based evaluation of water quality index of groundwater resources in West Bokaro coalfield, India. Current World Environment, 9(3), 843-850 (2014).
CrossRef - Singh, S., Krishan, G., Ghosh, N.C., Jaiswal, R.K., Thomas, T. and Nayak, T.R. Designing and Planning of Groundwater Monitoring Network. In: Proceedings of National symposium on Hydrology jointly organized by IAH, NIH, Roorkee and CWC, New Delhi during 22-23 December, 2015 at New Delhi p. 25 (2015).
- Krishan Gopal, Lohani A.K., Rao, M.S., Kumar, C.P. &Semwal, P. Optimization of groundwater monitoring network in Bist-Doab, Punjab. In: International Conference “India Water Week 2013-Efficient Water Management: Challenges and opportunities" (IWW-2013)”, pp. 274 (2013).
- Krishan, Gopal, Lohani, A.K., Rao, M.S. & Kumar, C.P. Prioritization of groundwater monitoring sites using cross-correlation analysis. NDC-WWC Journal. 3 (1), 28-31 (2014).
- Krishan, Gopal, Rao, M.S., Loyal, R.S., Lohani, A.K., Tuli, N.K., Takshi, K.S., Kumar, C.P., Semwal, P & Kumar Sandeep. Groundwater level analyses of Punjab, India: A quantitative approach. Octa Journal of Environmental Research, 2(3), 221-226 (2014).
- Krishan, G., Rao, M. S., Purushothaman, P., Rawat, Y. S., Kumar, C.P., Gupta, S., Bhatia, A.K., Marwah, S., Kaushik, Y.B., Angurala, M.P. & Singh, G.P. Groundwater Resources in Bist-Doab Region, Punjab, India-an overview. NDC-WWC Journal, 3 (2): 5-13 (2014).
- Krishan Gopal, Lapworth D. J., Rao M. S., Kumar C. P., Smilovic M. &Semwal P. Natural (Baseline) Groundwater Quality in the Bist-Doab Catchment, Punjab, India: A Pilot Study Comparing Shallow and Deep Aquifers. International Journal of Earth Sciences and Engineering, 7 (01): 16-26 (2014).
- Lapworth D.J., Krishan, G, Rao, M.S. & MacDonald, Alan. Intensive Groundwater Exploitation in the Punjab – an Evaluation of Resource and Quality Trends. Technical Report. NERC Open Research Archive, BGS-UK. http://nora.nerc.ac.uk/509752/ (2014).
- Lapworth D.J., MacDonald A.M., Krishan G., Rao M.S., Gooddy D.C. & Darling W.G. Groundwater recharge and age-depth profiles of intensively exploited groundwater resources in northwest India. Geophys. Res. Lett., 42, doi:10.1002/2015GL065798 (2015).
CrossRef


