A New Model for Productivity Evaluation in Construction by New Insight Into the Baseline Productivity (Case Study)
Abdulrahman Gavili1 * and Mohammad Mehdi Mortaheb1
1
Civil Engineering Dept,
Sharif University of Technology,
Iran
http://dx.doi.org/10.12944/CWE.10.Special-Issue1.67
The construction industry contributes a major share of gross domestic product (GDP) and has a vital role in the economic growth of countries. Thus any performance improvement in this industry enhances the economic growth especially in developing countries.
Due to the lack of reliable performance measurement models agreeable to industry and academy, this research seeks to take steps to introduce a novel functional and flexible method for measurement, analysis and comparison of labor productivity. Furthermore; an addition to the site organizational chart, called “Construction Productivity Management Office, CPMO”, is introduced for implementation of this method. In a case study it was shown that this addition can improve productivity indicating its practicality and capabilities. The novel method also introduces a new index called the “net baseline productivity”. This approach is based on filtering and excluding the total idle times that provides a managerial index called “Earned Performance Ratio (EPR)”. This new method can provide an objective-based approach for measuring the productivity as well as introducing a new insight into the baseline productivity. The introduction of CPMO with dynamic duty description of measurement, analysis, and comparison of productivity and its relevant indexes is one of the other achievements of this research. Effective implementation of productivity concepts can play a key role in achieving the ultimate goals of projects and organizations.
Baseline productivity; Construction; Measurement framework; CPMO
Copy the following to cite this article:
Gavili A and Mortaheb M. M. A New Model for Productivity Evaluation in Construction by New Insight Into the Baseline Productivity (Case Study). Special Issue of Curr World Environ 2015;10(Special Issue May 2015). DOI:http://dx.doi.org/10.12944/CWE.10.Special-Issue1.67
Copy the following to cite this URL:
Gavili A and Mortaheb M. M. A New Model for Productivity Evaluation in Construction by New Insight Into the Baseline Productivity (Case Study). Special Issue of Curr World Environ 2015;10(Special Issue May 2015). Available from: http://cwejournal.org?p=648/
Download article (pdf)
Citation Manager
Publish History
Introduction
According to the researchers' viewpoints in recent decades, the industrialized countries have achieved approximately 50 percent of their production development through improving productivity which is one of the main sources of economic growth in these countries. Productivity deficiency leads to higher inflation and lower economic growth rate. This point shows the necessity for more attention to productivity improvement in industries to achieve economic goals. The current global economic status and the need for creating economic prosperity in industries and the existence of fierce competition in economy have made the productivity more important.
The construction projects make a major part of economy in countries (Proverbs et al, 1998). In developing countries, construction has approximately 10% of contribution in Gross Domestic Production (GDP) (Navon, 2005). In comparison with developed countries, the contribution of this industry in economy and GDP of developing countries have been significantly increased. In Iran as a developing country, the financial politics issued by the government in recent years reflect the increased contribution of construction industry from 17.5 percent of total approved annual budget in 2003 to more than 24 percent in 2006 and 28.8 percent in 2008 (Ghoddousi et al., 2012).
The control and improvement are impossible without measurement; the accurate measurement is one of the main loops of improvement process chain. This paper focuses on presenting a new model for measuring the performance in projects and proposing the appropriate organizational framework for its operation. In this regard, the implementation of mentioned items on the studied case could lead to its practical improvement as well as indication and demonstration of its capabilities.
Due to the fierce competition of companies in current construction market, they tend to all possible solutions to reduce costs and enhance productivity in different sectors of activity. On the other hand, the other beneficiaries of project such as the clients are seeking to achieve the desired quality at optimum cost and time. Concerning these cases, all parties involved in construction project obviously seek to improve productivity, and thus productivity is a crucial issue in projects and is recently raised in all construction fields. The appropriate measurement and comparison of productivity indexes is the first and perhaps the most important step in the process of enhancing productivity. This will not be completely achievable without specified and certain organizational framework as well as the applied and certain framework.
The lack of applicable and flexible method for the measurement, analysis, and comparison of productivity in projects as well as organizational framework and for its implementation is the main issue in this research, which seeks to solve it through providing the mentioned threads and its experimental implementation in a case study.
In this paper, the main section of research starts after defining the problem and an overview of previous studies in this area and understanding and identifying the gaps (in studies and the real world). To solve the problem, the first phase discusses a model for measuring and analyzing labor performance in construction projects. This section provides the definitions of appropriate indexes (such as net base productivity), practical methods and ways to achieve them and the executive framework in company and project organizational structure to implement this framework. The second phase seeks to indicate its capabilities by its implementation in the case study, which is the huge concrete structure building project. However, the proposed method is improved by feedback of implementation in the sample and return to the phases of theory and definitions in order to obtain the desired quality. Finally, the conclusion section emphasizes on the major achievements of research in theoretical and applied fields.
Literature Review
In principal, productivity refers to obtaining the maximum possible benefit from all available resources including the ability, talent and skills of human resources, land, money, equipment, time, location, and so forth to produce goods and services. It is found that the resources of production or factors, which constitute productive activities (i.e. natural resources, energy, capital, labor and so forth) are low in each country on the one hand, and the human needs are growing, numerous and indefinite, on the other hand. Consequently, demand or consumption is constantly increasing and sometimes may become higher than supply or production and the gap between these two enhances. Therefore, the best and economic methods propose to utilize the limited resources and facilities for responding to human unlimited needs, thus, the productivity process or optimum use of production agents is raised here.
Productivity can be simply defined as the relationship between the input and output of system. Two forms of this ratio can be provided:
1-Productivity = input/output; 2- Productivity= output/input
In construction industry, productivity is measured at various levels of details for different purposes including the comparison of growth in companies engaged in construction industry or other sectors of economy. Looking at time and financial records of projects, this issue can be investigated for productivity in three main components of construction industry (3M) including manpower, machinery and material, this research comprehensively studies the human resources.
Human resources productivity is a concept, which has the capacity for conducting different analyses. Yi and Chan defined three following analytical levels for human resources productivity in the review and classification of conducted studies in this regard: Industry level, project (or organization) level, and activity levels (Wen & Chan, 2013). Studies on the project or company levels can be conducted aiming at comparing and complying with the standards and strategies of company.
With regard to the discussed definitions in the previous section, it is necessary to take measures in calculating productivity, so that there is a need for determining the quantitative and practical criteria for comparison and conclusion after qualitative definition. Despite the fact that there are numerous articles and publications on construction productivity, there is no consensus on desired activities and productivity measurement system. Researchers have acknowledged that it is difficult to define a standard method for measuring productivity due to the complexity and unique characteristics of construction projects (Oglesby et al., 1989). The uniqueness and non-repetitive operations of construction projects make it difficult to develop a standard productivity definition and measurement framework (Sweis, 2000). Several methods are defined for measuring productivity, but implementation framework, way of comparison and managerial application are more important than the definition of the method and the lack of certain framework agreed by industrial and academic community is the current absence in this regard. Most of the previous studies focused on defining factors, which affect productivity and on limited measuring, the impact of these factors on productivity at micro level (Park et al., 2005).
The quantity of baseline productivity is the main disagreement of researchers and companies and this is a basic concept in measuring and comparing performance. This concept has been widely used in construction industry as a technique for identifying the ways to improve organizational and project performance (Liao et al., 2011). In general, the baseline productivity has two applications; first, considering the values of this index as the objective of organization to pursue best practices, second the use of its values as a normal standard for the early detection of abnormal activities, processes and productions, which their conditions are deviated from standard status (Zhao et al, 2013).
Some researchers have defined baseline productivity as the best performance achievable by contractor in a specific project (Thomas et al., 1999; Thomas et al., 1999; Thomas et al., 2000), although others have considered it as a standard reflecting contractor’s normal operating performance (Gulezian et al., 2003).
Thomas has defined the concept of baseline productivity when it is impossible to find an unimpacted section of project (in which external factors are not effective). Despite the fact that this base concept includes losses, it is an index with conservative approach to improve the claims of project parties (Thomas et al., 1999; Thomas, 2007). Other methods such as the control chart, K-means clustering and DEA are introduced to determine the baseline productivity (Gulezian et al., 2003; Ibbs et al., 2005; Lin et al., 2010).
When measurement basis is not obvious and convincing and the cause and effect analysis are difficult, the objective and practical methods are highly appreciated by industry for determining the basis of performance (Zhao et al., 2013). Despite the fact that the ranges of performance with different arguments are determined as the baseline productivity in each method above, they have certain advantages and deficiencies. Alizadeh and Ghoddousi have clearly indicated these advantages and deficiencies in their study on accurate review and their application comparison through implementation on pilot projects (Alizadeh et al., 2011). All these methods have similarities in the roots and measurement type of this base index, which has the overall viewpoint and is, in fact, a part of current practices. None of these approaches ensure the amount of performance without loss, because the base measurement is not conducted accurately. Net baseline productivity is a new concept and point of view, which is replaced by baseline productivity in this study and based on its name the net project-based performance, was measured and determined as the base index.
Benchmarks such as Disruption Index (DI), Performance Ratio (PR) and Project Management Index (PMI) are defined for the evaluation of productivity in project and they measure the quality of performance in project according to the baseline productivity (Abdel-Razek et al., 2007). In addition, other indexes such as the workforce loading charts and related S-curves can be useful tools for notifying the contractor and client regarding the deviation of project performance from planed benchmarks (Hanna et al., 2002).
A Novel Method for Performance Measurement and a Practical Organizational chart Framework
In this phase of study, a dynamic framework is developed for measuring human resources performance in projects as well as its executive strategy and framework in the project organizational chart.
As discussed in the previous section, uniqueness is the obvious and troublesome feature of construction projects and this makes it difficult to determine the best practices or optimal performance standards for them. Thus, each project requires the unique index values as the dynamic index concept, which is defined separately for each project and can be different during the project completion cycle and according to the time conditions, technical specifications, method statement, and so forth. The logical solution to this problem is to determine the varied standards for different parts of each project at different times.
The proposed framework, which ranges from productivity at the activity levels to productivity at project level, is appropriate for projects with high volumes and work fields, including most of infrastructure projects. Perhaps, the overall viewpoint of this model, but not its organizational framework, is applicable in smaller projects. This model is based on anobjective-based approach for measuring the productivity. Achieving the net baseline productivity index requires a special process by spending the time, energy and expertise and is based on the sampling of tasks, processes, and analysis of obtained data. Similarly, two performance measurement methods (two kinds of performance) are defined for human resources productivity, which is the main focus of this study: Macro-level productivity (Y) and Micro-level productivity (Z).
Macro-Level Productivity (Y)
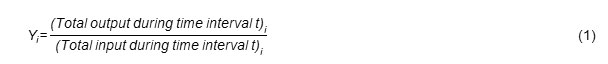
It is the result of human resources performance at a specific time interval by considering the total output and input resources. In measuring this index, the available time is the criterion for measuring the input and it is the sum of standard working time minus the inevitable delay time such as the natural disasters and weather conditions. It should be noted that the rests and allowed stops such as the entry, exist, breakfast, lunch, dinner, and so forth are removed from standard working time; for instance, for working shift of 8:00 to 17:00, the standard working time is 7 hours per shift by considering 1 hour of lunch, 1 hour of the whole entry, exit and rest. According to the Eq. (1), the Macro-level productivity of human resources in different activities is obtained by accurate classification of activities and types of applied sources.
The desired data for calculating this type of performance is obtained through the review of documents and site reports including the project control reports, statements, human resources data, and so forth and it should be extracted and classified according to the accuracy and required separation in order to achieve the Macro-level productivity with desired separation.
Micro-Level Productivity (Z)
This type of productivity is resulted from the careful study of activities and processes with the main purpose to determine the net baseline productivity specific to each sector. Due to the lack of detailed review for all activities in project, sampling is an appropriate tool to achieve the desired information. Work sampling, which focuses on the human resources' way of applying the time, is the most common method of measuring productivity based on work study (Wen et al., 2013). Sampling of activities in different fields is randomly conducted by establishing sampling principles. The study on the selected samples is achieved by direct observation and then the statistical analysis of resulted data. The significant point in defining this index is the consideration of productive time as the criterion for measuring the input. In other words, in recording the input sources, the assigned networking time is the measurement criterion. The Micro-level productivity of human resources in various sectors of activity is obtained according to Eq. (2).

After determining the exact location of sample, the status of sample should be recorded continuously with a pre-determined accuracy, and different situations should be classified depending on the level of desirable performance. In these observations, the stoppages, delays as well as causes and accelerators are recorded in addition to the time and amount of applied resources in order to solve and modify weaknesses. The smart perception of work sample status is the important point and, in fact, the advantage of this measurement method under which the manpower loss is also recorded so that the unemployed or relatively-unemployed people are not included in input sources. After finishing the activity or observed sample process, the precise range and accurate values of output corresponding to the input sources (or the amount of output for which the input sources are spent) should be measured and recorded and this output is measured through measurement tools and shop drawings or as built drawings.
To achieve the reliable values for exact performance of human resources, it is essential to select and investigate the proper number of samples (size of sample) according to the different criteria of samples. After calculating these values as the labor productivity in different parts and activities, the net working rates are determined in terms of micro-level productivity. Net baseline productivity can be measured according to the study and averaging these values. This index is able to be assigned to a desired level of activities from the overall type of activity to working on a specific task of an activity according to the size of selected samples.
Net baseline productivity is a standard and relatively non-troublemaker by eliminating stoppages, delays, labor loss, and so forth and thus, we obtain the key indexes in the field of real performance as well as the achieved real capacity of human resources (or other resources) through comparing this base with corresponding values of Macro-level productivity and this can be the proper basis for executives' decisions and even can affect the main policies of organization or project management.
The Earned Performance Ratio (EPR) of human resources is among the logical productivity indexes obtained from comparing the macro-level and net baseline productivity. The ideal status of this coefficient equal to 1 is achieved when two levels of target productivity converge to one another. According to Eq.(3), the Earned Performance Ratio (EPR) of operating forces for activity is calculated from the ratio of macro to net baseline productivity.

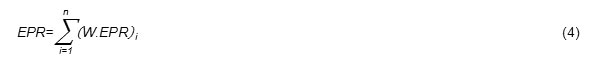
The measures of labor productivity within the organization or project provide the internal and external indexes for comparing existing criteria and can be effective in macro programs and plans of organization or project (Park et al., 2005; Ellis et al., 2006).This coefficient is a principal index for executive skill and planning, managerial, as well as supporting abilities of human resources, because the major reason for different values of macro and micro levels of productivity roots in the stoppages, delays and discontinuity of activities, It is named based on this issue, because when all unauthorized losses become zero during the operation at a specified interval, we can achieve net baseline productivity. This coefficient makes it possible to compare the performance of projects, work teams and even different activities from a new perspective. Through weighting different activities of project, the weighted EPR can be calculated according to Eq.(4) in the project and thus, we can comment on the performance of larger project parts and even the whole project.
The determination of workforce productive time is one of the practical and tangible derivatives of this coefficient according to the Eq. (5)and it is obtained from multiplication of this coefficient by the total official work time (available time).
(Productive Time)i = EPRi X(Total Work Time)i (5)
Organizational Framework, CPMO in Organization Chart and Project Structure
Regarding the concept of productivity, which includes the indexes with continual improvement feature according to the PDCA cycle of (Deming Cycle), and the impact of its improvement on the project profitability for all major involved parties, it is essential to create a framework in the organization for ensuring this continuous improvement.
The department of construction productivity management (CPMO) can play the key role in achieving the organizational objectives through dynamic task description of productivity measurement, analysis, and comparison of its performance-related indexes. This unit can guarantee the growth of productivity by providing the required strategies and solutions for promoting the performance-based variables in different fields. The department of productivity management in construction companies can be established with this technical and economic justification and making the hardware and software forecasts and required resources. This unit can be effective in the field of achieving the management goals alongside the other organizational units such as the technical bureau, cost estimation, tenders and contracts, executive units, and as a part of project management structure.
Playing the direct role in determining the functional standards of each project, the CPMO is able to manage and control the performance indexes with the same meaning throughout the project life cycle. The management dashboard is a useful tool to help managers make decision by quick display and summary of performance status in different units and this tool is one of the outputs of this department. By recording the data of previous projects, this department has a significant performance in predicting the status of future projects. For instance, the records of firm performance will be the appropriate and reliable tool for tender office in making the necessary estimates for future projects. The realistic and accurate productivity indexes, which are the basic prerequisites for proper planning of resources (time, money, equipment, manpower and materials), are among the major achievements of this unit to assist and advise the Project Management Office for resource management and scheduling.
The performance of this department depends on the information, which should be available for it; this information is classified into two categories: First, the information, which is produced by organizational units and its nature need no measurement and recollection; second, the information, which is not produced and managed so far, thus, needs determining the measurement and collection models. The first category of information is obtained through organizational communications with other units and making forms for them if necessary, and the second category, which allocates most of the activities at this department, is gathered by experts as the productivity experts. The experts at this department obtain the target data through the pre-determined models under the specified task description and analyze the productivity status in different sectors of organization or projects. Details and samples of this office application are more tangible by its implementation on the studied case.
Implementation of Framework on the Studied Sample
A large scale project is selected as the case study to complete the proposed model of performance measurement as well as proving its efficiency in the form of executive framework (CPMO); this establishment is conducted and the proposed framework is experimentally launched after negotiations and technical and economic feasibility and managing director's support in a construction company.
The studied project was the construction of a huge commercial complex that covers a total area of 700,000 square meters, in a land of over 30 hectares. This project is delivered in DBB (design bid build) system and the type of contract with the price list of regular unit price values according to the specific conditions of contract. The contract covers construction of the foundation and concrete superstructure with a volume of over 500,000 cubic meters of reinforced concrete. According to the main characteristic of this project, it is a proper studied sample. The project scope and site area is divided into five main workshops; separated in terms of management, labor and equipment. The study scope of this research is focused on the construction of foundation according to the time aspect, and it includes the construction of concrete superstructure. The overall view of project and plan of workshop divisions are shown in Figures 1 and 2,and Table 1 illustrates the volumes of project works separated based on site and structural members.
The process of implementing the proposed measurement framework and analyzing the labor performance is started by establishing the department of CPMO in the structure of organization and sample project after an introduction to the dimensions of project and establishing communication with authorities and different departments.
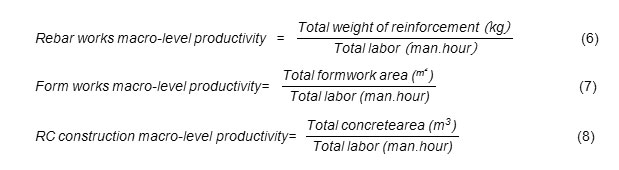
The Macro-level labor productivity in the project is measured by receiving the daily statistics of human resources in different sectors as well as the statistics of activities conducted in those sectors and through considering the man-hour of labor as the total input, and also the amount of performed activities specific to each sector as the total output. This level of performance is obtained according to Eqs. (6), (7), and (8) for rebar works, formworks, and reinforced concrete (RC)construction by considering the rebar weight, formwork area, and concrete volume of output. The important point in this index is its generality irrespective of losses, stoppages, re-works and so on.
Determining the micro-level labor productivity in different sectors needs spending energy, time and expertise of CPMO in order to implement the measurement process. As described in the previous section, the sampling is conducted in this regard. The most important challenge in this measurement method is to generalize the results in a way that they are good representatives of the entire studied population.
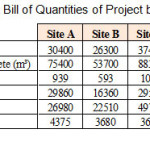 |
Table1: Total Bill of Quantities of Project by Site & Item Click here to View table |
The process of investigating the operation of reinforced concrete structure sections is started by the allocation and distribution of productivity experts in each of five studied workshops and in shift-works of project. The structural classification is conducted for the implementation of concrete skeleton in this project in order to integrate the relevant records of data, separate various parts of activities and control them more precisely. According to Table 2, this has been possible by defining two levels of status for each sample and the required descriptions.
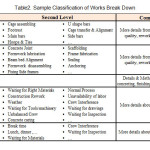 |
Table2: Sample Classification of Works Break Down Click here to View table |
The data collected from productivity experts in workshops are completed in forms designed for this case. The need for easy and fundamental record and storage and also the rapid analysis make it essential to build a database with these features. The application of spreadsheet database and pre-written software functions has made it possible to record the data quickly and precisely as well as their conclusion and analysis. A sample of data entry page and initial conclusions are shown in Table 3.
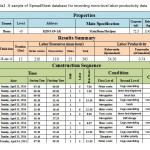 |
Table3: A sample of SpreadSheet database for recording micro-level labor productivity data Click here to View table |
As emphasized in the previous section, an important part of process to determine the micro-level labor productivity of activity is output precise measurement and this includes the measurement of reinforcement weight, formwork area and concrete volume in the studied project. After the completion of operation and thus, recording the sample status, the productivity expert marks the exact region of output corresponding to the recorded input on the map and thus, measures and reports the target volumes based on the shop drawings maps and its estimates.
By recording the output of each sample, its productivity measurement process will be completed because other calculations, including the separation summing and calculation of three types of productivity, are automatically implemented and displayed in the database. Finally, each sample is filed
with a full document of interpretations. After collecting the required number of work samples and their corresponding precise values of productivity, the cases with high deviations are excluded and the remaining data are utilized for determining the net baseline productivity.
The other important information is obtained from this process in addition to the precise measurement of productivity; the reasons for the interruption and disruption of activities is are one of the most important one, because any delay and stoppage during the implementation of samples is recorded at the second level with the mentioned reason. The identification of the main reasons for stoppages and lower efficiency can help to plan for solving and modifying them.
After exploring the net baseline productivity up to the target level, their corresponding values of Macro-level productivity are compared and the Earned Performance Ratio (EPR) is determined for each workshop and this is the useful tool for making managerial decision and policies.
Tables 4 and 6 represent the labor macro-level productivity in each of five workshops of project in rebar fixing, form working and reinforced concrete construction over a period of 3 months.
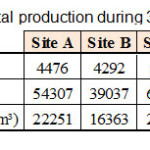 |
Table4: Total production during 3 months Click here to View table |
Totally, 241 samples of constructed structural members are studied and investigated precisely during 3 months. The Micro-level productivity of human resources is calculated according to the members and workshop. The values of workshop A as the sample are shown in Figures 3,4, and 5.
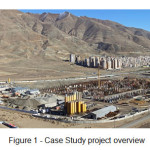 |
Figure1: Case Study project overview Click here to View figure |
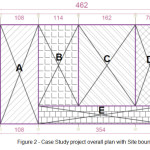 |
Figure2: Case Study project overall plan with Site boundaries Click here to View figure |
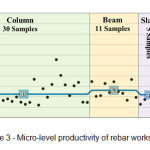 |
Figure3: Micro-level productivity of rebar works– Site A Click here to View figure |
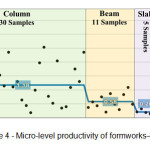 |
Figure4: Micro-level productivity of formworks– Site A Click here to View figure |
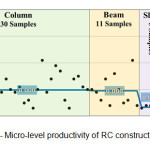 |
Figure5: Micro-level productivity of RC construction– Site A Click here to View figure |
Due to the large volume of information, the conclusion of Micro-level productivity results for other workshops are summarized in Tables 7, 8, and 9.
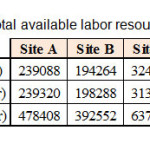 |
Table5: Total available labor resources during 3 months Click here to View table |
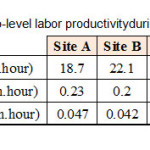 |
Table6: Macro-level labor productivity during 3 months Click here to View table |
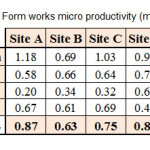 |
Table7: Form works micro productivity (m²/m.h) Click here to View table |
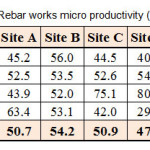 |
Table8: Rebar works micro productivity (kg/m.h) Click here to View table |
As described in the previous section, the main aim of Micro-level productivity definition and calculation is to extract the values of net baseline productivity values on this basis. After consultation with experienced experts and managers, it is decided to select the mean of data as net baseline productivity after removing cases with high deviation. This index indicates the performance of groups at the net work intervals regardless of stoppages and delays at larger time intervals and it is largely dependent on the skill of working groups, foremen and nature of work. These features are compared by the comparison of different workshops.
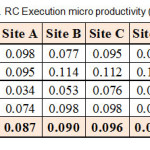 |
Table9: RC Execution micro productivity (m³/m.h) Click here to View table |
Finally, to measure the EPR coefficient, which is obtained from dividing the Macro-level productivity by the net base productivity, in studied workshops, this data is shown in Table 10. It is worth noting that the mean of this coefficient is selected as the final in reinforcement, formwork and reinforced concrete construction.
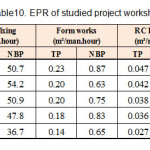 |
Table10: EPR of studied project workshops Click here to View table |
According to the table above, workshop B with the Earned Performance Ratio (EPR) of 0.398 has the highest value among other workshops; in other words, it has the highest achieved net baseline productivity determined for that site in the field of rebar works, formworks and concrete construction, and this is due to better management and implementation planning as well as greater efforts to reduce the stoppages and delays.
The implementation of proposed framework (CPMO) to measure labor productivity on the studied sample will bring the achievements for project including the competition among the management of workshops in gaining the higher levels of macro-level productivity (higher EPR coefficients) and among the work groups for acquiring the higher levels of micro-level productivity (at short intervals to show the individual and group skill and ability). Putting the pressures on the workshop supervisor to gain the higher efficiency is another main achievement of creating this framework, which is resulted from the association with project management and especially the managing director in company. These pressures are enhanced particularly by comparing the values of net baseline productivity, which indicate the potential capacity for human resources, and thus, the project seeks to reduce the stoppages and delays, deals with the factors, which reduce the efficiency as well as higher control of authorities in relevant units; all these attempts lead to the improvement of performance indexes in project and gaining the greater profit.
It should be noted that the CPMO is experimentally considered in the organizational structure of company by starting this research and has released other reports on the status of project machinery, plant of producing the precast pre-stressed slabs (based in the site), rebar cut and bend workshop (based in the site), and the productivity of tools and materials, and has provided the solutions for promoting the productivity. This effective performance of proposed office is more useful and welcomed by senior managers in company due to the technical and economic feasibility, and thus, it has been developed in different dimensions.
Conclusions
The uniqueness of construction projects and the inherent complexity of this industry make it essential to determine the dynamic performance indexes applicable to each project. Most of the methods for measuring productivity and determining standard basis are holistic. Such techniques do not consider net sources in determining the policy and benchmarks, and consequently are selecting a part of project performance as the basis. This research seeks to take an applied step in this regard by providing a new framework and methodology for evaluating, comparing and analyzing labor productivity in projects. The objective-based approach and definition of productivity measurement methods, introduction of net baseline productivity index and its comparison with macro-level productivity of project, as well as determination of Earned Performance Ratio (EPR) are the theoretical and scientific fields achievements of this research. Its main advantage is the exclusion of resource losses in determining base value compared to other available methods. Practically, the main achievement of this research might be considered the organizational chart addition of CPMO for implementing the above mentioned framework (and any other process with the aim of promoting productivity in organization or project). Furthermore, the real features and benefits are proven by full implementation of the novel framework in the form of proposed methodology in the studied case.
The new approach to baseline productivity is one of the other outcomes of this research; this approach is described in details by focusing on the human resources. This approach is applicable to the machinery, tools and materials, and its potential and scientific applications can be indicated by their experimental implementation on case studies.
The various values of net baseline productivity in different parts of a project and comparing them with reference values provided by formal organizations can be suggested as the other subjects for future studies.
The methodology proposed in this paper and CPMO was implemented in a construction contracting company. The investigation of performance and impact of this methodology in regard to the corresponding parties involved in the projects such as the client or supervising body are the issues that can be considered in future studies.
References
- Abdel-Razek, R. H., Abd Elshakour M, H., & Abdel-Hamid, M., Labor productivity: benchmarking and variability in Egyptian projects. International Journal of Project Management, 25(2), 189-197 (2007).
- Ellis Jr, R. D., & Lee, S. H., Measuring project level productivity on transportation projects. Journal of construction engineering and management,132(3), 314-320 (2006).
- Ghoddousi, P., & Hosseini, M. R., A survey of the factors affecting the productivity of construction projects in Iran. Technological and Economic Development of Economy, 18(1), 99-116 (2012).
- Gulezian, R., & Samelian, F., Baseline determination in construction labor productivity-loss claims. Journal of Management in Engineering, 19(4), 160-165 (2003).
- Hanna, A. S., Lotfallah, W. B., & Lee, M. J., Statistical-fuzzy approach to quantify cumulative impact of change orders. Journal of computing in civil engineering, 16(4), 252-258 (2002).
- Ibbs, W., & Liu, M., Improved measured mile analysis technique. Journal of construction engineering and management, 131(12), 1249-1256 (2005).
- Liao, P. C., O’Brien, W. J., Thomas, S. R., Dai, J., & Mulva, S. P., Factors affecting engineering productivity. Journal of Management in Engineering, 27(4), 229-235 (2011).
- Lin, C. L., & Huang, H. M., Improved baseline productivity analysis technique. Journal of Construction Engineering and Management, 136(3), 367-376 (2009).
- Navon, R., Automated project performance control of construction projects. Automation in Construction, 14(4), 467-476 (2005).
- Oglesby, C. H., Parker, H. W., & Howell, G. A., Productivity improvement in construction (pp. 176-180). New York: McGraw-Hill (1989).
- Park, H. S., Thomas, S. R., & Tucker, R. L., Benchmarking of construction productivity. Journal of Construction Engineering and Management, 131(7), 772-778 (2005).
- Proverbs, D. G., Holt, G. D., & Olomolaiye, P. O., Factors impacting construction project duration: a comparison between France, Germany and the UK. Building and environment, 34(2), 197-204 (1998).
- Sweis, G. J., Impact of conversion technology on productivity in masonry construction (Doctoral dissertation, Northwestern University) (2000).
- Thomas, H. Randolph, Quantification of economics losses caused by labor inefficiencies. Proc., Construction Super Conf., Vendome Group, New York (2007).
- Thomas, H. R., Riley, D. R., & Sanvido, V. E., Loss of labor productivity due to delivery methods and weather. Journal of Construction Engineering and Management, 125(1), 39-46 (1999).
- Thomas, H. R., & Završki, I., Construction baseline productivity: Theory and practice. Journal of Construction Engineering and Management, 125(5), 295-303 (1999).
- Thomas, H. R., & Sanvido, V. E., Role of the fabricator in labor productivity. Journal of construction engineering and management, 126(5), 358-365 (2000).
- Yi, W., & Chan, A. P., Critical review of labor productivity research in construction journals. Journal of Management in Engineering, 30(2), 214-225 (2013).
- Zhao, T., & Dungan, J. M., Improved Baseline Method to Calculate Lost Construction Productivity. Journal of Construction Engineering and Management, 140(2) (2013).


