Phytoplankton Abundance and Species Diversity in Ranjit Sagar Wetland, Punjab (India)
Onkar Singh Brraich1 * and Sunil Kumar Saini1
DOI: http://dx.doi.org/10.12944/CWE.10.1.25
Copy the following to cite this article:
Brraich O. S, Saini S. K. Phytoplankton Abundance and Species Diversity in Ranjit Sagar Wetland, Punjab (India). Curr World Environ 2015;10(1) DOI:http://dx.doi.org/10.12944/CWE.10.1.25
Copy the following to cite this URL:
Brraich O. S, Saini S. K. Phytoplankton Abundance and Species Diversity in Ranjit Sagar Wetland, Punjab (India). Curr World Environ 2015;10(1). Available from: http://www.cwejournal.org/?p=8696
Download article (pdf)
Citation Manager
Publish History
Select type of program for download
| Endnote EndNote format (Mac & Win) | |
| Reference Manager Ris format (Win only) | |
| Procite Ris format (Win only) | |
| Medlars Format | |
| RefWorks Format RefWorks format (Mac & Win) | |
| BibTex Format BibTex format (Mac & Win) |
Article Publishing History
| Received: | 2015-02-26 |
|---|---|
| Accepted: | 2015-03-03 |
Wetlands are directly or indirectly support life of millions of living beings. Human civilization has started on the bank of major rivers. But due to increased population and anthropogenic pressures, the conditions of the most of the wetlands have already deteriorated and will dilapidate further. In India the freshwater constitutes rivers, streams, lakes, wetlands, ponds and reservoirs. These freshwater bodies directly help in the growth of human civilization. The freshwater resources are deteriorating at a very fast rate day by day and their water quality is now becoming a global problem (Tiwari and Mishra, 1986; Tiwari and Ali, 1987; Reddy and Venkateswar, 1987 and Khulab, 1989). Plankton are very sensitive and respond quickly to any changes in the environment which affect the plankton communities in terms of tolerance, abundance, diversity and dominance in the habitat. Therefore, it is observed that plankton act as pollution indicators to assess the pollution status of aquatic bodies (Mathivanan and Jayakumar, 1995). Phytoplankton is a fundamental component of many of these aquatic ecosystems, not only in terms of biological diversity but also because it contributes to primary productivity that helps to maintains fisheries and other important lake ecosystem attributes. Diversity of phytoplankton helps to enhance the productivity and strongly depicts the water quality (Moss, 1988) as well as corresponds to the biotic factors (Scheffer, 1998). Consequently, environmental change, whether it be through land use intensification, water pollution, siltation/or salinization, is causing increasingly complex impact problems for the wetland. Despite its importance, lake phytoplankton community composition, succession and productivity are genererally poorly known regionally and were not included in a recent review of Moroccan limnology (Chergui et al., 1999). Phytoplankton including many species are widely distributed in the aquatic ecosystems, which maintains their structural functions. They play an important and irreplaceable role of indicators and pollution purifiers, through participating in material cycle and energy flow in lakes (Mize and Demcheck, 2009 and Lei et al., 2010). The occurrences of different phytoplanktonic species in an aquatic ecosystem are considered as crucial biological indicator of the water quality. The phytoplankton are primary producers and play an important role in aquatic food chain, but some planktonic species can be harmful to human and other vertebrates by releasing toxic substances (hepatotoxins or neurotoxins, etc.). Regular studies should be conducted to check the proliferation of harmful species in the aquatic ecosystems. Phytoplanktonic studies can provide ample information to control the physico-chemical and biological conditions of the water in any irrigation project. Therefore, occurrence of blue green algae in the water shows contamination and reduces the recreational value of surface water, which can mar the water contact sports activities. Their large number can cause the depletion of oxygen in the water which will lead to mass mortality of fishes (Whitton and Patts, 2000). Hence monitoring of aquatic ecosystems from phytoplankton study point of view is very important to initiate conservation and management programs.
Material and Methods Study Area
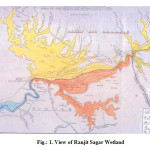
Ranjit Sagar wetland is a nationally important aquatic ecosystem. This wetland has been come into existence in the year 2006 by construction of dam on the river Ravi. This Wetland is located at the boundary of three states i.e. Punjab, Jammu & Kashmir and Himachal Pradesh on river Ravi at 32º 26’4.88”N, 75º 43’ 42.92” E and at elevation of 1697 ft. Reservoir is created by impoundment of river water for the purpose of generation of electricity, irrigation and for the supply of drinking water (Fig. 1)
 |
Figure 1: View of Ranjit Sagar Wetland Click here to View figure |
Collection and Preservation of Samples
Samples were collected on monthly basis from June, 2012 to May, 2014. Phytoplankton ring type (24 mesh/mm2) nets are used to collect the plankton samples from the water by filtering 100 litres of the water in a wide mouthed glass bottle. The phytoplankton sample were immediately preserved in a 5% formaldehyde solution in plastic sample bottles and transported to the Fish and Fisheries laboratory, Department of Zoology and Environmental Sciences, Punjabi University, Patiala, for identification and further analysis. Identification and counting of phytoplankton were done by use of binocular light microscope. Sedgwick Rafter Counting Chamber (Welch, 1948) was used to determine their density. Identification of phytoplankton was done by following relevant books (Needham and Needham, 1966; Edmondson, 1992 and APHA, 2012). Four indices were used to obtain estimation of species diversity, richness, dominance and species evenness.
 |
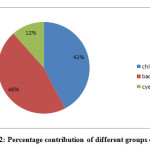
Figure 2: Percentage contribution of different groups of phytoplankton. Click here to View figure |
Shannon – Weaver Index of Diversity
The most widely used index for estimating the species diversity is Shannon - Weaver index (Shannon and Weaver, 1949) given by formula H′ = - Σ (ni / N) log 2 (ni / N), where H′ = Shannon – Weaver index ni = Importance value of each species (number of individuals) N = Total of importance value The value of this index can theoretically range from zero to infinity. However, values normally range from 0 to 4.
Species Richness
Margalef’s index (d): is a measure of species richness (Margalef’s, 1949) and is expressed as: d= S-1/InN Where; S is the number of species in samples. N is the number of individuals in the samples. This index commonly varies between 1 and 5, and larger the index indicates a more healthy waterbody. When it tends towards 1, pollution is thought to increase and damage should be suspected.
Index of Dominance
Within a major community there are species or groups which largely control the energy flow and strongly affect the environment of all other species. They are known as ecological dominance (Odum, 1971). The degree to which dominance is concentrated in one or many species can be expressed by an appropriate index of dominance that sums each species importance in relation to community as a whole. The index of dominance (Simpson, 1949) is the sum total of squares of the proportion of the species in the community and is expressed as follows: c = Σ (ni / N) 2, where c = Index of dominance ni = Importance value for each species N = Total importance value The value of ‘c’ varies between 0 and 1. Higher diversity values reflect diversified resources in the habitat available for components of the community. Decreased values indicate increase by an average species resulting in the lowering of the number of coexisting species in the community.
Evenness Index
Another major component of diversity is ‘evenness’ or ‘equitability’ in the apportionment of individuals among the species. It is expressed as e = H′ / log S (Pielou, 1966), where H′ = Shannon-Weaver index S = Number of species
Results and Discussion
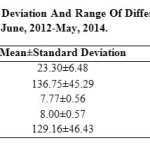
Water quality of any aquatic ecosystem can be assessed by its physico-chemical parameters which are considered as important constituents and extends help to enhance productivity of the water. Seasonal variations in the physico-chemical parameters of the wetland were studied during the period from June, 2012 to May, 2014. The mean, standard deviation and range of these parameters are shown in Table-3. Water Temperature (ºC), ranged between 11.9-30.9 (23.30±6.48), recorded maximum (30.9) in the month of July, 2013 and minimum (11.9) in the month of January, 2014. Water temperature correlated with air temperature as suggested by Kour and Joshi (2006) during their studies on physico-chemical parameters of River Ganga in and around Haridwar. Total dissolved solids (TDS), ranged between 70-200 (136.75±45.29), recorded maximum (200mg/l) in the month of November, 2013 and minimum (70 mg/l) in the month of May, 2014. The value of Dissolved oxygen (DO) ranged between 6.9-8.7 (7.77±0.56). The maximum value (8.7 mg/l) of Dissolved Oxygen (DO) recorded in the month of August, 2012 and minimum (6.9 mg/l) in March, 2014. The value of Hydrogen ion (pH) ranged between 7.1-9 (8.00±0.57). The maximum pH value (9) was recorded in the month of January, 2013 and minimum (7.1) in the month of April and May, 2014. In winter season, the value of pH rises due to low temperature and high values of DO and carbonate (Pandey et al., 1998). The value of Salinity ranged between 100-200 (129.16±46.43). During the study period we have recorded 26 genera of phytoplankton community belonging to three classes Cyanophyceae, Chlorophyceae and Bacillariophyceae from the Ranjit Sagar Wetland. Bacillariophyceae with 12 genera were found to be dominant in the wetland followed by the Chlorophyceae and Cyanophyceae. The range, mean and standard deviation of phytoplankton has also been recorded during the present study. Out of 26 genera 3 genera belong to class Cyanophyceae which includes; Microcystis spp. 3250-12875 (5973.95±3498.41), Anabaena spp. 1825-11775 (5834.37±2429.41), Oscillatoria spp. 4975-12950 (6939.58±4667.60). Class Chlorophyceae consist of 11 genera which includes; Spirogyra spp. 7525-29150 (10986.46±8286.09), Zygnema spp. 3950-15125 (7940.62±4968.96), Cladophora spp. 5500-16875 (9186.45±4959.40), Oedogonium spp. 5225-31225 (11919.79±8935.39), Microspora spp. 1175-9125 (5627.08±3382.07), Ulothrix spp. 5500-14650 (7903.12±3898.97), Pediastrum spp. 5000-16125 (8458.33±4116.65), Chlorella spp. 1450-17425 (5689.58±5279.66), Cosmarium spp. 1150-14825 (7225±3067.65), Oocystis spp. 1250-6450 (3332.29±1888.67) and Stigeoclonium spp. 7050-14425 (8982.29±4479.04) and Class Bacillariophyceae consist of 12 genera which includes; Acnanthes spp. 1600-9875 (6034.37±3386.85), Synedra spp. 3925-16575 (10481.25±4744.97), Fragillaria spp. 5225-22250 (14755.21±4767.02), Meridion spp. 1800-9550 (4692.70±3284.89), Tabellaria spp. 7275-28675 (20133.33±5627.71), Navicula spp. 4525-21075 (10017.71±4452.06), Gyrosigma spp. 5100-12075 (7183.33±2756.88), Pinnularia spp. 4325-19975 (8647.91±4403.67), Nitzschia spp. 5225-12375 (7093.75±3279.857), Stauroneis spp. 1000-9575 (3685.41±2709.81), Cymbella spp. 7850-17050 (13159.38±4742.33) and Gomphonema spp. 5500-18275 (9542.70±4301.42) Table- 1.
Table 1: Phytoplankton Composition at Ranjit Sagar Wetland During June, 2012-May, 2014.
| PHYTOPLANKTON | MEAN±STANDARD DEVIATION | RANGE |
| CYANOPHYCEAE | ||
| Microcystis spp. | 5973.95±3498.41 | 3250-12875 |
| Anabaena spp. | 5834.37±2429.41 | 1825-11775 |
| Oscillatoria spp. | 6939.58±4667.60 | 4975-12950 |
| CHLOROPHYCEAE | ||
| Spirogyra spp. | 10986.46±8286.09 | 7525-29150 |
| Zygnema spp. | 7940.62±4968.96 | 3950-15125 |
| Cladophora spp. | 9186.45±4959.40 | 5500-16875 |
| Oedogonium spp. | 11919.79±8935.39 | 5225-31225 |
| Microspora spp. | 5627.08±3382.07 | 1175-9125 |
| Ulothrix spp. | 7903.12±3898.97 | 5500-14650 |
| Pediastrum spp. | 8458.33±4116.65 | 5000-16125 |
| Chlorella spp. | 5689.58±5279.66 | 1450-17425 |
| Cosmarium spp. | 7225±3067.65 | 1150-14825 |
| Oocystis spp. | 3332.29±1888.67 | 1250-6450 |
| Stigeoclonium spp. | 8982.29±4479.04 | 7050-14425 |
| BACILLARIOPHYCEAE | ||
| Acnanthes spp. | 6034.37±3386.85 | 1600-9875 |
| Synedra spp. | 10481.25±4744.97 | 3925-16575 |
| Fragillaria spp. | 14755.21±4767.02 | 5225-22250 |
| Meridion spp. | 4692.70±3284.89 | 1800-9550 |
| Tabellaria spp. | 20133.33±5627.71 | 7275-28675 |
| Navicula spp. | 10017.71±4452.06 | 4525-21075 |
| Gyrosigma spp. | 7183.33±2756.88 | 5100-12075 |
| Pinnularia spp. | 8647.91±4403.67 | 4325-19975 |
| Nitzschia spp. | 7093.75±3279.857 | 5225-12375 |
| Stauroneis spp. | 3685.41±2709.81 | 1000-9575 |
| Cymbella spp. | 13159.38±4742.33 | 7850-17050 |
| Gomphonema spp. | 9542.70±4301.42 | 5500-18275 |
Shannon - Weaver index is employed to assess the planktonic species diversity of this wetland. During the study Shannon – Weaver index was found to be highest 2.384 for Bacillariophyceae and minimum 1.096 for Cyanophyceae. The species richness value was highest 0.9548 for Chlorophyceae and minimum 0.2033 for Cyanophyceae. Species evenness of phytoplankton ranges from 0.879-0.997. Maximum species evenness was recorded for Cyanophyceae and
minimum for Chlorophyceae. Dominance index of phytoplankton was found highest 0.3355 for the class Cyanophyceae and minimum 0.0982 for Chlorophyceae.
Table 2: Variations Of Phytoplankton Biodiversity Indices At Ranjit Sagar Wetland During June, 2012-May, 2014.
| Indices | Cyanophyceae | Chlorophyceae | Bacillariophyceae |
| Species Diversity | 1.096 | 2.352 | 2.384 |
| Species Richness | 0.2033 | 0.9548 | 0.9437 |
| Species Evenness | 0.997 | 0.879 | 0.9041 |
| Dominance | 0.3355 | 0.09882 | 0.1011 |
 |
Table 3: Mean, Standard Deviation And Range of Different Parameter At Ranjit Sager Wetland During June, 2012-May, 2014. Click here to View table |
The diversity of phytoplankton community shows high abundance in the month of November, December and January. This density is due to the high photosynthetic activity in the wetland. Sukunan (1980) also observed that the population density showed abrupt increase during post monsoon period. Seasonal fluctuations have great impact on phytoplankton population especially diatoms and they exhibit bimodal peaks which is shown during monsoon (August) and another in winter (November to January) and register decline in summer season (June-July). Singh and Swarup (1979) and Sawhney (2008) also observed the similar findings in their studies. Chlorophyceae comprises an important phytoplanktonic group both in terms of abundance and frequency occurrence. The seasonal variation of Chlorophyceae showed maximum in winter (December-January) and minimum in summer months (June-July) during the present course of work. ChanderMohan (1993) also observed the similar results and concluded that the count of Chlorophycean remained low during summer season due to increased feeding activities of zooplankton and fishes which is associated with high temperature. Welch (1952) observed that the count of Chlorophycean increases during the winter season, it is contributed to the presence of high DO and bicarbonates in the water which favours their quick growth. Similar findings were observed during the present investigations that DO and bicarbonates have direct relationship with high count of Chlorophycean. It is observed that Cyanophycean phytoplanktonic group exhibit their least representation throughout the year, but they show their maximum abundance during monsoon and summer seasons. Low temperature and reduced photoperiod during winter season seems to be responsible for their minimum occurrence in this period. Similar observations have also been given by Munawar (1970), Singh and Swarup (1979) and ChanderMohan (1993).
Acknowledgement
We express our special thanks to the Ministry of Environment and Forests, Government of India for providing funds to conduct this study and authors are also thankful to the head, Department of Zoology and Environment Sciences, Punjabi university Patiala for providing necessary laboratory facilities to carry out the work.
References
- Tiwari T. N. and Mishra M., Life Sci. Adv., 5, 130-137 (1986).
- Tiwari T. N. and Ali M., J. Environ. Prot., 7, 347-351 (1987).
- Reddy P. M. and Venkateswar V., J. Environ. Biol., 8, 109-119 (1987).
- Khulab R. D., Prospective in aquatic biology. Papyrus Publication House, New Delhi, (1989).
- Mathivanan V. and Jayakumar S., The studies on plankton fluctuation in a reservoir of Annamalainagar. Proceedings of the national symposium on recent trends in Indian wild life research, AVC College, Mayiladuthurai, Tamilnadu, India, (1995).
- Moss B., Ecology of Freshwaters, Man and Medium, second edition, Blackwell Scientific Publications, London, 417 (1988).
- Scheffer M., Ecology of Shallow Lakes. Chapman & Hall, London, (1998).
- Chergui H., Pattee E., Khadija E. and Aloui Mhamdi M., Moroccan limnology. In: RG Wetzel & B Gopal (eds.) Limnol Develop Countries (SIL) 2, 235–330 (1999).
- Mize S. V. and Demcheck D. K., Water quality and phytoplankton communities in Lake Pontchartrain during and after the Bonnet Carr´e Spillway opening, April to October 2008, in Louisiana, USA, Geo-Marine Letters, 29(6), 431–440 (2009).
- Lei H., Liang Y. Q. and Zhu A. M., J. Lake Sci., 22(2), 195–200 (2010).
- Whitton B. A. and Patts M., The Ecology of Cyanobacteria. Kluwer Academic Publishers, Netherlands, (2000).
- Welch P. S., Limnological method, McGrew Hill, New York, USA, (1948).
- Needham G. T. and Needham P. R., A guide to freshwater biology, 5th ed., Holden Day Inc Sanfransisco, 108 (1966).
- Edmondson W. T., Ward and Whipple’s Freshwater biology, 2nd ed., John Wiley and Sons, New York, 1248 (1992).
- American Public Health Organisation. Standard method for the examination of water and waste water, 21st ed., American Public Health Association, American water works Association and Water Environment Federation, New York, (2012).
- Shannon C. E. and Weaver W., The Mathematical theory of communication, University of Illinois Press-Urbana, 125 (1949).
- Margalef D. I., Publication institute biological application, Barcelona. 9, 5-27 (1949).
- Odum E. P., Fundamentals of Ecology, W. B. Saunders, Philadelphia, 202 (1971).
- Simpson E. H., Nat., 163, 688 (1949).
- Pielou E. C., J. Theor. Biol., 13, 131-144 (1966).
- Kour S. and Joshi B. D., Hin. J. Environ. Zool., 17(1), 45-55 (2006).
- Pandey B. N., Mishra A. K., Das P. K. L. and Jha A. K., Acts. Ecol., 15(2), 98-102 (1993).
- ChanderMohan, Limnology of Lake Mansar with Particular reference to primary producers. Ph.D. Thesis, University of Jammu, Jammu, (1993).
- Sawhney N., Biodiversity of river Tawi in the vicinity of Jammu City. Ph.D. Thesis, University of Jammu, Jammu, (2008).
- Kensa M. V., Plant Sci. Feed, 1(8), 147-154 (2011).
- Sukunan V. V., J. Inland Fish. Soc., 12, 79 – 91 (1980).
- Singh S. R. and Swarup K., J. Indian Bot. Soc., 58, 319-329 (1979).
- Welch P. S., Limnology, Second Edition. McGraw Hill, Book Co. New York and London, (1952).
- Munawar M., Hydrobiol., 25(1), 127-162 (1970).


