Green GDP and Sustainable Development in Malaysia
Negin Vaghefi1 * , Chamhuri Siwar1 and Sarah Aziz Abdul Ghani Aziz1
1
Institute for Environment and Development (LESTARI),
Universiti Kebangsaan Malaysia, 43600 UKM Bangi,
Selangor Darul Ehsan
Malaysia
DOI: http://dx.doi.org/10.12944/CWE.10.1.01
Copy the following to cite this article:
Vaghefi N, Siwar C, Aziz S. A. A. G. Green GDP and Sustainable Development in Malaysia. Curr World Environ 2015;10(1) DOI:http://dx.doi.org/10.12944/CWE.10.1.01
Copy the following to cite this URL:
Vaghefi N, Siwar C, Aziz S. A. A. G. Green GDP and Sustainable Development in Malaysia. Curr World Environ 2015;10(1). Available from: http://www.cwejournal.org/?p=8731
Download article (pdf)
Citation Manager
Publish History
Select type of program for download
| Endnote EndNote format (Mac & Win) | |
| Reference Manager Ris format (Win only) | |
| Procite Ris format (Win only) | |
| Medlars Format | |
| RefWorks Format RefWorks format (Mac & Win) | |
| BibTex Format BibTex format (Mac & Win) |
Article Publishing History
| Received: | 2014-11-30 |
|---|---|
| Accepted: | 2015-03-23 |
Economic growth basically refers to the real growth in Gross Domestic Product (GDP). GDP is computed as a sum of all final goods and services that produced within a period of time at market prices. It is measured by adding together a nation’s personal consumption expenditure, government spending, net exports, and net capital formation1. From sustainability perspective, GDP ignores externalities, specially the environmental externalities. In fact, it just measures what is produced and therefore ignores what is needed to generate that production. It also does not measure the economic well-being such as clean air and water.
Since GDP does not measure the sustainability of growth, it could not be a good measure of social welfare. There is a growing concern that GDP measurement may encourage the natural resources depletion faster than they can renew themselves1. Another concern about GDP measurement is the ‘threshold effect’. According to Max-Neef2, GDP increase or economic growth brings about an improvement in the quality of life up to a point. Beyond this point, more economic growth may deteriorate the quality of life due to the costs associated with increasing income inequality, loss of leisure time, and natural capital depletion. These deficiencies could be prevailed by using accounting price or by measuring the green GDP, which considers the natural capital depreciation and environmental degradation as well. There are other alternatives to GDP, including Green Net National Product (Green NNP)3, Index of Sustainable Economic Welfare (ISEW)4, Genuine Progress Indicator (GPI)5, and Genuine Savings (GS)6. These are also considered as sustainable development indicators. Applying these methods depends on data availability and user’s preference.
In recent years, Malaysia, as a rapidly developing economy in Asia, has been able to achieve a positive economic growth. Based on World Bank report, Malaysia is classified as upper-middle income country. Its average economic growth was more than 6 percent per year for around 25 years. This growth was accompanied by significant reduction in poverty from 19.4 percent in 1987 to 1.7 percent in 2012. The Malaysian government is trying to encourage increasing the domestic demand to reduce its dependence on exports. However, exports, especially of agricultural products and electronics, are still important drivers of its economic growth. In Malaysia, due to fast economic growth and increasing population, the risk of degradation of environmental quality is increasing. As a result of population expansion and GDP growth, energy demand is increasing over time. Together with increasing energy consumption, GHG emission per capita has also been increased. This paper aims to estimate the Green GDP metric for assessing the sustainability growth path of Malaysia from 1987 to 2011. Challenges of Green GDP implementation are also discussed at the end of the paper.
Green GDP
The idea of Green GDP arose in the early 1990s in response to the shortcomings of traditional GDP to account for the economic costs of natural resource depletion and pollution damages, which in turn would influence human welfare7. Main purposes of Green GDP accounting are to provide a more correct measure of welfare and to examine the sustainability of economy8. In recent years, Green GDP accounting has become significant basis to develop and implement the sustainable development strategies in the world. One of the most remarkable attempts to assess the Green GDP was China. They included the cost of water, air and solid waste pollution and different natural resource depletion as well as social and public health cost in their assessment9. However, some countries, based on data availability, just considered one or two environmental adjustments for their Green GDP accounting. In fact, there is no general agreement on how Green GDP could be estimated and less consensus on whether it should be attempted at all10. Nevertheless, the most common approach to measure the Green GDP is;
Green GDP= Gross Domestic Product ‒ Natural Resources Depletion ‒ Pollution Damage
Gross Domestic Product
Malaysia is identified as an open economy country with fast economic growth and exports based. Based on Figure 1, the GDP of Malaysia had upward trend with average annual growth rate of 6.2 percent from 1987 to 2012. A sharp GDP fall was recorded in 1998 because of the Asian Financial Crisis (AFC) which originated from Thailand. The GDP growth rate fell from 7.3 percent in 1997 to -7.4 percent in 1998. However, the Malaysian economy started its recovery in 1999 by developing new economic policies that promoted direct investment from developed countries and by the development of export-oriented industries. After the AFC, Malaysia became more export dependent, mainly on electronic and electrical exports. The second sharp decline was noted in 2008/2009 due to the international financial crisis and the drastic contraction in export value. The fall in exports adversely affected economic growth, especially in the manufacturing sector, in the first quarter of 2009 year-on-year11.
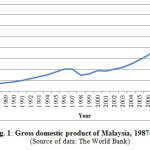 |
Figure 1: Gross domestic product of Malaysia, 1987-2012 (Source of data: The World Bank) Click here to View figure |
There is a general impression that there is a positive relationship between economic growth and environmental protection. Since environment is a source of economically important services, protecting the environment may promote to GDP growth of a country12. Some researchers believe that per capita GDP grows less rapidly in resource rich countries than in resource poor countries12,13. Because export earnings have been eroded over time by reducing prices of resource-based commodities and falling export earnings could definitely reduce GDP growth. If countries want to expand their asset base, the depleted natural resources should be restored or substituted. Otherwise, they may achieve high economic growth for a short time, but not on a sustained basis.
Natural Resource Depletion
Malaysia is considered as one of the resource-rich countries in the world. Around 40 years ago, Malaysia was one of the largest producers of tin, timber, rubber, oil palm, Marin fish, oil, and natural gas in the world. As decades passed, Malaysia’s economy shifted from traditional to modern economy and focused on electronic and services. Today, the economy in Peninsular Malaysia is mostly dominated by manufacturing; however, the economy of Sabah and Sarawak is still resource-based. Even Malaysia’s economic growth had upward trend, there is a big question: is it on a sustainable pathway? The temporary high GDP could be achieved by over extraction of natural resources. But, it may threaten the future development of the country. In addition, highly dependency on natural resources revenue leaves the country vulnerable to price changes in the natural resources. For instance, prices of some natural resources like crude oil are subject to large fluctuation.
In this study, the natural resource depletion (% of GNI) data came from the World Bank. It is the sum of net forest depletion, energy depletion, and mineral depletion. The World Bank estimated the net forest depletion as the unit resource rents multiplied by the excess of round wood harvest over natural growth. The energy depletion is calculated as the ratio of the value of energy resources stock to the remaining reserve life time. It includes coal, crude oil, and natural gas. Mineral depletion is also estimated as the ratio of the value of the mineral resources stock to the remaining reserve lifetime. The mineral depletion covers tin, gold, zinc, lead, copper, nickel, iron, silver, bauxite, and phosphate.
Among natural resources depletion, energy depletion is more prominent than net forest and mineral depletion (Figure 2). As Malaysia’s economy is continuously growing, more energy is needed. Due to increasing in energy consumption, the country has experienced high growth in GHG emission levels. Since Malaysia is trying to reduce its carbon emission, alternative sources of energy like nuclear and solar energy would be required. Malaysia depleted its energy mostly in 2007-2008, largely due to the changes in oil prices. Considering the depletion of natural resources into GDP accounts may indicate an understandable link between resource changes and economic growth.
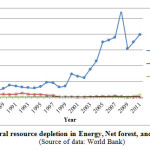 |
Figure 2: Malaysia natural resource depletion in Energy, Net forest, and Mineral, 1990-2011 (Source of data: World Bank) Click here to View figure |
Pollution damage
Environmental problem is one of the most challenging issues in Malaysia. It is due to the rapid industrialization, agricultural activities, tourism, and export activities which increased air pollution, water pollution and waste14. In recent years, Malaysia was experiencing high air pollution due to increase in road traffic and rapid economic development. Water pollution from household waste water also became a big problem that affecting urban areas. Other environmental problems in Malaysia are haze caused by forest fire, deforestation, and oil pollution of the sea. However, due to good action of government in pollution control, environmental problems in Malaysia do not appear to be as critical as in other Southeast Asian countries15.
In this study, carbon dioxide (CO2) damage is only considered because of a lack of sufficient data for other pollutants. Based on World Bank data, CO2 damage is calculated to be 20 USD per ton of carbon (the unit damage in 1995 USD) multiplied by the number of tons of carbon emitted. CO2 is the most important anthropogenic GHG which has the largest contribution from human activities. Among Southeast Asian countries, Malaysia is one of the largest contributors of CO2 emission. Based on the report released by Malaysian Department of Environment16, transport is a major contributor to CO2 emissions (97.1%), mainly from motor vehicles. Figure 3 indicates the increasing trend of CO2 emission over 24 years in Malaysia. The problem of CO2 emission has become an important issue which is affecting the environmental degradation of the country.
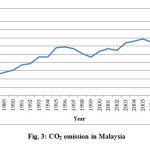 |
Figure 3: CO2 emission in Malaysia Click here to View figure |
Results and Discussion Green GDP for Malaysia
Figure 4 shows the comparison of traditional and Green GDP for Malaysia. The Green GDP runs almost parallel to the traditional GDP at a slightly lower rate of change until year 2001. After that the gap between traditional and Green GDP becomes wider. It indicates that natural capital depletion and pollution damages increased. If real GDP growth is positive but Green GDP growth is negative, it means that economic losses due to natural capital depletion and environmental damages are greater than the economic gains due to increased production of goods and services. Even the trend of Green GDP is lower than GDP; it is still positive which shows the economy of Malaysia is operating on the sustainable pathway. The annual growth rate of Green GDP and real GDP is almost same. However, during economic crisis of 2008/2009 Green GDP growth fell more (around 9 percent) than traditional GDP (around 7 percent). It was the larger decline of Green GDP that causes serious concerns on future natural capital of Malaysia.
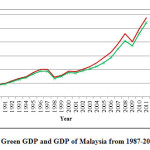 |
Figure 4: Green GDP and GDP of Malaysia from 1987-2011 Click here to View figure |
Figure 5 indicates that the imputed natural resources and environmental costs as a proportion of GDP are increasing about 0.05 percent per year. During 1987-2011, an average natural resources and environmental costs were 8.5 percent of GDP. Energy depletion is identified as a major contributing factor in Malaysia.
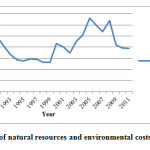 |
Figure 5: Proportion of natural resources and environmental costs to GDP for Malaysia Click here to View figure |
In this study, there are some shortcomings in estimation of Green GDP for Malaysia. Some environmental and natural resource costs are not included due to the difficulty in finding data and estimating them accurately. For example, only CO2 emission costs are estimated and other pollution costs are ignored. In addition, the whole categories of natural resource depletion and ecological damage are not included. Hence, the economic loss of environmental damages and natural resource depletion are estimated less than the actual costs.
Challenges of Green GDP Implementation
Some previous studies found that there are some uncertainties with Green GDP metric which it could not be reliably applied as an official government statistic17,18. Since Green GDP accounting needs wide data collection and has the problem in collecting and analysing data, it would be very difficult to promote. In addition, the cost of data collection in terms of time and financial resources could also be another problem. Sometimes the costs of data collection are greater than the benefits. Because of that some studies may do not consider all environmental adjustments for Green GDP accounting. This causes the over simplification of the problem and underestimation of the correct costs of natural resource depletion and environmental damages. Due to the difficulty and uncertainty of natural resources depletion and environmental damages the economic losses valuation may just show a part of correct costs. However, these results could be very useful in policy making of the integrated environmental and economic. There are some uncertainties about the role of natural resources in production and consumption possibilities due to differences in people’s ethical values. It is difficult to set the price on some natural resources like some ecosystem services. Nevertheless, some countries like China and Norway recommended some strategies to increase the robustness of Green GDP metric. They recommended developing an accurate accounting and valuation system, utilizing knowledge resources to develop more standardized valuation techniques, and improving data transparency.
Green GDP Implementation in Malaysia
Based on sustainable development concept, current generation should not compromise the well-being of future generation. It means that natural resources should be used more efficiently so that they would be available for many years to come. In fact, it could be attained by adopting sustainable development strategies, decreasing emission and pollution intensity, and reducing consumption level. Malaysia is also adopting some sustainable development strategies to save its environment and natural resources. To achieve the goal of sustainable development, Malaysia had started to implement green economy policies around 1970s with introducing the regulations to manage pollution from the palm oil industry. Malaysia’s policy framework in energy development gradually developed by focusing on fossil fuel supply in the 1970 s to a diversification of supply sources (renewable energy) by the year 2000. Government created Ministry of Energy, Green Technology, and Water to implement green economy policies and launched the National Green Technology Policy (NGTP) to promote more efficient use of technology which could be less harmful to the environment. NGTP shall be a driver to accelerate the national economy and promote sustainable development in the country19,20.
Green GDP accounting would indicate an explicit pathway towards improved policy formulation for sustainable development in Malaysia. For Green GDP implementation in Malaysia, starting with most important natural resources commodities such as crude oil, natural gas, rubber and palm oil would be more appropriate in terms of environmental pollution valuation and resource depletion. For more accurate Green GDP accounting, government could develop a robust environmental accounting system. Government as policy maker could establish the accounting scheme and national database to improve environmental valuation.
To get the required information for sustainable development, monetary data together with physical data, as complementary data, is needed. In fact, monetary data are useful to describe the relations’ value between natural resources and economy. However, they are not enough to obtain the information needed to achieve the sustainable development. Physical data could be linked with monetary data by inferring imputed value. Physical data are often more suitable than monetary data for explaining the mutual relations between environment and economy21. Green GDP could be precisely calculated by adopting more reliable valuation technique. Supporting research and development (R&D) in this area by government may significantly help to get more reliable data and accurate result.
Conclusions
From the environmental point of view, real GDP fails to consider depletion of natural resources and pollution damages. Green GDP gives value to the cost of environmental losses and therefore adjusts GDP to reflect the environmental costs. In developing countries with rapid economic growth like Malaysia, the linkage between environment and economics is very important. Since natural capital is recognized as an important economy asset that could have potential for long-term contribution to productivity and welfare, it is necessary to treat them very well. Malaysia needs to invest more to sustain its consumption and achieve a sustainable economic growth. It also needs to promote intensive growth patterns with low consumption, low input and low emission in all economic sectors.
Since Green GDP is still in the developing stage in the world, no country has substituted the traditional GDP with the Green GDP yet. In this study, due to problems with data availability, the economic loss calculation was underestimated. Hence, it is essential to establish a national and local database and develop a robust environmental accounting system for more accurate and comprehensive data collection and accounting. Funding research and development by government plays an important role in environmental valuation research. Thus, future researchers could consider more comprehensive data and improve the evaluation methodology for more robust assessment of the sustainable development in Malaysia.
Acknowledgements
This work was prepared under research projects ERGS/1/2013/SS07/UKM/01/1 and FRGS/1/2012/SS07/UKM/01/3 led by Professor Chamhuri Siwar and DPP/2013/073 led by Associate Professor Dr. Sarah Aziz Abdul Ghani Aziz at Universiti Kebangsaan Malaysia (UKM).
References
- Costanza, R., Hart, M., Posner, S. and Talberth, J.,The pardee papers,4, pp. 46 (2009). Max-Neef, M., Econ. 15:115-118 (1995). Weitzman, M.L. and Löfgren, K.G., Environ. Econ. Manag. 32:139-153 (1997). Daly, H. and Cobb, J., For the Common Good, Beacon Press, Boston, MA. 534 p (1989).
- Coob, C., Halstead, E. and Rowe, J., The Genuine Progress Indicator: Summary of Data and Methodology, San Francisco CA: Redefining Progress (1995).
- Pearce, D.W., Atkinson, G. and Hamilton, K., The Measurement of Sustainable Development, In: J.C.J.M. van den Bergh and M.W. Hofkes [eds.], Theory versus Implementation of Sustainable Development Modelling, Kluwer Academic Publishers (1998).
- Wu, J. and Wu, T., Green GDP. In: Berkshire Encyclopedia of Sustainability, Vol. II–The Business of Sustainability. Berkshire Great Barrington, pp. 248-250 (2010). Hanley, N., J. Econ. Surv. 14:1-30 (2000).
- Green accounting practice in China. United Nations environment programme, UNEP-Tongji institute of environment for sustainable development, college of environmental science and engineering Tongji University (2008).
- ttp://www.caep.org.cn/english/paper/Green-GDP-Accounting-Pratice-in-China-Draft-by-UNEP-Tongji-Team.pdf United Nations, European Commission, International Monetary Fund., Organisation for Economic Co-operation and Development and World Bank, Integrated Environmental and Economic Accounting 2003.
- Handbook of National Accounting, Studies in Methods. New York, United Nations (2003). Khoon, G.S. and Lim (Mah-Hui.)., The impact of the global financial crisis: the case of Malaysia. Third World network (TWN) (2010).
- Vincent, J.R., Ecosystem services and green growth, World Bank Policy Research Working Paper. No. 6233 (2012).
- Sachs, J.D. and Warner, A.M., Natural resource abundance and economic growth, Development Discussion Paper No. 517a. Harvard Institute for International Development, Cambridge, MA (1995). Razak, M.I.M., Ahmad, H.I., Bujang, I., Talib, A.H. and Ibrahim, Z., International Journal of Humanities and Social Science. 3:173-177 (2013).
- Overview of Environmental Issues and Environmental Conservation Practices in Malaysia., Overseas Environmental Measures of Japanese Companies, Malaysia, Research Report on Trends in Environmental Considerations Related to Overseas Activities of Japanese Companies, FY 1999. Global Environmental Forum (2000).
- Malaysian Department of Environment., Retrieve from (2010). http://www.doe.gov.my/portal/ Oberheitmann, A.,China aktuell: Journal of Current Chinese Affairs. 4:41-64 (2005). Rauch, J.N. and Chi, Y.F., Consilience: the Journal of Sustainable Development. 3:102-116 (2010).
- Hezri, A.A. and Ghazali, R., A Fair Green Economy? Studies of Agriculture, Energy and Waste Initiatives in Malaysia. Occasional Paper Two, Social Dimensions of Green Economy and Sustainable Development (2011).
- http://www.fes-globalization.org/geneva Chua, S.C. and Oh, T.H., Renew. Sust. Energ. Rev.15:2850-2861 (2011). Kaneda, I., Environment and Development, Vol II (n.d). http://www.eolss.net/sample-chapters/c13/e4-25-06-02.pdf


