Optimization and Characterization of Biochar Obtained from the Weedy Biomass of Calotropis gigantea Using Vacuum Pyrolysis
Poonam Poonia
*
 and Loveena Gaur
1
Department of Zoology,
Jai Narain Vyas University,
Jodhpur,
Rajasthan
India
http://dx.doi.org/10.12944/CWE.19.1.7
Copy the following to cite this article:
Poonia P, Gaur L. Optimization and Characterization of Biochar Obtained from the Weedy Biomass of Calotropis gigantea Using Vacuum Pyrolysis. Curr World Environ 2024;19(1). DOI:http://dx.doi.org/10.12944/CWE.19.1.7
Copy the following to cite this URL:
Poonia P, Gaur L. Optimization and Characterization of Biochar Obtained from the Weedy Biomass of Calotropis gigantea Using Vacuum Pyrolysis. Curr World Environ 2024;19(1).
Download article (pdf)
Citation Manager
Publish History

Introduction
Biochar is a promising renewable energy source that is gaining global attention due to its applicability in agriculture, wastewater treatment, decontamination of soil pollutants, carbon sequestration, etc.1,2,3,4. Biochar is obtained from woody biomass by thermochemical degradation via two main processes, pyrolysis and gasification5,6. In the pyrolysis process, thermal conversion of biomass is carried out either under vacuum conditions or in the presence of inert gas (such as N2), in the absence of oxygen, and generally at temperatures ranging from 400°C to 1000°C 7, 8. The bi-products obtained are carbonized solid (biochar), liquid (bio-crude or bio-oil), and non-condensable gas (syngas)8, 9.
Biochar is black in colour, highly porous, light weight and a fine grained solid material. It is mainly characterized by the enhanced properties of high surface area, porosity, cation exchange capacity (CEC), and organic C content 6,10,11. The physical and chemical properties of biochar are mainly determined by the type of feedstock/biomass and the pyrolytic conditions such as heating rate, residence time, pressure, and atmosphere (presence/absence of air or N2)12. In recent years, various researchers have acquired biochar from the feedstock of invasive weeds for soil and water pollutant removal and soil improvement in agriculture 13, 14, 15, 16. Weeds are undesirable plants that grow with cultivated crops or on wasteland and cause a reduction in soil fertility and crop yield. It significantly damages the local ecological environment17, 18. Control and disposal of these weeds require significant manpower and materialistic resources19, 20. Weeds are herbaceous, abundantly found, easily available, and have a rapid growth rate; thus can be considered as sustainable, potential and cheap source for biochar production.
Very few have been reported on biochar production from invasive weeds by slow pyrolysis along with vacuum conditions. This study obtained biochar by vacuum pyrolysis of the invasive weed Calotropis gigantea at 450°C. Calotropis gigantea is also called ‘the crown’ and is commonly found in the wastelands of Africa and Asia. In India, it is the most common weed and is locally known as ‘aak or arka. It is a large shrub approximately 4 m tall. It is characterised by clusters of waxy flowers that are either white or lavender in color. The main chemical constituents of Calotropis are cellulose (49-63.5%), hemicellulose (19.29-22.08%), and lignin (10.38-20.5%) 21, 22. Vacuum pyrolysis was carried out in total air-free conditions and at a low pressure of approximately 10-12 PKa. Vacuum pyrolysis has several advantages over atmospheric pyrolysis, such as shorter residence time, avoidance of secondary reactions, and production of high carbon content biochar with a more oxidant-sensitive surface 23, 24 25. Ma et al. 24 expected that biochar obtained by this process has more open pore structure and is the most appropriate feedstock for the production of activated carbon.
The physicochemical and morphological properties of biochar were evaluated using elemental and proximate analysis, BET, SEM, EDX, and FTIR. By the characterizing of biochar, this study is expected to promote the potential of invasive weeds as a sustainable feedstock for biochar production and its applicability in wastewater treatment and agriculture. The potential of weed biomass for biochar production is yet in the infant stage and require extensive research to explore its potential.
Material and Methodology
Response surface method (RSM) for prediction model
RSM was adopted to optimize the preparation conditions of biochar from the feedstock C. gigantea. Design expert 13.0 software was employed to design the experiment, examine and tabulate the response, and analyze the experimental results. A central composite design (CCD) tool was used to optimize the carbon content, surface area, pore size, and pore volume of the composite. For the optimization, biomass particle sizes varied for different ranges of less than 50 mm, between 50 and 100 mm, and greater than 100 mm and were subsequently coded as -1, 0, and 1, respectively and; temperatures were varied between 350 to 550oC. A total of 13 runs were found on the surface response of the CCD. Statistical fitness was also assessed using ANOVA for the quadratic model. The ANOVA results give P-values, model F-values, and lack of fit F-values. P-values less than 0.05 represent significant model terms; higher F-values denote the model’s significance, and there is very less chance that the values could be due to noise.
Vacuum Pyrolysis Setup
Pyrolysis of Calotropis feed stock was performed in a vacuum pyrolysis system at the Department of Renewable Energy Engineering, College of Technology and Engineering, Maharana Pratap University of Agriculture and Technology, Udaipur, Rajasthan, India. The system consists of a 5-7 kg feedstock cartridge, pyrolysis chamber, vacuum pump, electric heater device (7kW), liquid collector, condenser (shell and tube type), electronic control device, and other components. The feedstock cartridge was made of SS316 (stainless steel). The experiment was conducted at temperature 450oC with a residence time of 60 min under a total vacuum pressure of 10-12 kPa. The gasses and vapors inside the pyrolytic chamber were removed using a vacuum pump. They were trapped in the condenser to obtain the liquid oil 25. After cooling the pyrolytic unit, the C-rich solid biochar was collected and the percentage yield was calculated using formula-1 described below26. The obtained biochar was sealed in air-tight polythene to avoid contact with air moisture to prevent oxidation and was analyzed for their characterization.
Biomass collection, preparation and characterization
The raw material Calotropis gigantea was collected from wasteland in Jodhpur, Rajasthan, India. The biomass was sun dried for 10 days and then oven dried at 70oC for 24 h to remove extra moisture. Dried biomass was chopped to reduce the size by about 50-100 mm before stock into a vacuum pyrolysis unit and was packed in plastic bags. For the analysis of pH, a solution of the biochar was prepared in deionized water in the ratio of 1:5, 1:10, and 1:20 (biochar: deionised water) and was shaken for about one hour. This was then allowed to stand for 30 min, and the pH was measured using pH meter Systronics 1010 27. The biomass and biochar were examined for proximate analysis and elemental analysis for various parameters such as moisture, volatile, ash, fixed carbon (ASTM 3173-87 method) and content of C, H, N, and S by elemental analysis (vario MICRO Cube). TGA of feedstock was conducted using a TG analyzer (Model: STA 7300 of Hitachi company, Germany). The BET analysis of biochar samples was determined at -197°C using the nitrogen sorption-desorption method (Micromeritics, ASAP, 2010). SEM/EDX of biochar samples were analyzed by high-resolution scanning electron microscopy (JEOL JSM 7100F) to study the microstructures and some localized elemental compositions such as C, O, Na, Mg, and K. FTIR was recorded at 8 cm-1 resolution over a wavelength range of 4000 cm-1 to 650 cm-1 (Cary 630 FTIR of Agilent technologies) to identify the distribution of functional groups.
Results and Discussion
Statistical significance of the RSM results
Table 1 shows the ANOVA results for responses fixed carbon, carbon, surface area, pore volume, and pore size, respectively, based on the RSM study employed by the design expert13.0. The model F-value for responses fixed carbon, carbon, surface area, pore volume, and pore size were found to be 58.81, 20.98, 192.39, 8.84, and 10.12, respectively, implying that the model is significant and there is only a 0.01%, 0.04%, 0.01%, 0.62%, and 0.42% chance that an F-value this large could occur due to noise. P-values reported less than 0.0500 for all responses indicate that model terms are significant. Thus, the hypothesis of the present study that particle size and temperature have a significant effect on the selected responses is confirmed Table 1.
Furthermore, statistical fitting analysis of fixed carbon reveals R² value of 0.9767, which represents a significant value for the regression model. In addition the predicted R² of 0.8205 is in reasonable agreement with the adjusted R² of 0.9601, with a difference of less than 0.2, which shows that the model can predict the response accurately. Similar results were observed for surface area, where the predicted R² (0.9428) was found to be in reasonable agreement with the adjusted R² value (0.9876) and a difference of less than 2. Fit statistics for carbon and pore volume show that the predicted R² values of 0.4125 and 0.1848, respectively, are not as close to the adjusted R² values of 0.8928 and 0.7917, respectively, with a difference of more than 0.2. This may indicate a large block effect or a possible problem with the used model and/or data. A negative predicted R² value (-0.0777) is observed in the pore volume, implying that the overall mean may better predict the response than the current model. The Adeq precision measures the signal-to-noise ratio. The Adeq precision value of fixed carbon, carbon, surface area, pore volume, and pore size are found to be 24.220, 11.531, 43.003, 10.010, and 10.976, respectively, which offers an adequate signal-to-noise ratio as these are higher than 4 (desirable value). The coefficient of variation (CV %) for all the responses is less than 10%, representing a good model Table 2, Fig. 1(a), Fig. 1(b), Fig. 1(c), Fig. 1(d), Fig. 1 shows the correlation between the predicted and actual plots. Linearity shows that the employed model is useful for efficiently predicting the fixed carbon, carbon, surface area, pore volume, and pore size Fig. 1.
Fig. 2(a), Fig. 2(b), Fig. 2(c), Fig. 2(d), Fig. 2(e) displays the three-dimensional RSM plots. 3D plots show the attractiveness at particle sizes between 50 and 100 mm, as shown in “Fig. 2a”. The reactivity area decreases with increasing particle size, which may be related to increased pyrolysis and higher ash conversion. At 472.14 degrees Celsius, the fixed carbon Fig. 2a and carbon Fig. 2b were optimized. The impact of temperature and particle size on the surface area is shown in Fig. 2(c), Fig. 2(d), and Fig. 2(e) shows the effect of temperature and particle size on the pore volume and pore size, respectively. At ideal temperatures, a larger surface area and pore volume are desirable for effective adsorption. At 450°C, three distinct Calotropis gigantea particle sizes were examined. The RSM results analysis revealed that maximum fixed carbon, carbon, surface area, pore volume, and pore size may be found at 472.141°C, which agrees well with the outcomes at 450°C.
Table 1: ANOVA for quadratic model based on RSM design for various responses
Response | Source | Sum of Squares | Df | Mean Square | F-value | p-value |
|
Fixed carbon | Model | 0.0425 | 5 | 0.0085 | 58.81 | < 0.0001 | Significant |
A-Temperature | 0.0126 | 1 | 0.0126 | 87.29 | < 0.0001 |
| |
B-Particle size | 0.0040 | 1 | 0.0040 | 27.87 | 0.0011 |
| |
AB | 0.0001 | 1 | 0.0001 | 0.8338 | 0.3915 |
| |
A² | 0.0247 | 1 | 0.0247 | 171.21 | < 0.0001 |
| |
B² | 0.0010 | 1 | 0.0010 | 6.58 | 0.0373 |
| |
Carbon | Model | 0.0184 | 5 | 0.0037 | 20.98 | 0.0004 | Significant |
A-Temperature | 0.0014 | 1 | 0.0014 | 7.73 | 0.0273 |
| |
B-Particle size | 0.0001 | 1 | 0.0001 | 0.6065 | 0.4616 |
| |
AB | 0.0011 | 1 | 0.0011 | 6.48 | 0.0383 |
| |
A² | 0.0143 | 1 | 0.0143 | 81.32 | < 0.0001 |
| |
B² | 0.0001 | 1 | 0.0001 | 0.4897 | 0.5067 |
| |
Surface area | Model | 0.0946 | 5 | 0.0189 | 192.39 | < 0.0001 | Significant |
A-Temperature | 0.0477 | 1 | 0.0477 | 485.15 | < 0.0001 |
| |
B-Particle size | 0.0090 | 1 | 0.0090 | 91.70 | < 0.0001 |
| |
AB | 0.0002 | 1 | 0.0002 | 2.13 | 0.1881 |
| |
A² | 0.0370 | 1 | 0.0370 | 376.45 | < 0.0001 |
| |
B² | 0.0025 | 1 | 0.0025 | 25.28 | 0.0015 |
| |
Pore volume | Model | 6.720E-06 | 5 | 1.344E-06 | 8.84 | 0.0062 | Significant |
A-Temperature | 1.855E-06 | 1 | 1.855E-06 | 12.19 | 0.0101 |
| |
B-Particle size | 9.324E-07 | 1 | 9.324E-07 | 6.13 | 0.0425 |
| |
AB | 2.096E-08 | 1 | 2.096E-08 | 0.1378 | 0.7215 |
| |
A² | 3.900E-06 | 1 | 3.900E-06 | 25.64 | 0.0015 |
| |
B² | 7.296E-07 | 1 | 7.296E-07 | 4.80 | 0.0647 |
| |
Pore Size | Model | 0.0004 | 5 | 0.0001 | 10.12 | 0.0042 | significant |
A-Temperature | 0.0001 | 1 | 0.0001 | 8.53 | 0.0223 |
| |
B-Particle size | 0.0001 | 1 | 0.0001 | 13.27 | 0.0083 |
| |
AB | 1.265E-07 | 1 | 1.265E-07 | 0.0152 | 0.9054 |
| |
A² | 0.0002 | 1 | 0.0002 | 28.78 | 0.0010 |
| |
B² | 0.0000 | 1 | 0.0000 | 4.24 | 0.0784 |
|
Table 2: Fit statistics for fixed carbon, carbon, surface area, pore volume, and pore size
Responses | Std. Dev. | Mean | C.V.% | R2 | Adjusted R² | Predicted R² | Adeq Precision |
Fixed carbon | 0.0120 | 8.01 | 0.1500 | 0.9767 | 0.9601 | 0.8205 | 24.2202 |
Carbon | 0.0132 | 8.17 | 0.1620 | 0.9374 | 0.8928 | 0.4125 | 11.5311 |
Surface area | 0.0099 | 12.36 | 0.0803 | 0.9928 | 0.9876 | 0.9428 | 43.0033 |
Pore Volume | 0.0004 | 0.2326 | 0.1677 | 0.8632 | 0.7655 | -0.0777 | 10.0104 |
Pore size | 0.0029 | 1.53 | 0.1885 | 0.8785 | 0.7917 | 0.1848 | 10.9759 |
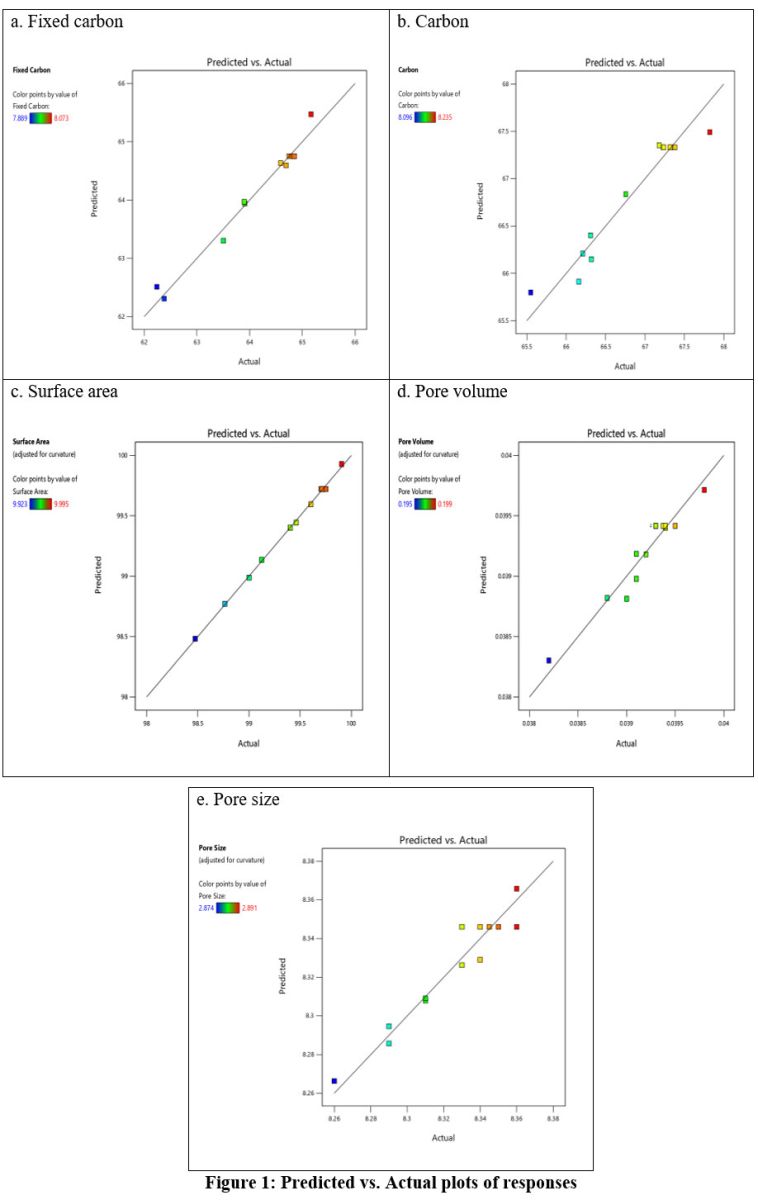 | Figure 1: Predicted vs. Actual plots of responses
|
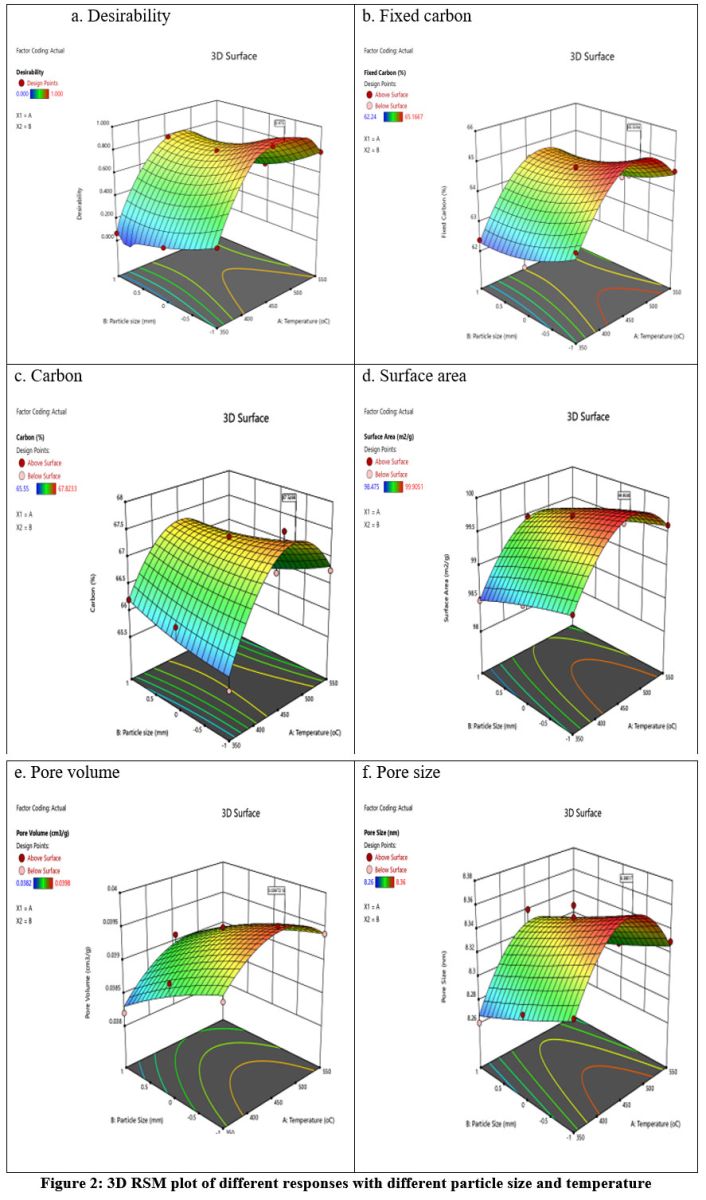 | Figure 2: 3D RSM plot of different responses with different particle size and temperature
|
Biochar yield
Vacuum pyrolysis of C. gigantea at 450 °C yields approximately 31% of biochar. It was quantified by the formula (1).Various researchers have reported that biochar yield is directly related to the temperature and heating rate of the pyrolytic unit and the physiochemical and biological properties of the feedstock. Temperature above 500°C; results in low biochar yield due to the increase in volatilization of organic substances28,29. Among lignocellulosic feedstocks, lignin is responsible for the biochar yield because hemicellulose and cellulose are comparatively more volatile 30, 31. Similar reports of biochar yield have been observed in the work of Gai et al. 32 at 440°-700°C (wheat straw-32.40%, corn straw-35.50% and peanut shell 36.80%); Jindo et al. 33 at 400°C (Wood chips of apple tree-28.3%); and Lian et al. 15 at 450°C (ragweed-33.4%, horseweed- 32.5%). The biochar yield was calculated according to the following “formula 1”.

pH analysis of biochar
The pH of biochar of C. gigantea was 9.9. The increased pH is attributed to the loss of its acidic organic functional groups and the accumulation of alkaline inorganic substances with the increase in pyrolytic temperature34, 35. Lian et al.15 also reported an alkaline pH of 11.2 at a pyrolytic temperature of 450°C in ragweed and horseweed biochar.
Proximate and elemental analyzes of biomass and biochar
The proximate and elemental analyzes of biomass and bio-char are shown in Table 3. The proximate analysis revealed decrease in moisture content and volatile matter in biochar by 55.91% and 73.74%, respectively, whereas an increase in fixed carbon and ash content in biochar by 354.9 and 11.8%, respectively. The decrease in moisture and volatile content in biochar is attributed to the increased temperature; the increase in fixed carbon is due to the carbonization of the feedstock in the pyrolytic unit, and the increased ash is due to the interactions of organic and inorganic compounds by thermal degradation 4, 36. The elemental analysis of biomass and biochar showed an increase in carbon content in biochar by 82.91% and decrease in hydrogen, oxygen, and nitrogen in biochar by 24.8%, 73.59%, and 59.17%, respectively. The presence of high carbon content in biochar makes its applicable for C-sequestration in soil for mitigation of climate change. The molar ratio of hydrogen to organic carbon (H:Corg) and oxygen to carbon (O:C) of biochar were also calculated and were determined to be 0.08 and 0.15, respectively “Table 3”. This ratio reflects the physical-chemical properties of biochar, particularly the degree of aromaticity and maturation, in relation to its stability in the environment 37, 38.
The H/C molar ratio reflects the extent of carbonization because H is primarily associated with the organic matter of raw material2, 39, 40. The O/C molar ratio indicates the extent of polarity and describes the surface hydrophilicity of biochar40. It has been reported by various studies that C-content increases and hydrogen, oxygen, and nitrogen content decreases with increase in pyrolytic temperature2, 7, 10, 41, 42. This results in a decrease in the H/C and O/C molar ratios and shows that there is a higher grade of aromatization due to an increase in the fixed carbon content and major loss of functional groups hydrogen and oxygen43, 44. FTIR analysis and results indicate the same observations in the present study.
Biochar with low H/C ratio and O/C ratios indicates its graphite-like structure, i.e more organized C layers in black carbon or activated carbon, which reveals high stability of biochar, might have a half-life of more than 1000 years, in comparison to raw material (un-carbonized) possessing high H/C and O/C molar ratios37, 45, 46. Biochar with O/C less than 0.2 is most stable with a half-life greater than 1000 years; values between values 0.2 and 0.6 are moderately stable with a half-life of 100 to 1000 years, and values more than 0.6 are relatively unstable with a half-life less than 1000 years47. In the present study, the H/C ratio was 0.08, which is less than 0.2; thus, biochar is highly stable with a shelf life more than 1000 years. Biochar with an H/C ratio less than 0.7 indicates a high degree of aromatacity [greater fused aromatic ring] in comparison to the higher H/C ratio greater than 0.729. The O/C ratio was calculated as 0.15, thus showing increasingly aromatic properties Table 3. The van krevelen diagram describes the changes in the elemental molar ratio with temperature48.
The functional group basically consists of oxygen or hydrogen; thus, the H/C and O/C molar ratios show the presence of a functional group, which increases adsorption on soil and water pollutants4. The decreased ratio with temperature is also associated with the dehydration and decarboxylation reaction and results in a hydrophobic biochar surface14. Thus, for agriculture, lower ratios are preferable because they are more stable due to higher aromatacity, whereas decomposition of raw material biomass in soil is unstable and causes generation of methane gas49. The molar ratio of H/C determined by EDX was highly correlated with the elemental analysis in the present study. Oxygen was calculated using the following “formula 2”

Table 3: Proximate and Elemental Analysis of Biomass and Bio-char
Analysis | Parameters | Biomass [%] | Bio-char [%] |
Proximate Analysis | Moisture | 8.96 | 3.95 |
Volatile | 63.95 | 16.79 | |
Fixed Carbon | 14.21 | 64.65 | |
Ash content | 12.88 | 14.61 | |
Elemental analysis | Carbon | 37.06 | 67.79 |
Hydrogen | 8.113 | 6.097 | |
Oxygen | 38.567 | 10.123 | |
Nitrogen | 3.38 | 1.38 | |
Sulphur | 0.000 | 0.000 | |
H/C | 0.21 | 0.08 | |
O/C | 1.04 | 0.15 | |
N/C | 0.09 | 0.02 |
TGA of the biomass
The thermal decomposition behavior of C. gigantea is shown in Fig 3. The purpose of the TG analysis was to study the feedstock’s pyrolysis mechanism. Woody biomass comprises of three natural polymers: Lignin, cellulose, and hemicellulose50. The thermal degradation of C. gigantea (mass loss vs. temperature) occurred at three different stages. The first stage, the drying stage, occurs from 30 °C to 150°C. In this stage, from the temperature between 30°C and 110°C, unbound moisture from dry woody biomass was liberated, and from temperature 110°C to 150°C, bounded moisture along with some extractives was released 8, 51. Total weight loss was observed in the first stage at about 9%. The second stage is called the active/rapid pyrolysis stage or devolatalization stage. It begins at 150°C, continues to 400°C, and shows maximum heat loss of approximately 83%. This stage involves the emission of non-condensable gasses such as CO, CO2, and tarry gases composed of complex organic compounds. The first peak in this stage observed at 272.79°C indicates hemicellulose degradation, whereas the second peak at 312.21°C indicates cellulose degradation25, 52. Total weight loss in this stage was approximately 83%. The third or final stage, also referred to as the char formation or passive stage, takes place between 400°C and 700°C, with the least weight loss of approximately 4%. Peak 463.17°C shows lignin degradation. Lignin has a higher resistance to degradation than cellulose and hemicellulose53. The TGA curves gradually became stable with increasing temperature, after which the weight loss of the sample remained constant54, 55.
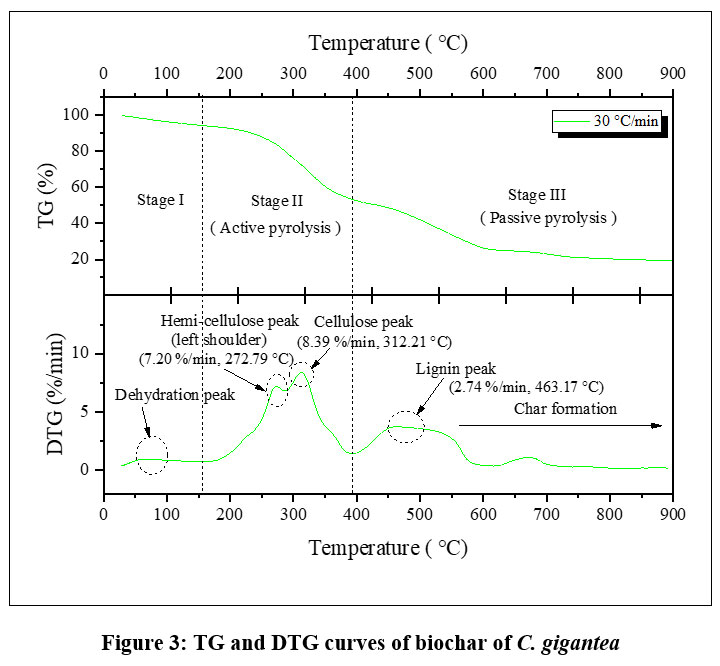 | Figure 3: TG and DTG curves of biochar of C. gigantea
|
BET and SEM/EDX of the biochar
Specific surface area and porosity (pore volume) and pore size distribution of biochar are considered as the most important parameters that play a major role in its application, such as adsorption of organic and inorganic soil and water pollutants and nutrient availability in soil for agriculture25, 56. Specific surface area and pore volume are commonly determined by measurement of physisorption of N2 and/or CO257. The types of raw material feedstock and pyrolysis conditions, mainly temperatures are the key parameters that affect these properties58. Among feedstocks, lignocellulosic biomass is the most potential candidate to attain improved surface area and porosity59. It is expected by Leng et al.60 that the preferable temperature for the development of pore structures is 400°C-700°C. Further low-pressure conditions of vacuum pyrolysis have also been reported to generate more pores (due to release of volatile contents), which increases the surface area61.
In the present study, the surface area, pore diameter, and pore volume of C. gigantea biochar was found as 99.91m2/g, 8.356 nm and 0.0398cm3/g, respectively. Yin et al.62 obtained a surface area of 70 m2/g for the furfural residue biochar derived at 500°C. Corncob biochar obtained at 600°C has a surface area of 56.91 m2/g with a pore volume of 0.027cm3/g63. Lian et al.15 observed increased surface area and pore volume of ragweed, 8.1 to 26.8m2/g and 0.0439-0.610, respectively, with an increase in temperature from 350°C to 450°C. The increase in surface area with an increase in temperature is attributed to the removal of carbon content in the form of volatile matter from the surface of biomass, which develops pores on the surface of biochar 64.
Scanning electron microscopy (SEM) and electron dispersive X-ray analysis (EDX) techniques were used to examine the structure of pores on the surface and the distribution of minerals in the biochar, respectively. The ligno-cellulosic raw material has fibrous and cellular structures, such as trachieds, which form the carbon matter after thermal degradation. With an increase in temperature, the surface morphology of the biochars sophistically changes with the gradual opening of pores on the surface65, 66. Furthermore, pores are also generated due to the decomposition and melting of chemical bonds and the structure of raw biomass 67. Biochar’s pore diameter (size) varies from nanometers to 10 micrometers69. As per the standards of the IUPAC (International Union of Pure and Applied Chemistry) pores are classified into three groups based on the range of diameter (nm) , namely, micropores having diameter less than 2 nm, mesopores having diameter between 2 and 50 nm, and macropores of diameter more than 50 nm8. In the SEM analysis of C. gigantea biochar, well-defined pores were found on the smooth surface. As pore size was found between 2 and 50 nm (8.35 nm), the pores of biochar of the weed C. gigantea are classified as mesoporous (as per IUPAC classification). This is attributed to the volatilization of the organic compound66, 67, 68. By examining the structural appearance of the SEM micrograph, it was found that irregular elliptical pores were arranged in cross-linked forms over the surface Fig. 4. Thus, because of the porous surface of biochar, it can be expected to be used for the adsorption of soil and water pollutants.
EDX analysis reports carbon and oxygen 82.74% and 12.08%, respectively, as major elements of biochar, and traces of mineral fractions such as K-1.33%, Na-1.17%, and Mg-1.05% have also been detected. These results (carbon chain with oxygen) were attributed to the presence of oxygen-containing functional groups such as –COOH and –OH or oxygen-containing mineral particles such as carbonates and phosphates etc.64. Thus, this biochar can be used in soil amendment in agriculture as these nutrients play an important role in plant growth or can be used as an ameliorant for improving degraded soils. Similar findings have also been reported by Sahoo et al.70 for bamboo and pigeon pea stalk biochars at pyrolysis temperatures of 400°C-600°C and Liang et al.66 for saw dust and furfural residue biochar obtained at 300°C-700°C.
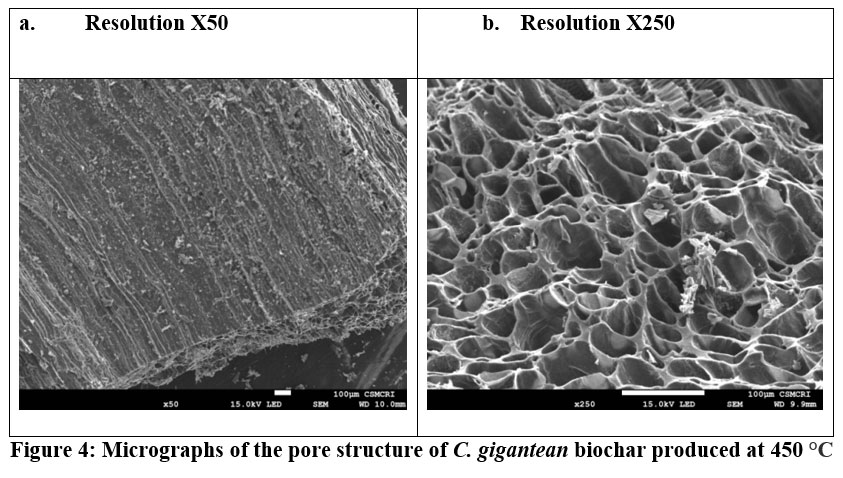 | Figure 4: Micrographs of the pore structure of C. gigantean biochar produced at 450 °C
|
FTIR of the biochar
The spectral bands displayed in the FTIR of C. gigantea biochar are given in “Fig. 5”. A very weak stretch in range 3900 cm-1-3700 cm-1 is observed, which represents the R-OH functional group, which corresponds to the monomeric alcohol, phenols, and carboxylic acid70. No O-H stretching band representing phenol is observed between 3200 cm-1 and 3500 cm-1, which signifies dehydration and cleavage of phenols at 450°C. A very weak band of the aliphatic C-H stretch of hemicellulose shows degradation of the methylene group of hemicellulose. This represents the degradation of hemicellulose and cellulose at temperatures of 200°C-300°C and 300°C-400°C, respectively 70, 71. The spectral peak at 2363 cm-1 indicates adsorption of CO272. Peak 2109.7 cm-1 represents the stretching vibration of C = C triple bond73. Absorbance in range 1500 cm-1 – 2000 cm-1, the weak peaks at 1561.8 cm-1, 1796.6 cm-1, and 1994.1 cm-1, corresponds to C=C (cyclic alkene) aromatic vibration, C=O stretching indicating carboxylic groups and chelated ketones and allenes, i.e., cumulated dienes in which one carbon atom has two double bonds, respectively74. These peaks reflect lignin degradation with increasing heating temperature75. The absorption peak at 1401.5 cm-1 is mainly caused by the stretching vibration of C–O. The presence of –O–C–O– stretching vibration (1300 cm-1-1000 cm-1) showed a small bending at 1110.7 cm-1. It represents symmetrical and asymmetrical aryl alkyl ethers28, 76. In the frequency interval between 700 cm-1 –900 cm-1, the peaks at 872 .2 cm-1 and 745 cm-1, gives information on the aromatic C–H-bending vibrations that symbolize benzene-like rings77, 78. The results are confirmed by the study of Yang et al.79 that oxygen-containing functional groups are formed at lower temperatures whereas aromatic structures are formed at higher temperatures. Lian et al.15 proposed the potential of biochar of invasive weed ragweed and horseweed prepared at 450 °C for the adsorption of Cd(II) and Pb(II) due to the presence of O–containing functional groups and aromatic structures. Thus, from the FTIR results, it is interpreted that due to pyrolysis at 450°C, thermal degradation of hemicellulose and cellulose has occurred whereas some aromatics functional groups related to lignin remain in biochar. There characteristics enable biochar to be a potential source for soil improvement80, 81. Further application of Calotropis biochar could contribute, by cation exchange capacity/complexation/precipitation, to the treatment of soil and wastewater pollutants due to the presence of oxygen-based functional groups and aromatic structures.
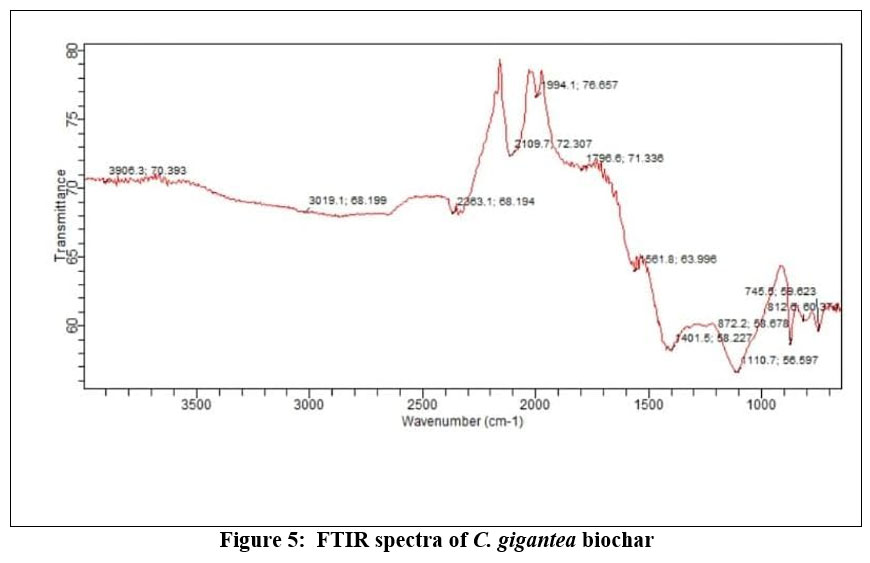 | Figure 5: FTIR spectra of C. gigantea biochar
|
Conclusions
Invasive weed biomass is a promising feedstock for biochar production it is widespread, abundantly available, and has rapid growth. They extensively damage the environment and carry an economic burden relative to their control and disposal. This study reveals that the invasive weed C. gigantea is a potential feedstock for biochar production by vacuum pyrolysis. Response surface method tool was applied for the optimization of the composites for the preparation of good quality biochar with high yield with the main hypothesis that particle size of feedstock (<50mm, 50-100mm, >100mm) and pyrolytic temperature (350oC to 550oC) affect the responses fixed carbon, carbon, surface area, pore volume, and pore size. The model F-value for responses fixed carbon, carbon, surface area, pore volume, and pore size indicates that the model is significant. P-values reported less than 0.0500 for all responses indicate that model terms are significant. Thus, the hypothesis of the present study that particle size and temperature have a significant effect on the selected responses is confirmed. Linear correlation was observed between the predicted and actual plots for the employed model; thus, it is useful for predicting the fixed carbon, carbon, surface area, pore volume, and pore size efficiently. The RSM results analysis revealed that optimized fixed carbon, carbon, surface area, pore volume, and pore size may be found at 472.141°C, which agrees well with the outcomes of the present investigations at 450°C and particle size 50-100 mm. The presence of high carbon content in elemental analysis shows that it can be used for C-sequestration in soil for mitigation of climate change. SEM/EDX analysis reported the well-defined pore structures on biochar’s surface (mesopores). FTIR results reflect the presence of aromatic and O-functional groups. Thus, it can be used for the adsorption of organic and inorganic pollutants (heavy metals) from soil and water. The presence of traces of minerals such as Na, Mg, K, and Ca enhance its applicability in soil improvement and crop productivity. Therefore, it is strongly expected that the invasive weed C. gigantea as a sustainable resource of biochar with vast applicability not only meets the global energy demand but also mitigates the environmental hazards caused by it.
Acknowledgment
Authors are very grateful to the Department of Renewable Energy Engineering, MPUAT, Udaipur, Rajasthan, India for providing the vacuum pyrolyzer and other Laboratory facilities.
Funding Sources
There is no funding or financial support for this research work
Conflict of interest
The authors declare that there are no conflicts of interest.
Authors’ contribution
Conceptualization: Poonam Poonia, Loveena Gaur
Formal analysis: Poonam Poonia
Investigation: Loveena Gaur
Project administration: Loveena Gaur
Software: Loveena Gaur
Supervision: Poonam Poonia
Validation: Poonam Poonia
Visualization: Poonam Poonia, Loveena Gaur
Writing–original draft: loveena Gaur
Writing–review & editing: Poonam Poonia
Data Availability Statement
The manuscript incorporates all datasets examined throughout this research study.
Ethics Approval Statement
The current studies do not need any ethical approvals or informed consent.
References
- Lehmann J., Gaunt J. & Rondon M. Bio-char Sequestration in Terrestrial Ecosystems–A Review. Mitig. Adap. Strateg. Glob. Chang. 2006;11(2):403-427.
CrossRef - Tan X., Liu Y., Zeng G., Wang X., Hu X., Gu Y. & Yang Z. Applications of biochar for the removal of pollutants from aqueous solutions. Chemosphere. 2015;125:70–85.
CrossRef - Zhang H., Chen C., Gray E.M. & Boyd S.E. Effect of feedstock and pyrolysis temperature on properties of biochar governing end use efficacy. biomass bioenergy. 2017;105:136-146.
CrossRef - Venkatesh G., Gopinath K.A., Reddy K.S., Reddy B.S., Prabhakar M., Srinivasarao C., Kumari V.V. & Singh V.K. Characterization of Biochar Derived from Crop Residues for Soil Amendment, Carbon Sequestration and Energy Use. Sustainability 2022;14(4):2295.
CrossRef - Tomczyk A., Sokolowska Z. & Boguta P. Biochar physicochemical properties: pyrolysis temperature and feedstock kind effects. Rev. Environ. Sci. Biotechnol. 2015;19(1):191–215.
CrossRef - Qiu M., Liu L., Ling Q., Cai Y., Yu S., Wang S., Fu D., Hu B. & Wang X. Biochar for the removal of contaminants from soil and water: a review. Biochar. 2022; 4(1):19.
CrossRef - Nartey O.D. & Zhao B. Biochar preparation, characterization, and adsorptive capacity and its effect on bioavailability of contaminants: An Overview. Adv. Mater. Sci. Eng. 2014;14:1-2.
CrossRef - Wang L., Olsen M.N.P., Moni C., Dieguez-Alonso A., de la Rosa M., Stenrød M., Liu X. & Mao L. Comparison of properties of biochar produced from different types of lignocellulosic biomass by slow pyrolysis at 600 °C. Appl. Energy Combust. Sci. 2022;12: 100090.
CrossRef - Nanda S., Dalai A.K, Berruti F. & Kozinski J.A. Biochar as an Exceptional Bioresource for Energy, Agronomy, Carbon Sequestration, Activated Carbon and Specialty Materials. Waste Biomass. Vapor. 2016;7:201–235.
CrossRef - Mary G.S., Sugumaran P., Niveditha S., Ramalakshmi B., Ravichandran P. & Seshadri S. Production, characterization and evaluation of biochar from pod (Pisum sativum), leaf (Brassica oleracea) and peel (Citrus sinensis) wastes. IJROWA. 2016;5:43–53.
CrossRef - Muigai H.H., Bordoloi U., Hussain R., Ravi K., Moholkar V.S. & Kalita P. A comparative study on synthesis and characterization of biochars derived from lignocellulosic biomass for their candidacy in Agronomy and energy applications. Int. J. Energy Res. 2020;45(10):1-17.
CrossRef - Singh B., Singh B.P. & Cowie A.L. Characterisation and evaluation of biochars for their application as a soil amendment. Aust. J. Soil Res. 2010; 48(7):516-525.
CrossRef - Liao R., Gao B. & Fang J. Invasive plants as feedstock for biochar and bioenergy production. Bioresour. Technol. 2013;140:439-442.
CrossRef - Shanmugapriya S., Surendran S., Lee Y.S. & Selvan R.K. Improved surface charge storage properties of Prosopis juliflora (pods) derived onion–like porous carbon through redox-mediated reactions for electric double layer capacitors. Appl. Surf. Sci. 2019;492(30): 896-908.
CrossRef - Lian W., Yang L., Joseph S., Shi W., Bian R., Zheng J., Li L., Shan S. & Pan G. Utilization of biochar produced from invasive plant species to efficiently adsorb Cd (II) and Pb (II). Bioresour. Technol. 2020;317:124011.
CrossRef - Feng Q., Wang B., Chen M., Wu P., Lee X. & Xing Y. Invasive plants as potential sustainable feedstocks for biochar production and multiple applications: A review. Resour. Conserv. Recycl. 2021;164(5):105204.
CrossRef - Reza M.S., Ahmed A., Caesarendra W., Bakar M.S.A., Shams S., Saidur R., Aslfattahi N. and Azad A.K. Acacia holosericea: An Invasive Species for Bio-char, Bio-oil, and Biogas Production. J. Biol. Eng. 2019;6(2):33.
CrossRef - Mudereri B.T., Abdel-Rahman E.M., Dube T., Landmann T., Khan Z., Kimathi E., Owino R. & Niassy S. Multi-source spatial data-based invasion risk modeling of Striga (Strigaasiatica): in Zimbabwe. GIsci. Remote Sens. 2020;57(4):553-571.
CrossRef - Plaza P.I., Speziale K.L. & Lambertucci A. Rubbish dumps as invasive plant epicentres. Biol. Invas. 2018; 20(9):2277-2283.
CrossRef - Yang L., Deng Y., Shu Z., Chen Q., Yang H. & Tan, X. Application of Invasive Plants as Biochar Precursors in the Field of Environment and Energy Storage. Front. Environ. Sci. 2022;10:902-915.
CrossRef - Ashori A. & Bahreini Z. Evaluation of Calotropis gigantean as a Promising Raw Material for Fiber-reinforced Composite. J. Compos. Mater. 2009;43(11):1297-1304.
CrossRef - Ramasamy R., Reddy K.O. & Rajulu A.V. Extraction and Characterization of Calotropis gigantea Bast Fibers as Novel Reinforcement for Composites Materials. J. Nat. Fibr. 2018;15(4):527-538.
CrossRef - Ju Y.M., Oh K.C., Lee K.Y. & Kim D.H. Performance Analysis of a Vacuum Pyrolysis System. J. Biosyst. Eng. 2018;43:14–20.
- Ma Y., Li Y. & Zeng Y. The effects of vacuum pyrolysis conditions on wood biochar monoliths for electrochemical capacitor electrodes. J. Mater. Sci. 2021;156:8588-8599.
CrossRef - Pawar A. & Panwar N.L. A comparative study on morphology, composition, kinetics, thermal behaviour and thermodynamic parameters of Prosopis Juliflora and its biochar derived from vacuum pyrolysis. Bioresour. Technol. Rep. 2022;18:101053.
CrossRef - Sadaka S., Sharara M.A., Ashworth A, Keyser P, Allen F. & Wright A. Characterization of Biochar from Switchgrass Carbonization. Energies. 2014;7:548-567.
CrossRef - Lee, Y., Park, J., Ryu, C., Gang, K.S., Yang, W., Park, Y.K., Jung, J. & Hyun, S. Comparison of biochar properties from biomass residues produced by slow pyrolysis at 500°C. Bioresour. Technol. 2013;148: 196-201.
CrossRef - Tsai W.T., Liu S.C., Chen H.R., Chang Y.M. & Tsai Y.L. Textural and chemical properties of swine-manure-derived biochar pertinent to its potential use as a soil amendment. Chemosphere. 2012;89(2): 198-203.
CrossRef - Tsai W.T., Lin Y.Q. & Huang H.J. Valorization of Rice Husk for the Production of Porous Biochar Materials. Fermentation. 2021; 7:70.
CrossRef - Sugumaran P., Susan V.P., Ravichandran P. & Seshadri S. Production and characterization of activated carbon from banana empty fruit bunch and Delonixregia fruit pod. Int. J. Sustainable Energy Environ. Eng. 2012;3(3): 125–132.
- Basta A.H., Fierro V., El-Saied H. & Celzard A. Effect of rice straws on their derived activated carbons produced by phosphoric acid activation. Biomass Bioenergy. 2011;35:1954–1959.
CrossRef - Gai X., Wang H., Liu J., Zhai L., Liu S., Ren T. & Liu H. Effects of feedstock and pyrolysis temperature on biochar adsorption of ammonium and nitrate. PLoS One. 2014;9(12):1–19.
CrossRef - Jindo K., Mizumoto H., Sawada Y., Sanchez-Monedero M.A. & Sonoki T. Physical and chemical characterization of biochars derived from different agricultural residues. Biogeosci. 2014;11: 6613–6621.
CrossRef - Zhang J., Liu J. & Liu R. Effects of pyrolysis temperature and heating time on biochar obtained from the pyrolysis of straw and lignosulphate. Bioresour. Technol. 2015;17(6): 288-291.
CrossRef - Carolina C.F., Kumara P.S., Saravanana A., Joshibaa G.J. & Naushad M. Efficient techniques for the removal of toxic heavy metals from aquatic environment: A review. J. Environ. Chem. Eng. 2017;5: 2782– 2799.
CrossRef - Enders A., Hanley K., Whitman T., Joseph S. & Lehmann J. Characterization of biochars to evaluate recalcitrance and agronomic performance. Bioresour. Technol. 2012;114: 644-53.
CrossRef - Budai, A., Wang, L., Gronli, M., Strand, L.T., Antal, M.J., Abiven, S., Alonso, A.I., Couce. A.A.A. & Rasse, D.P. Surface properties and chemical composition of corncob and miscanthus biochars: Effects of production temperature and method. J. Agri. Food Chem. 2014; 62(17): 3791-3799.
CrossRef - Schmidt, M.I. & Noack, A.G. Black carbon in soils and sediments: Analysis, distribution, implications, and current challenges. Global Biogeochem.Cycle. 2000;14: 777-794.
CrossRef - Krull E., Baldock J., Skjemstad J. & Smernik N. Characteristics of biochar: organo-chemical properties. In: Lehmann J. & Joseph S., eds. Biochar for environmental management: Science and Technology: London: Earthscan; 2009: pp 1-409.
- Chen X., Chen G., Chen L., Chen Y., Lehmann J., McBride M.B. & Hay A.G, Adsorption of copper and zinc by biochars produced from pyrolysis of hardwood and corn straw in aqueous solution. Bioresour. Technol. 2011;102(19):8877–8884.
CrossRef - Ahmad M., Lee S.S., Dou X., Mohan D., Sung J.K., Yang J.E. & Ok Y.S. Effects of pyrolysis temperature on soybean stover-and peanut shell-derived biochar properties and TCE adsorption in water. Bioresour. Technol. 2012;118: 536–544.
CrossRef - Ippolito J.A., Cui L., Kammann C., Wrage-Monnig N., Jose M., Estavillo J.M., Teresa Fuertes-Mendizabal T., Maria Luz Cayuela M.L., Sigua G., Novak J., Spokas K. & Borchard N. Feedstock choice, pyrolysis temperature and type influence biochar characteristics: a comprehensive meta-data analysis review. Biochar.2020;2(4):421-438.
CrossRef - Hao G.P., Jin Z.N., Sun Q., Zhang X.Q., Zhang J.T. & Lu A.H. Porous carbon nanosheets with precisely tunable thickness and selective CO2 adsorption properties. J. Energ. Environ. Sci. 2013;6(12):3740-3747.
CrossRef - Kim W.K., Shim T., Kim Y.S., Hyun S., Ryu C., Park Y.K. & Jung J. Characterization of cadmium removal from aqeous solution by biochar produced from a giant Miscanthus at different pyrolytic temperature. Bioresour. Technol. 2013;138: 266-270.
CrossRef - Masiello C.A. New directions in black carbon organic geochemistry. Mar. Chem. 2004;92(1–4): 201-213.
CrossRef - Spokas K.A. Review of the stability of biochar in soils: Predictability of O:C molar ratios. Carbon Manag. 2010, 1(2): 289-303.
CrossRef - I.B.I. (International Biochar initiative).Standardized Product Definition and Product Testing Guidelines for Biochar that is used in Soil 2015.
- Li M., Guo L., Zhang Y., Lou Z., Wang Y. & Qian G. Cu(II) removal from aqueous solution by Spartina alterniflora derived biochar. Bioresour. Technol. 2013;141:83-88.
CrossRef - Gondek K., Mierzwa-Hersztek M., Baran A., Szostek M., Pieniazek R., Pieniazek M., Stanek-Tarkowska J. & Noga T. The effect of low-temperature conversion of plant materials on the chemical composition and ecotoxicity of biochars. Waste Biomass Valor. 2017;8:599-609.
CrossRef - Zoghlami A. & Paes G. Lignocellulosic Biomass: Understanding Recalcitrance and Predicting Hydrolysis. Front. Chem. 2019;7:874.
CrossRef - Vaghela D.R., Pawar A. & Sharma D. Effectiveness of Wheat Straw Biochar in Aqueous Zn Removal: Correlation with Biochar Characteristics and Optimization of Process Parameters. Bioenerg Res. 2020;16(1): 457-471.
CrossRef - Mariyam S., Alherbawi M., Rashid N., Al-Ansari T. & McKay G. Bio-Oil Production from Multi-Waste Biomass Co-Pyrolysis Using Analytical Py–GC/MS. Energies. 2022;15(19): 7409.
CrossRef - Brebu M. & Vasile C. Thermal Degradation of Lignin – A Review. Cellulose Chem. Technol. 2010;44(9):353-363.
- Shu Y., Zhang J., Li W., Zhao P., Zhang Q. & Zhou M. Thermogravimetric analysis of the pyrolysis and combustion kinetics of surface dead combustibles in the Daxing’an Mountains. PLoS One. 2021;16(12): e0260790.
CrossRef - Park S., Kim S.J., Oh K.C., Cho L., Jeon Y.K., Lee C. & Kim D. Thermogravimetric analysis-based proximate analysis of agro-byproducts and prediction of calorific value. Energy Rep. 2022;8:12038-12044.
CrossRef - Fu P., Hu S., Xinag J., Sun L., Yang T., Zhang A., Wang Y. & Chen G. Effects of Pyrolysis Temperature on Characteristics of Porosity in Biomass Chars. In: International Conference on Energy and Environment Technology; 2009: pp:109-112.
CrossRef - Kruk, M., Jaroniec, M. & Gadkaree, K.P. Determination of the Specific Surface Area and the Pore Size of Microporous Carbons from Adsorption Potential Distributions. Langmuir, 1999; 15(4): 1442–1448.
CrossRef - Han Y., Kwak D., Choi S.Q., Shin C., Lee Y. & Kim H. Pore Structure Characterization of Shale Using Gas Physisorption: Effect of Chemical Compositions. Minerals. 2017;7:66.
CrossRef - Luo L., Xu C., Chen Z. & Zhang S. Properties of biomass derived biochar: combined effects of operating conditions and biomass types. Bioresour. Technol. 2015;192:83-89.
CrossRef - Leng L., Xiong Q., Yang L., Li H., Zhou Y., Zhang W., Jiang S., Li H. & Huang H. An overview on engineering the surface area and porosity of biochar. Sci. Total Environ. 2021;763:144204.
CrossRef - Chandrasekaran A.K., Subbiah S., Bartocci P., Yang,H. & Fantozzi, F. Carbonization using an Improved Natural Draft Retort Reactor in India: Comparison between the performance of two woody biomasses, Prosopis juliflora and Casuarina equisetifolia. Fuel. 2021;285:119095.
CrossRef - Yin Y., Gao Y. & Li A. Self-activation of biochar from furfural residues by recycled pyrolysis gas. J. Waste Manag. 2018;77:312-32.
CrossRef - Shao J.G., Zhang J.J., Zhang X., Feng Y., Zhang H., Zhang S.H. & Chen H.P. Enhance SO2 adsorption performance of biochar modifed by CO2 activation and amine impregnation. Fuel. 2018;224:138–146.
CrossRef - Elnour A.Y., Alghyamah A.A., Shaikh H.M., Poulose A.M., Al-Zahrani S.M., Anis A. & Al-Wabel M.I. Effect of pyrolysis temperature on biochar microstructural evolution, physicochemical characteristics, and its influence on biochar/ polypropylene composites. J. Appl. Sci. 2019;9(6):1149.
CrossRef - Liang H., Chen L., Liu G. & Zheng H. Surface morphology properties of biochars produced from different feedstocks. In: International Conference on Civil, Transportation and Environment 2016; https://doi.org/10.2991/iccte-16.2016.210
CrossRef - Fu P., Hu S., Xiang J., Sun L., Su S. & Wang J. Evaluation of the porous structure development of chars from pyrolysis of rice straw: Effects of pyrolysis temperature and heating rate. J. Anal. Appl. Pyrolysis. 2012; 98:177-183.
CrossRef - Santos R.V., Mendes M.A.A., Alexandre C., Carrott M.R., Rodrigues A. & Ferreira A.F. Assessment of Biomass and Biochar of Maritime Pine as a Porous Medium for Water Retention in Soils. Energies. 2022;15:5882.
CrossRef - Sheau H., Ying H.L., Wei J.J. & Ping W. Carbonization process of Moso bamboo (Phyllostachys pubescens): charcoal and its governing thermodynamics. J. Anal. Appl. Pyrolysis. 2014;107:9-16.
CrossRef - Hernandez-Beltran J.U., Hernandez-De Lira I.O., Cruz-Santos M.M., Saucedo-Luevanos A., Hernandez-Teran F. & Balagurusamy N. Insight into Pretreatment Methods of Lignocellulosic Biomass to Increase Biogas Yield: Current State, Challenges, and Opportunities. J Appl. Sci. 2019;9:3721.
CrossRef - Sahoo S.S., Vijay V.K., Chandra R. & Kumar, H. Production and characterization of biochar produced from slow pyrolysis of pigeon pea stalk and bamboo. Clean Eng. Technol. 2013;3:100101.
CrossRef - Wang Z., Coa J. & Wang J. Pyrolitic characteristics of pine wood in a slowly heating and gas sweeping fixed-bed reactor. J Anal. Appl. Pyrolysis. 2009;84: 179-184.
CrossRef - Schott J.A., Do-Thanh C.L., Shan W., Puskar N.G., Dai S. & Mahurin S. FTIR investigation of the interfacial properties and mechanisms of CO2 sorption in porous ionic liquids. Green Chem. Eng. 2021;2(4): 392-401.
CrossRef - Claoston N., Samsuri A.W., Ahmad M.H. & Mohd Amran M.S. Effects of pyrolysis temperature on the physicochemical properties of empty fruit bunch and rice husk biochars. Waste Manag. Res. 2014;32: 331-339.
CrossRef - Popescu C.M., Popescu M.C. & Vasile C. Structural analysis of photodegraded lime wood by means of FT–IR and 2D IR correlation spectroscopy. Int. J. Biol. Macromol. 2011;48(4): 667–75.
CrossRef - Garside P. & Wyeth P. Identifcation of cellulosic fibres by FTIR spectroscopy—thread and single fibre analysis by attenuated total reflectance. Study Conserv. 2003;48(4): 269–75.
CrossRef - Garg U.M., Kaur M.P., Garg V.K. & Sud D. Removal of hexavalent chromium from aqueous solution by agricultural waste biomass. J Hazard Mater. 2007;140(1-2): 60-68.
CrossRef - Liu Y., Hu T., Wu Z., Zeng G., Huang D., Shen Y., He X., Lai M. & He Y. Study on biodegradation process of lignin by FTIR and DSC. Environ. Sci. Pollut. Res. 2014;21(24):14004-13.
CrossRef - Fan M., Dai D. & Huang B. Fourier transform infrared spectroscopy for natural fibres. Fourier transform-Materials Anal. 2012;3:45-68.
CrossRef - Yang X., Wan Y., Zheng Y., He F., Yu Z., Huang J., Wang H., Ok Y.S., Jiang Y. & Gao B. Surface functional groups of carbon based adsorbents and their roles in removal of heavy metals from aqeous solutions: A critical review. J Chem. Eng. 2019;366: 608-621.
CrossRef - Nkoh J.N., Baquy M.A., Mia S., Shi R., Kawrah M.A., Mehmood K. & Xu R.A. Critical- systematic review of the interactions of biochar with soil and observable outcomes. Sustainability. 2021;13:13726.
CrossRef - Kalina M., Sovova S., Hajzler J., Kubikova L., Trudicova M., Smilek J. & Enev V. Biochar texture- A parameter influencing physic-chemical properties, morphology and agronomical potential. Agronomy. 2022;12(8):1768.
CrossRef


