Dynamics of Peri-Urban Land Alteration in and Around Siliguri City, India: A Geo-Spatial Study
Subham Roy
*
 and Ranjan Roy
1
Department of Geography and Applied Geography,
University of North Bengal,
Siliguri,
India
http://dx.doi.org/10.12944/CWE.19.1.38
Copy the following to cite this article:
Roy S, Roy R, Dynamics of Peri-Urban Land Alteration in and Around Siliguri City, India: A Geo-Spatial Study. Curr World Environ 2024;19(1). DOI:http://dx.doi.org/10.12944/CWE.19.1.38
Copy the following to cite this URL:
Roy S, Roy R, Dynamics of Peri-Urban Land Alteration in and Around Siliguri City, India: A Geo-Spatial Study. Curr World Environ 2024;19(1).
Download article (pdf) Citation Manager Publish History

Introduction
Urbanization has been the locus of attraction to researchers, planners and scientists in the 21st century. The population of the world is supposed to live in urban space, with an increase of 68% by the year 2050. At the same time, India will add 416 million urban dwellers.1 From 1900 to 1950, growth in Indian cities remained largely within municipal boundaries.2 The outward expansion of the large metro cities has resulted in more frequent and progressive changes in the rural areas. It has been found that land usage and changes in occupation are transforming them into 'peri-urban' areas. Earlier, these locations had already been investigated, especially in relation to their ties to the city's economy and society.3 However, peri-urban land use change and transformation is a field that is lacking in proper investigation. The problem with these kinds of areas is that they can’t be clearly defined on pen paper.4 Conventional rural jurisdiction starts after the administrative boundary of the city. A mixed rural and urban development pattern co-exists around the city, leading to environmental degradation and increased population pressure, which often results in exceeding the carrying capacity of the surrounding areas.5 The most intractable environmental issues, after city administrative boundary, are prevalent in these peri-urban areas.6 The urbanization of previously rural and forested areas, the development of housing, commercial and industrial premises, and other infrastructures is inevitable with the growing demand for lands. The availability of large areas and less polluted outskirts attracts people to settle in the peri-urban spaces. In this process, negative environmental impact is likely to be stressed in the peri-urban areas.7 New settlement development, rotational occupation and high reliance on transport for communication are observed in the peri-urban areas.8,9 Thus, peri-urban areas are the transition zones between city and village that go through rapid changes in terms of land usage and socioeconomic setup with the implementation of new developmental activities.10,11 The study of land alteration through proper investigation of LULC changes in peri-urban area is of utmostimportance. The projection of land use dynamics is essential to consider gain and loss, to understand the role of "from-to", and to capture drivers of change as well as the interplay of people and environment.12, 13, 14 The importance of peri-urban land has significantly increased as a result of urbanization and globalization. There is a requirement of land for assembly plants, office buildings, shopping and manufacturing sites for the expanding middle class housing for the low-wage workers. Peri-urban zones are characterized by clashing unplanned or inadequately planned land use, as plans frequently are not carried out, and there are numerous gaps and overlaps.15, 16 Existing laws and policies are not strictly enforced. Local governments that are fragmented, incompetent, and frequently corrupt dominate how land is used. Due to this, the outskirt areas are characterized by a lack of sustainable land development, nonfunctional industrial zones, pollution of air and water, water scarcity, power cuts, non-treated sewage, waste disposal, crowded, unsafe, and houses without sanitation facilities, diminishing cultivable land.
17 Development in these areas entails forcible land requisitions for new development with little or no environmental compensation.18,19, 20 Firman, in 1997, proposed a new theory for the solution to the rapid progress of land conversion in parts of West Java, Indonesia, primarily from agricultural to industrial and residential purposes, advocating the creation of an extended metropolitan region in Southeast Asian nations.21 In India, the concepts of agrarian-based land development, caste-based land utilization classification have been prominent amd found in Delhi since the colonial period .22, 23, 24 The Concept of bypass urbanization by the construction of highways and airports in Mexico City Kolkata in India, Lagos in Nigeria.25, 26 ‘Plotting urbanism’ in a new theory of peri-urbanism seen in Shenzhen city of China and Istanbul of Turkey, in which individual choices and renting via plot construction based on uncertain and occasionally exploitative housing and land markets.27, 28 All these new classifications of peri-urban form of development have encircled land utilization and development of infrastructure for peri-urban development; the present study has discussed all these important facts in detail for the study area. However, some researchers have attempted to measure the modifications in the use of land and natural cover of land, as well asthe factors responsible for these changes in recent decades. The studies have observedthat human activities have had a substantial impact on the LULC pattern in both urban regions and the surrounding areas.29 The primary causes of urban growth and LULC change have been recognized as rising urban populations. The predominant natural resource available for sustaining human populations is land. However, population growth inevitably results in noticeable alterations to land covers. 30, 31 With an increase in impermeable surfaces in both city centres and peri-urban areas, Indian cities are seeing significant changes in LULC caused by a number of different factors. 32, 33 In A study in the upper Godavari basin, institutional, technological, and economic variables are the majorLULC change drivers; another study shows that socioeconomic, demographic, and proximity factors are the main LULC change drivers in the NCT of Delhi. 34, 35 The fundamental driver of the peri-urban change in Hyderabad was found to be the development of infrastructure and high-tech cities, which were the focus of regional industrial policy. Due to India's 1991 economic reforms, particularly along transportation corridors, LULC changes have been ingrained.36
Study Area
The selected study area is Siliguri city. Since its inception, population has grown at an alarming rate for the study area. Over the past 20 years, Siliguri has grown as a prominent economic centre for North Bengal and North-East India.37 The study area covers parts of Jalpaiguri and the majority of the Darjeeling district.The city municipalcorporation map has been considered in the centre. Thereafter, three theoretical concentric buffers have been drawn from the city centre to the outward periphery.
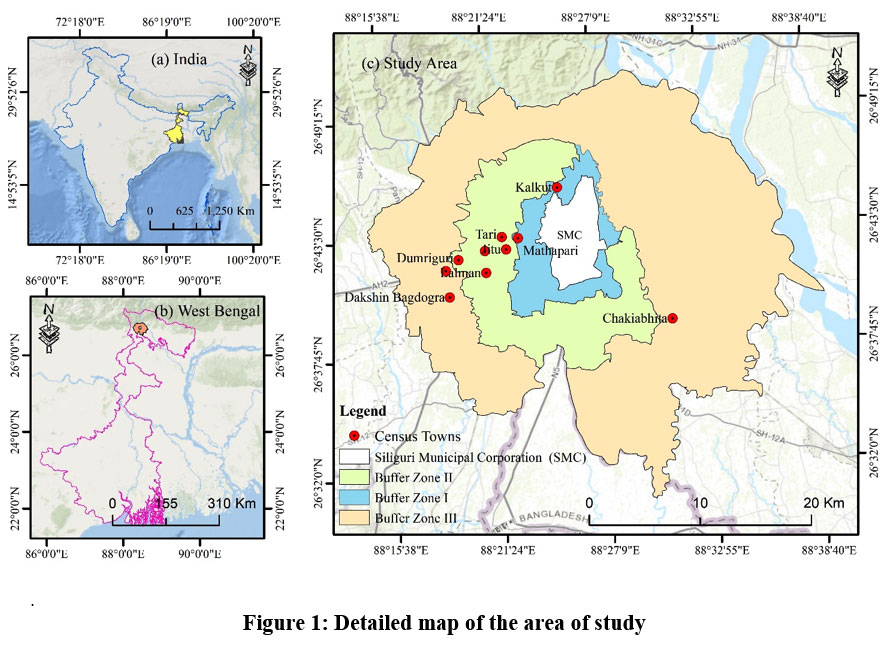 | Figure 1: Detailed map of the area of study.
|
The study area is bounded by international Indo-Bangladesh border in the southern part. Dalkajhar forest, situated westward and Teesta River is in eastward. The total geographical space of the area is 882 sq. km. The national highway (NH 31) runs through Siliguri. Over the lastsix decades, the city's population has grown at a rapidrate, with Siliguribeing the fastest-growing town in West Bengal, growing at a decadal rate of 46%. In the last decade, the construction of multi-storied residential and commercial buildings along Sevoke Road has taken place, as well as organized layouts in the north and west parts have undergone rapid transformation. This is mainly due to intra-city migration from the core city to the peripheral areas. In the last ten years (2001-2011), the city's net population increased by forty-one thousand persons. The city's future growth will depend on the development of infrastructure to support economicactivities. The city is growingat a rapid pace when it comesto economic activities. The residential population is gradually moving towards the outer limits of the city, outside the municipal limits.38, 39 The important drivers of land use change are found to be the rapid built-up expansion, growth of the tea industry, change of occupational patterns, and migration in the city.
Research Question
How have LULC patterns changed in peri-urban areas around Siliguri city over the past decades, and what are the driving forces behind these transformations?
What is the extent of population pressure on land in peri-urban buffer zones, and how does it correlate with the observed land conversion rates?
How does the vegetation health, as indicated by NDVI, vary across different buffer zones surrounding Siliguri city?
What are the spatial patterns of Surface Temperature of Land (LST) in urban peripheral areas, and up to what extent do land conversions contribute to its dynamics?
How do the observed dynamics of peri-urban land alterations align with existing urban development policies and plans, and what adjustments may be needed to ensure sustainable peri-urban development in future?
Materials and Methods
Image Processing
Remotely sensed data of four cloud-less images with projected path/rows 139/41 and 139/42 were collected. The images were then mosaicked under a GIS environment. The raster clipping tool was used to clip the images to getthe desired area. The location map has been prepared using the West Bengal Administrative Atlas Handbook. The study area was then projected under datum WGS-1984, UTM Zone-45 N. Supervised classification technique has been done for preparation of the Land use and cover maps for 1991, 2001, 2011, and 2021.40 In total, seven classes of land cover and land use have been prepared as per the classification scheme shown in Table 2. USGS Earth Explorer was used to download the images and then were imported into ERDAS Imagine 2015 software. The selected bands were overlaid. Mosaicking of the satellite image was done. The most well-known supervised classification technique, maximum likelihood classification (MLC) has been incorporated in the present study. As per the MLC algorithm, a pixel is classified into a class based on the likelihood that it belongs to a specific class, whose mean and covariance are described as constituting a normal distribution in multispectral feature space.41 A total of 395 observations (196 reference totals, 199 classification totals) have been collected for four satellite image classifications. Since image classification is based on the researcher's observation and expertise, Google Earth Pro was assisted with the collection of correct spectral signatures and validation of the supervised images.
Table 1: Overview of the image based satellite data
Satellite Image | Used Sensor | Date of Acquisition | Selected Path and Row | Spatial Resolution |
| Landsat-5 | TM | 1991- | 139/41 | 30 m |
| 02-09 | 139/42 | |||
| Landsat-5 | TM | 2001- | 139/41 | 30 m |
| 01-19 | 139/42 | |||
| Landsat-5 | OLI, | 2011- | 139/41 | 30 m |
| TIRS | 04-21 | 139/42 | ||
| Landsat-9 | OLI, | 2021- | 139/41 | 30 m |
| TIRS | 12-20 | 139/42 |
Table 2: The LULC Classification of NRSC, 2014
| Sl. | Description 1 | Description 2 |
| 1 | Built-up | Urban/Rural |
| 2 | Agriculture | Cropland/ Plantation/ Fallow/ Current Shifting cultivation |
| 3 | Forest | Evergreen / Semi-evergreen/ Deciduous/ Forest Plantation/ Scrub Forest/ Swamp / Mangroves |
| 4 | Grassing | Grass/ Grazing |
| 5 | Barren land/unculturable land/Wasteland | Salt Land/ Gullied / Ravine Land/ Scrub land/ Sandy area/ Rann |
| 6 | Wetland / Water Body | Inland Wetland/ Water bodies/ Rivers / Streams/canals/ |
| 7 | Snowy land |
The data related to population has been taken from the Census of India website. The detailed methodology-based flow chart is explained in Fig.2.
Accuracy Assessment
Accuracy assessment is an essential step for remote sensing-based classification, as classification maps will always contain incorrectly classified pixels and consequently classification failures.42 Accuracy, according to the definition, is the proportion of image pixels that are properly classified. It is also referred to as overall pixel precision.43
Change Detection
The image differencing change detection technique subtracts. The digital value that is present in the pixel in a single date for DN value from another date for the same pixel in the same band. To distinguish between modified and unaffected pixels in each difference image, a standard deviation (SD)-based threshold value is necessary.44 Between 1991 and 2021, a transition matrix representing the associated modifications from one class to a different class was generated (Fig 7).
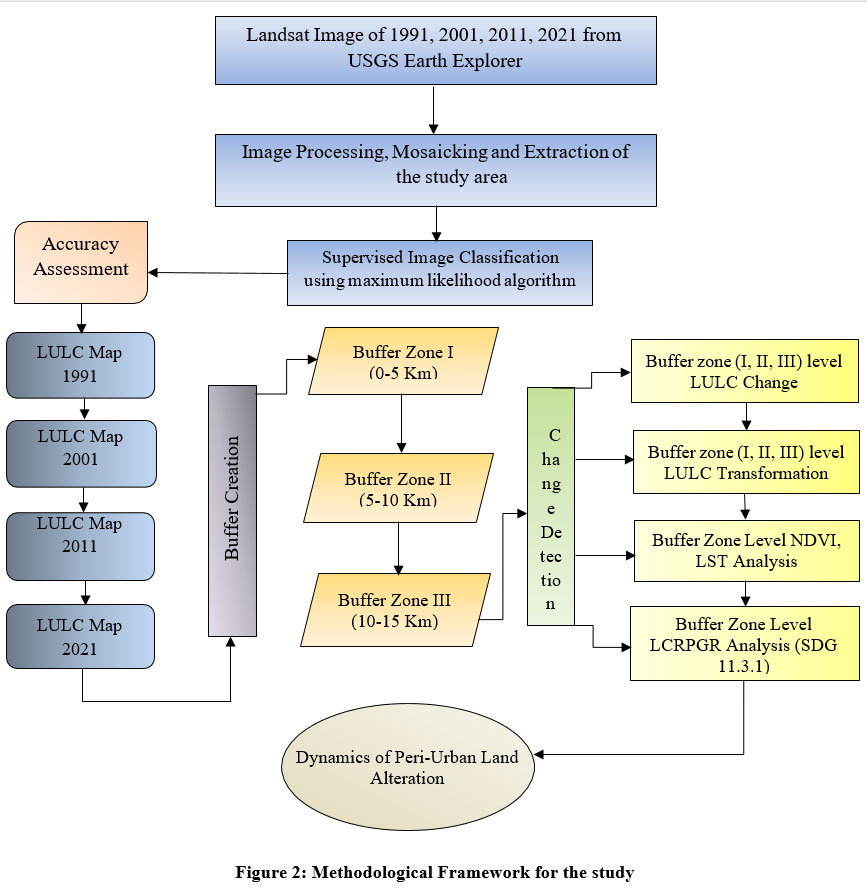 | Figure 2: Methodological Framework for the study
|
Buffer Creation
According to Chang, 2008, the buffer analysis is an important instrument for the investigation of vector data which are created by buffering around polygons.45 He stated that the buffer distance and size are not required to be constant. Again a feature could include several buffer zones. As per his explanations the purpose of buffer creation is that a buffer zone is frequently seen as a protective zone and is used for planning and regulation-related purposes. Chang, 2008, explained that urban expansion is often concentrated near existing metropolitan centres and main roadways. Therefore, future urban expansion management should consequently focus on buffer zones level urban development. A study conducted on impact of LULC on water quality at buffer levels showed how the spatial variation of LULC classes takes place from city core with increase of distance and has significant anomaly in water quality for Lakeside city.46 The results of another study executed on implications of LULC change in the buffer zones of National Park of Rio Abiseo, provided the scientific ways to detect LULC modification and effective management of Protected areas and adjacent ecosystems.47 Urban Heat island due to change in LULC dynamics across south Asia was studied by dividing the study area into rural buffer and urban buffer, findings of the study showed poor ecological condition in urban buffers due to increase of LST and development of urban infrastructure.48 For the present study area, it has been seen that road transport based peri-urban development has resulted in linear settlement expansion. Therefore, to fulfil the aim of in-depth study of nature of the major land alterations, the study area has been divided into three consecutive buffers.The peri-urban areas are dynamic, with cities outward expansion, new building development, change of occupation and conversion of lands. The complexity and ambiguity of this region present substantial management issues for planners and policymakers. Developmental issues in the transitory interface are often more severe and intense than those in urban and rural settings. It has been found in the previous literature that Population distribution is a significant aspect of road network pattern modelling, much as it is also seen in the settlement distribution models.49 The present design of urban roadways was deemed insufficient as inhabitants of urban areas are growing, congestion, and the necessity of interurban movements. Major cities have erected a number of ring roads around them, which have grown to be an essential component of their spatial architecture. The multi-centric character of many cities has been formed by urban development clusters, with highway interchanges in suburban areas serving as significant examples.50 Henceforth, the criterion for buffer selection for the presentstudy is based on arterial road-based settlement concentration stretch. The population of the city increased at a quicker rate, as 7 lakh, which was 4.72 lakh in 2001. The expansion of Siliguri has been tapered due to the presence of Baikunthapur Forest in the eastward and north-eastward part of the city. NH 10 and NH 27 are the main transport lines that extend towards Upper Bagdogra in the western direction; it has resulted in the development of new residential and commercial setups up to this limit. The last settlement cluster, as a continuous stretch, is found in Upper Bagdogra. The calculated distance from the city centre to Upper Bagdogra is around 15 km; thus, a circular buffer of 15 km was divided into three concentric buffers. This buffer layer is stacked under the village boundary map under the GIS environment to finally clip out the study area. The intermediate two buffers have been drawn by dividing buffer three of 15 kmagain into 10 km and 5 km, respectively. The study area comprises 890 sq. km. areal extent. Since Baikunthapur Forest is in the east, the buffer dimensions could be maintained only along the villages located on the western side. This has been due to the unique geographical and administrative location of Siliguri city surroundings.
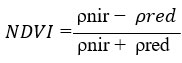
Normalized Difference Vegetation Index
A useful and commonly used remote sensing index is the NDVI.51 The ratio of the TOA reflection of the red band (pred, approximately 0.66 micrometres) to that of a near-infrared (NIR) band (pair, approximately 0.86 micrometres) is used to determine the NDVI. While water and built-up regions will be represented by near zero or negative values, the NDVI of a heavily vegetated area will move towards positive values.52 It is expressed as:
With continuous alteration of land coverage and introduction of urban land foci, i.e. anthropo-surface, global urbanisation has significantly boostedgreenhouse gas emissions and changed the city landscape, which has visible environmental effects across different levels of Land Surface Temperature has been calculated as under.53
Radiance of Top of the Atmospher (TOA)
As per Mardiati et. al, 2022 the LandsatTM equation was used to translate the data integersinto radiance values.54
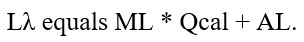
Lh represents TOA spectral radiation (Watts/(m2 * sr * um))
ML = Band multiplicative of radiation (Number).
AL = Additive Band (Number) for Radiance.
Qcal = quantified and calibrated values for standard product pixels (DN).
Top of brightness temperature of the atmosphere (TOA)
The equation below was utilised for converting the spectral radiation to the brightest temperature 55:

BT represents the brightness temperature at the top of the atmosphere in degrees Celsius. Lh = TOA spectral radiance (Watts/m2 * sr * um) K1 = Constant Band (No.)
K2 = Band that is constant (Number)
Normalized Difference Vegetation Index (NDVI)
An established measurement of vegetation, the Index of Normalized Difference Vegetation (NDVI), is measured by the red (Band 4) nearby infrared (Band 5) wavelengths.
Land Surface Temperature
The mean emission of a portion of the Earth's surface is measured as land surface emissivity (LSE), which is derived from NDVI data. According to Mardiati et. al, 2022,
PV equals [(NDVI - NDVI min) / (NDVI maximum + NDVI minimum)]. ^2
Here,
PV = Proportion of Vegetation.
NDVI = the value of DN from the NDVI Image.
NDVI min = Minimum value of DN from the NDVI image. NDVI max = Maximum value of DN from the NDVI image.
E = PV * 0.004 + 0.986
Land Surface Temperature (LST):
Mardiati et. al, 2022 explained the land temperature on the surface (LST) denotes the temperature radiation, denoted based on the degree of brightness temperature at the top of the atmosphere, the wavelength of the radiance that is released, in addition to the land's emissivity.
LST = (BT/1) + W * (BT/14380) * ln(E).
BT represents the brightness temperature at the top of the atmosphere in degrees Celsius. W is the wavelength of the radiation that is emitted.
E = Emissivity of Land Surface
Land Use Efficiency using Land Conversion Rate-Population Growth Rate (LCRPGR)
The SDG 11.3.1 index represents a level two indicator under the SDG indicators program. The index value is expressed in absolute numbers; however, if either the land conversion data or population data is unavailable, it adds to the complexity of this established indicator.56 LCRPGR is the proportion of land rate versus population growth rate for a given time period. The study of LCPGR, hence, is very significant for understanding the stress of population on the land, which is one of the key drivers of land use changes, as mentioned earlier. As per the UN report, the ideal value of LCRPGR is 1. However, values less than one show underutilization of the land resources by the population, and more than 1 signifies overuse of land resources. LCRPGR is calculated using two major data sets, as explained under.57, 58
Population Growth Rate (PGR) = LN (( Population (t + n) /Population (t) )) / Y Population (t) is the total population within the village in 1991; Population (t+n) represents the total population within the village in the year 2011, and Y is the total number of years among the two measurement periods (20 years).
Land Consumption Rate (LCR) = LN Population (t) represents the total population in the village in 1991; Population (t+n) represents the entire population within the village in the year 2011, and Y is the total number of years among the estimation of 20 years. Thus, the formula, determining proportion of land usage to rate of growth of population (LCRPGR) is: An LCR/PGR equals an LCRPGR.
Results
Assessment of major land alteration processes
The spatial alteration, i.e. modification in land use land cover, can be well interpreted using LULC maps and the change detection. The use of land for activities such as agriculture, infrastructural development, recreation, wildlife habitats delineation or any other activity that results from human-environment interaction in a specific site under the impact of socioeconomic dynamics and climatic change processes is known as land use land cover (LULC).59, 60, 61 Peri-urbanization exemplifies a process of land dynamics reversal in the surroundings of the city and changes the land on properties of physical structure. Transformation of green and open spaces into impermeable and both within and beyond of cityscapes is also part of this process.62 Thus, the study of the change with detailed spatial and temporal scaling is essential for sustainable developmental activities of any region. The defined in-depth study has been carried out in this work on a buffer zone basis. The study focused on giving vivid descriptions, Identification and findings based on land alterations at the reconnaissance level.
Spatio-temporal Change of Land Use-Land Cover
Land coverage, interpreted as depiction of the physical and environmental characteristics the surface of the earth, alongside the presence of water bodies, agricultural development, forests, construction activities, etc.63 The use of these available resources in favour of human intention and understanding is considered to be land use.64 The spatiotemporal variation of LULC explains the dynamics of human intervention and socioeconomic development. It has deep relation between environmental adjustment and ecosystem stability, as with rapid change of LULC, the pressure on the natural resources base and directly or indirectly impacts upon the human health.65, 66, 67 Here the NRSC, 2014 LULC classification system has been followed for selection of classes for the supervised classification, as shown in Table 1.68 It has been observed that the urban growth has taken place in a significant manner for the period of last 30 years in the area of study. The percentage of built-up area was 2.51% in 1991 which has increased to 12.10% in 2021, which six times increase. There is minimal increase of water bodies found from4.11% to 4.41%. The forest and agricultural land showed an increment of 2.01% and 3.61%respectively. Tea Gardens have significantly increased with 10% growth. It shows how the economy of the surrounding city is highly dependent on tea manufacturing industries. The barren land is the potential zone for new development activities; in the study area, it has been found that the barren lands have been reduced by 18.13% in the last 30 years (Table 4). It clearly indicates that the new peri-urban development has taken place over the course of time. The study area went through massive changes in the form of new built-up spaces and the conversion of fallow lands and barren lands into quick spaces (Fig 3). Hence, it is necessary to understand the buffer level dynamics of land alterations that have taken place in the surrounding Siliguri City. For this, a total of 196 classification totals have been selected by applying stratified random sampling. The classification as a whole, its accuracy and kappa statistics are 93.00% and 0.91, respectively as shown in Table 3.
 | Figure 3: Land UseLand Cover Changes between 1991-2021
|
Table 3: Accuracy Assessment
| Class Name | Reference Totals | Classification Totals | Number Correct | Producers Accuracy | Users Accuracy |
| Built-up Land | 16 | 17 | 16 | 100% | 0.8889 |
| Water body | 9 | 8 | 7 | 85.42% | 87.50% |
| Forest | 53 | 52 | 52 | 98.53% | 100.00% |
| Tea Garden | 43 | 43 | 39 | 89.94% | 91.40% |
| Agricultural Land | 37 | 39 | 34 | 92.68% | 87.53% |
| Fallow Land | 26 | 27 | 23 | 80.56% | 78.33% |
| Barren Land | 12 | 13 | 11 | 91.67% | 85.42% |
| Total | 196 | 199 | 182 | ||
| Overall Classification Accuracy | 93.00% | ||||
| Overall Kappa Statistics | 0.91 | ||||
Table 4: Land Use Land Cover Changes between 1991-2021.
| Year | LULC Types | |||||||
| Built-up Area | Water Body | Forest | Tea Garden | |||||
Areal Coverage (Km2) | (%) | Areal Coverage (Km2) | (%) | Areal Coverage (Km2) | (%) | Areal Coverage (Km2) | (%) | |
| 1991 | 22.15 | 2.51 | 36.23 | 4.11 | 185.76 | 21.06 | 131.20 | 14.88 |
| 2001 | 36.26 | 4.11 | 32.91 | 3.73 | 206.39 | 23.40 | 243.18 | 27.58 |
| 2011 | 50.35 | 5.71 | 44.15 | 5.01 | 197.11 | 22.35 | 225.48 | 25.57 |
| 2021 | 106.74 | 12.10 | 38.93 | 4.41 | 203.43 | 23.07 | 219.42 | 24.88 |
Contd.
| Year | Agricultural Land | Fallow Land | Barren Land | |||
| Areal Coverage (Km2) | Percentage (%) | Areal Coverage (Km2) | Percentage (%) | Areal Coverage (Km2) | Percentage (%) | |
| 1991 | 211.60 | 23.99 | 249.79 | 28.33 | 45.14 | 5.12 |
| 2001 | 200.86 | 22.78 | 121.95 | 13.83 | 40.30 | 4.57 |
| 2011 | 243.36 | 27.60 | 85.24 | 9.67 | 36.16 | 4.10 |
| 2021 | 186.60 | 21.16 | 89.95 | 10.20 | 36.78 | 4.17 |
Buffer Zone Level LULC Alteration Dynamics
A buffer in a geographical information system (GIS) can be described as the zone surrounding a spatial object, calculated in units of distance or time.69 The zones that surround a specific geographical feature at predetermined distances are known as buffers. Thus, the queries applying the buffers in the study might leverage the overall analysis.70 Purposefully, the Municipal Corporation of Siliguri has been taken out from the study area to evaluate the peri-urban land alterations around the city. Here, the first buffer of 5 km has shown some significant results as the first buffer zone acting as a transition zone which gets the maximum city influence. The most land area expansion is found for built-up land (26.89%), followed by tea gardens (6.69%), water bodies (3.13), and forests (0.12%). However, negative change has been observed for three lulc classes, namely, agricultural land (-22.57%), fallow land (-9.89%), and barren land (-4.38%). The first zone has rightly experienced rapid urban growth and reduction of agricultural practices, and it can be said that people are engaging in activities other than agricultural ones, with relatively more job opportunities near the city (Fig. 4, Table 5).
Table 5: LULC dynamics in the Buffer Zone I
| LULC Class | 1991 | 2021 | |||
| Km2 | % | Km2 | % | Percentage Change | |
| Built-up Land | 2.75 | 4.86 | 17.96 | 31.75 | 26.89 |
| Water body | 1.87 | 3.31 | 3.64 | 6.44 | 3.13 |
| Forest | 0.07 | 0.13 | 0.14 | 0.25 | 0.12 |
| Tea Garden | 6.13 | 10.83 | 9.91 | 17.52 | 6.69 |
| Agricultural Land | 18.74 | 33.14 | 5.98 | 10.57 | -22.57 |
| Fallow Land | 21.79 | 38.53 | 16.2 | 28.64 | -9.89 |
| Barren Land | 5.21 | 9.21 | 2.73 | 4.83 | -4.38 |
The second buffer zone i.e. the intermediate zone extends between 5 to 10 km. An interesting observation for this zone is tea gardens have rapidly increased in this zone along with the built-up land development (Table 6). The percentage increase of tea gardens is highest at 14.79%, followed by built-up land (14.16%). The agricultural land is showing a similar pattern of decrease of spatial extent with a reduction of 21.01%. Besides this, there is minimal positive growth for water bodies (1.87%), forests (0.23%) and negative growth for fallow land (-7.32%) and barren land (-2.72%). Thus, the economyof the second buffer zone has moved towards tea production in the past 30 years. New tea garden development is seen in the southwestern and eastern part of the second zone (Fig. 4)
Table 6: LULC Changes in the Buffer Zone II
| LULC Class | 1991 | 2021 |
Percentage Change | ||
| Km2 | % | Km2 | % | ||
| Built-up Land | 4.57 | 2.76 | 28.01 | 16.92 | 14.16 |
| Water body | 3.07 | 1.86 | 6.17 | 3.73 | 1.87 |
| Forest | 2.30 | 1.39 | 2.68 | 1.62 | 0.23 |
| Tea Garden | 20.24 | 12.23 | 44.71 | 27.02 | 14.79 |
| Agricultural Land | 56.73 | 34.28 | 21.96 | 13.27 | -21.01 |
| Fallow Land | 69.78 | 42.16 | 57.66 | 34.84 | -7.32 |
| Barren Land | 8.80 | 5.32 | 4.31 | 2.6 | -2.72 |
 | Figure 4: Buffer Zone Level Land Alteration in the StudyArea (1991-2021).
|
Table 7: LULC Changesin the Buffer Zone III.
| LULC Class | 1991 | 2021 |
Percentage Change | ||
| Km2 | % | Km2 | % | ||
| Built-up Land | 5.88 | 0.95 | 113.06 | 12.2 | 11.87 |
| Water body | 29.16 | 4.73 | 34.65 | 3.93 | -0.8 |
Forest |
182.65 |
29.3 |
203.19 |
23.4 |
-6.59 |
| Tea Garden | 101.74 | 16.5 | 224.1 | 25.41 | 8.91 |
| Agricultural Land | 128.28 | 20.1 | 88.73 | 10.06 | -10.75 |
| Fallow Land | 139.87 | 22.9 | 186.38 | 21.13 | -1.56 |
| Barren Land | 28.95 | 4.7 | 31.75 | 3.6 | -1.1 |
The thirdbuffer zone extendsbetween ‘10 to 15’ km. The third zone is bounded by the Dalkajhar forest in the southwestern part of the zone, and there is a break of arterialroadside settlement development considered as the last limit of a direct stretch of the city for tertiary peri-urban influence. The built-up land comprises a development of 11.87%, tea garden of 8.91%, whereas other four classes water body (-0.8%), forest (-6.59%), agricultural land (-10.75%), fallow land (-1.56), barren land (-1.1%). It has been found that the destruction of forest cover is highest in the third zone (Table 7). The agricultural land with yellow colour as shown (fig. 4) represents the reduction of the spatial extent. Hence, it needs to be understood how these LULC interclass transformations are taking place. For this reason, buffer zone level areal transformation matrix has been calculated.
Buffer Zone Level Land Transformation Dynamics
The LULC transformation in buffer zone I show that the change of agricultural land (AL) to built-up (BT) land is 11.01%, again conversion of fallow land (FL) to agricultural land is 11.49%, apart from this fallow land to tea garden (TG) conversion accounts of 5.06%, are the major conversion in zone I. The agricultural land and fallow land conversion has been depicted in yellow and orange colour shades in the (fig. 5) zone I. It can be seen the yellow and orange pixels are dominating in the entire zone. For every city and its peri-urban region, the most important type of use of land that has been built up, and the most significant land cover types are water bodies (WB) and barren land (BL) in Fig. 7 the blue line graph shows that all these three classes has been converted to other classes the most in zone I.
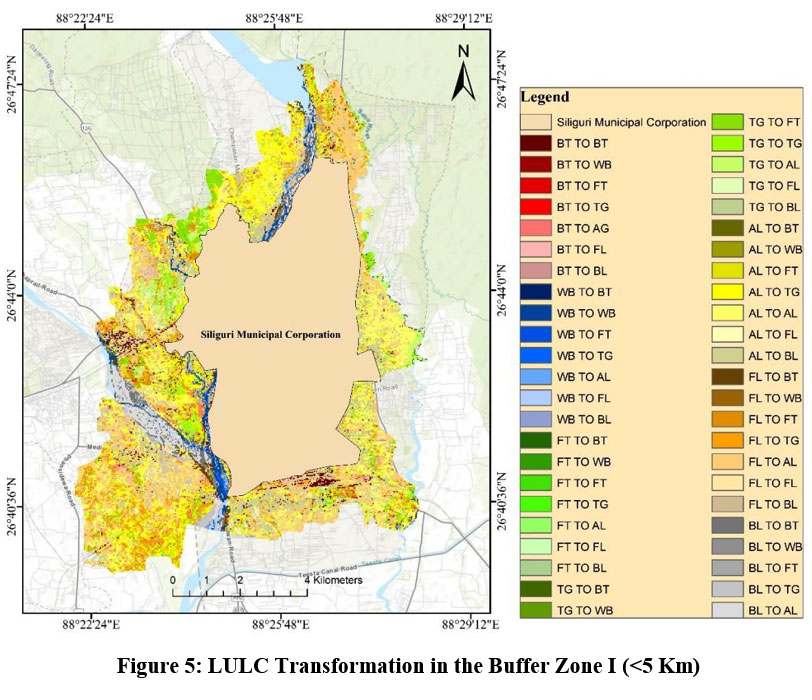 | Figure 5: LULC Transformation in the BufferZone I (<5 Km)
|
The LULC transformation in buffer zone II shows the transformation of tea garden (TG) agricultural land (AL), fallow land (FL) as can be seen in fig. 6. Fallow land accounts for 33.31% transformation, whereas, agricultural land transformation accounts for 34.24%, whereas tea garden covers around 12.25% area. The green, yellow, and orange pixels indicate the tea garden, agricultural land and fallow land conversions (Fig. 6). The conversion of agricultural lands into fallow land shows the seasonal dependence on agriculture and inclusion of varied economic activities, which will thrive economic development for the zone II (fig.8).
Zone III depicts a similar kind of LULC transformation for the last 30 years. Among the seven classes of agricultural land, fallow land, tea garden has been noticeably transformed to other land use classes (Fig. 8). Conversion of agricultural land (AL) into tea garden (TG) is maximum 7.8%; besides, conversion of fallow land (FL) into tea garden and agricultural land is 6.82% and 6.74% respectively. Fallow land, tea gardenand agricultural land conversions can be visualized with the prominence of yellow and grey pixel presence in fig. 7
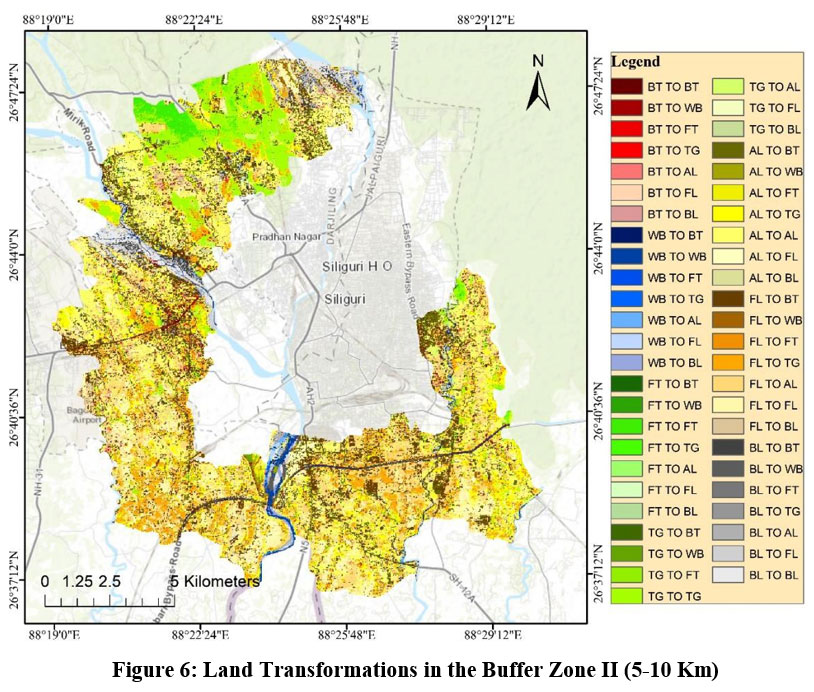 | Figure 6: Land Transformations in the Buffer Zone II (5-10 Km)
|
 | Figure 7: Land Transformations in the BufferZone III (10-15Km)
|
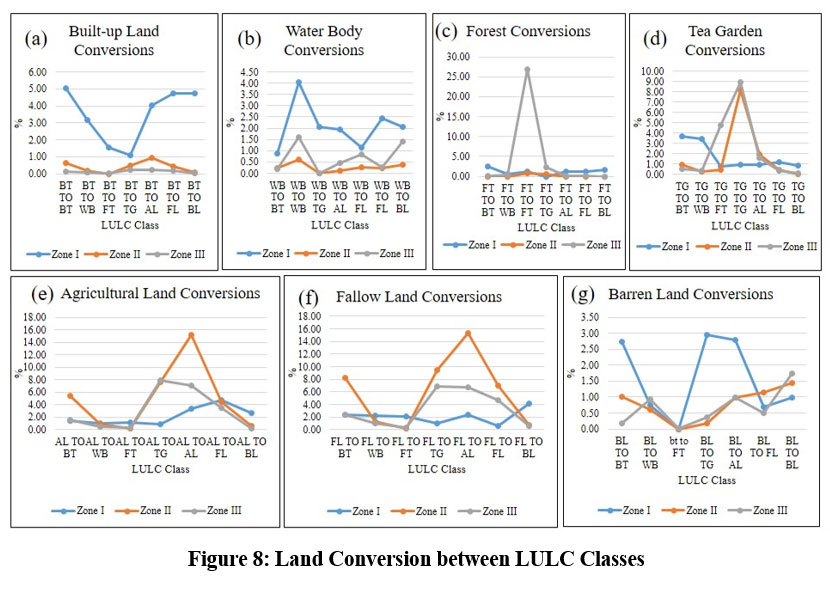 | Figure 8: Land Conversion between LULC Classes
|
Insights from NDVI and LST
Recent studies show how the index of normalized difference vegetation (NDVI) has been applied to explain the modifications in the spatiotemporal properties among different LULC classes.71, 72The land surface temperature (LST) changes have a prominent relationship with changing land use and cover; thus, the associated study of both becomes very relevant.73, 74 There are a number of factors determining the relationship between LST and NDVI, i.e., urbanization, LULC changes, vegetation type, soil type, and water quality.75 The NDVI values vary between +1.0 to -1.0. Exposed sand, gravel, or snowy areas typically have very low values for NDVI (0.1 or less). Sparse vegetation, for example, shrubs and grasslands or senescent crops, can deliver intermediate NDVI values (0.2 to 0.5). Elevated NDVI values (approximately 0.6 to 0.9) represent vegetation that is thick, such as those noticed in forests with temperate dominance and tropical dominance or cereals at the optimum stage of growth.76 The study area consists of a significant proportion of area under forest and tea gardens, so in the thirty years how the alteration of these LULC classes has impacted the vegetation health in the study area is a matter of concern. Here, 1991 and 2021 maps of NDVI and LST (Fig.8, Fig.11) shows varied result among three zones. The first buffer zone has shown a decreased trend of vegetation health with range of NDVI value of 0.67 and 0.82 for 1991 and 2021 respectively (table 8). The second zone shows moderate healthy vegetation with a range of 0.74 in 1991 and 0.75 in 2021. The third buffer is marked with most healthy vegetation due to the presence of Dekhlajhar forest, with values 0.62 in 1991, but in 2021 its quality has decreased to 0.34. On the other hand land surface temperature is recorded highest range of temperature in the third buffer zone with 13.31 and 14.14 for 1991 and 2021 (table 9). The presence of highest forest area and presence of barren land is one of the reasons for this dynamics (Table 7). From the fig.9, it has been found that in 1991, the clipped area in Zone I was covered with thick vegetation. In the later time it was cleared as can be seen from the Google Earth Image (GEI) of 2021. The same place was used for establishment of new township, i.e. Uttorayan. This project was initiated in 2003, completed in 2012. The resultant change of these massive developmental projects in NDVI and LST dynamics is highlighted with red ellipse. The highlighted spots shows increased levels of NDVI and LST, one of the direct cause of this change is definitely identified as the land alteration and clearance of vegetation in this area. In the figure 9.B it is found that the maximum ndvi was as high as 0.44 in 1991, the same place shows (9.E) ndvi value of less than 0.25 i.e. the average value for this clipped area. There is an increment of 1.29°C of the maximum temperature of the land for the clipped area. The highlighted ellipses shows the reduction of green patches for the period of 30 years along the central part of the clipped area and marked increase of surface temperature in the east and south east side as high as 23.67 °C which was as low as 19.73 °C in 1991.
 | Figure 9: Insights from NDVI and LST
|
Table 8: NDVI Dynamics at Buffer Level
| NDVI | 1991 | 2021 | ||||
| Highest | Lowest | Range | Highest | Lowest | Range | |
| Buffer I | 0.57 | -0.12 | 0.69 | 0.38 | -0.44 | 0.82 |
| Buffer II | 0.60 | -0.14 | 0.74 | 0.31 | -0.43 | 0.75 |
| Buffer III | 0.62 | -0.23 | 0.85 | 0.34 | -0.44 | 0.78 |
Table 9: LST Dynamics at Buffer Level
| LST(°C) | 1991 | 2021 | ||||
| Highest | Lowest | Range | Highest | Lowest | Range | |
| Buffer I | 25.4 | 17.48 | 7.92 | 28.76 | 18.39 | 10.37 |
| Buffer II | 24.98 | 17.48 | 7.5 | 28.87 | 16.55 | 12.32 |
| Buffer III | 24.98 | 13.31 | 11.67 | 28.91 | 14.77 | 14.14 |
The result reflects how land alteration has resulted in an increase of surface temperature and decrease of NDVI level in the entire area of study.
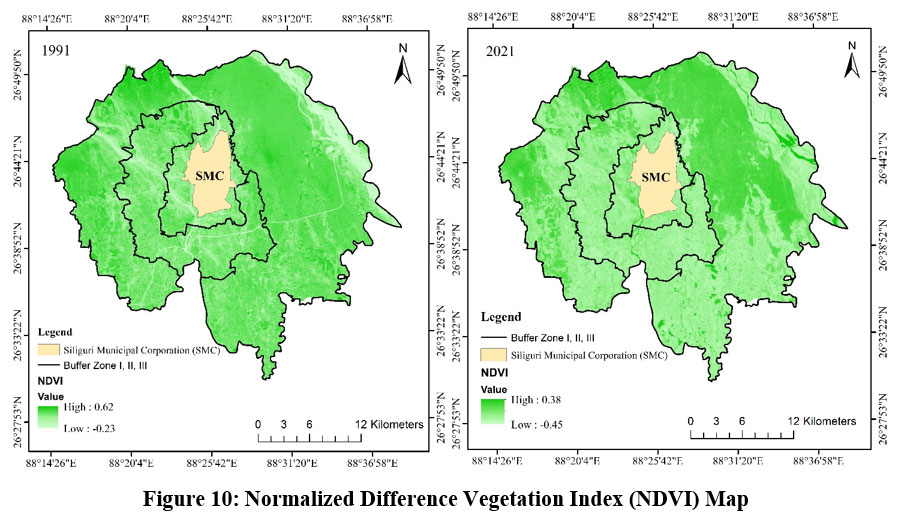 | Figure 10: Normalized Difference Vegetation Index (NDVI) Map.
|
 | Figure11: NDVI Fluctuation Graph for 30 Years (1991-2021)
|
Here, in figure 10, NDVI maps for 1991 and 2021 show that with a decrease in vegetation health, more sparse vegetation has increased, and dense vegetation has decreased. Figure 10 depicts the nature of fluctuation in NDVI values for 30 years, clearly showing a worsened NDVI range with a declining line graph. The maximum value found is 0.62 in 1991 and the minimum value seen as -0.23.
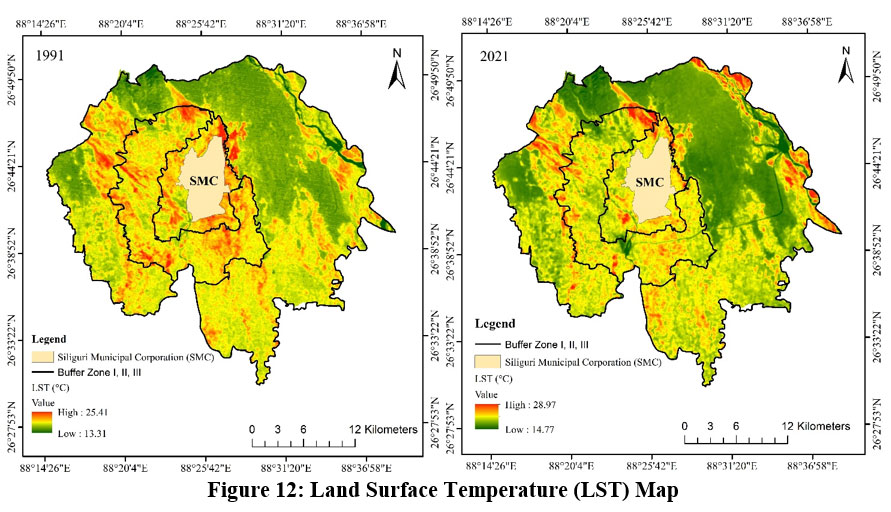 | Figure 12: Land Surface Temperature (LST) Map
|
 | Figure 13: LST Fluctuation Graph for 30 Years (1991-2021)
|
There is a clear trend (Fig. 13) of rise in temperature of the land surface from 1991 to 2021. In 1991 the minimum temperature recorded is 13°C and maximum temperature recorded is 25.40, thus the range of temperature was 12.09°C. In 2021, the lowest land surface temperature recorded is 14.77°C whereas the highest land surface temperature recorded as 28.97°C. Hence, the range of land surface temperature for 2021 is 14.2°C. The assessment revealed about a link between the types of land cover and surface temperature of land, as areas with barren land have shown higher temperatures and with vegetation cover shown relatively low land surface temperature.
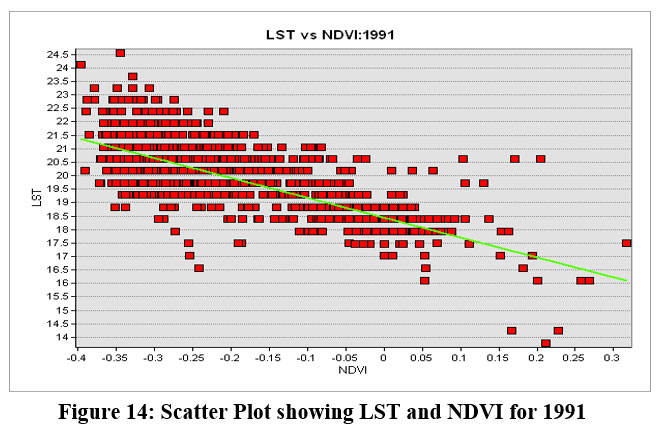 | Figure 14: Scatter Plot showing LST and NDVI for 1991
|
 | Figure 15: Scatter Plot showing LST and NDVI for 2021
|
The scatter graphs presented in figure 14 and 15 shows the Connection between NDVI and LST. The slope of regression lines in the plots shows a negative correlation trend between these two variables, for both the cases. The values have interestingly shifted from north western part of the plot to south eastern part of the plot, more over significant number of index values are above the regression line, showing an increase of surface temperature in the study area.
Examining the proportion of Land Consumption Rate to Population Growth Rate (LCRPGR) of SDG 11.3.1:
An acceptable LCRPGR should be one in a perfect world. A drop in the basline pointing in the direction of an indication Where growth in population and development of land are happening at roughly the same rate over time should be used to track progress in the places where this ratio is higher.77 However, the indicator’s interpretation is dependent on some background factors, i.e. changes in the study region's spatial area and population density. The index has been prepared using the latest census 2011 data for this research. The population pressure in the buffer zones is shown in Fig. 16. It shows gradual yet paced population growth, which is the key reason for the high land conversion rate.
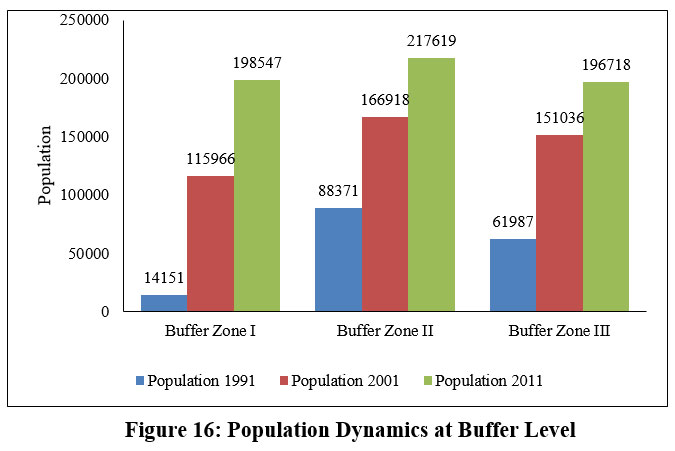 | Figure 16: Population Dynamics at Buffer Level
|
 | Figure 17: Spatio-temporal Change of Built-up Land
|
Table 10: LCRPGR Dynamics
| Geographical Range | LCR (1991- 2011) | PGR (1991- 2011) | LCRPGR |
| Entire Area under Study (Excluding SMC) | 0.29 | 0.09 | 3.22 |
| Zone I (< 5 km) | 0.33 | 0.06 | 5.5 |
| Zone II (5-10 km) | 0.3 | 0.16 | 1.88 |
| Zone III (10-15 km) | 0.26 | 0.11 | 2.36 |
The table 10 shows the zone wise and overall study area status of conversion of land with increase of growth of population.78 Within proximity zones, the LCRPGR’s magnitude modulates. It has been discovered that the first zone is home to the majority of villages with LCRPGR values up to 5.5. The third zone shows an increased value of LCRPGR compared to the second zone. The second zone also resembles highest percentage of tea gardens and agricultural land share. Thus the population pressure is close to 1 which is desirable. The number of villages (more than 5 index value) having the greatest LCRPGR in the first proximity or immediate proximity zone. These areas are having a phenomenal rate of fresh development of land against growth in population between 1991 and 2011 (Fig. 17). The overall LCPGR is also thrice the normal value, thus population pressure on land is unambiguously apparent within the research area, which primarily resulted the land alterations and land use transformations in and around the city.
 | Figure 18: Location of Different Built-up Projects in the Study Area
|
Discussion
In the last three decades, urbanization has been the most salient feature of the study area, as in all three buffer zones, the built-up growth has outreached other LULC classes with 26.89%, 14.16%, and 11.87% of increase, respectively. The agricultural land, fallow land and barren land have witnessed a diminishing trend in all buffers. However, the most decrease is found for agricultural lands with -22.57%, -21.01%, -10.75%, respectively. One of the reasons behind this decrease is the dominance of plantation in the area of study. The second zone showed the maximum increment of 14.79%, 6.69%, followed by 6.69% and 8.91% in the first and third zones. The water body showed the least availability in the third zone with -0.8% change in 30 years, whereas second and first buffers showed 1.87 % and 3.13 %. Water body to fallow land and barren land conversions are maximum in the study area. Some of the driving factors of these changes are high population pressure, urbanization, changing land demands, etc. As per the analysis, the pressure on land is highest in first zone with LCRPGR of 5.5, due to this reason, the land conversion of built up land and barren land is also highest in these two buffer zones (fig.8). The LCRPGR is least for the second zone as 1.88, and rightly the maximum conversions of agricultural land and fallow land is seen in this zone. The third zone comparatively shows moderate LCRPGR of 2.36, with highest forest and tea garden conversions. The buffer zone level NDVI values shows how dense forest with NDVI of 0.57, 0.60 and 0.62 at zone I, II and III respectively has been transformed into sparse vegetation with NDVI of 0.38, 0.31 and 0.34 from 1991 to 2021 respectively. Zone I and II shows a little increase of 0.12% and 0.23 % forest, whereas the third zone, showed a negative change of forest cover of -6.59% . The spatial pattern of LST shows an increase of range of temperature from 7.92°C to 10.37°C in first zone, 7.50°C to 12.32°C in second zone and 11.67°C to 14.14°C in the third zone from 1991-2021. The findings suggests significant change in land cover leading to temperature variability. The first four research questions are discussed, for the fifth research question a perception study was carried out with 30 residents using by simple random sampling using interview method who are living in the city centre as well as the buffer zones. The study revealed that 90% of the people are concerned about the increasing population pressure in the city core, increased pollution and degraded quality of life in the city itself and the importance of alternate new peripheral development around the city to counterbalance the situation. The mayor of Siliguri, Mr. Gautam Dev has already cofirmed that the expansion of the municipal administrative area will be done for better governance. The residents living in Matigara, Shivamndir and Bagdogra demand for separate civic body with the logic that population in these towns are increasing and better governance is the need of the hour. Henceforth, the clear highlights of the rapid development that is taking place in the peripheral urban areas around Siliguri requires the necessity of proper management, utilization and development of the peripheral urban area of Siliguri. The study has depicted the scenario of the land alteration status of the peri-urban region of Siliguri city by dividing it into three consecutive buffer zones. From the analysis of 30 years remotely sensed data, it has been found that rapid and magnanimous urban built up expansion that has taken place, followed by, fallow lands conversion for economic purposes mainly into tea gardens has deteriorated the eco-environmental setting of the city. Moreover, Agricultural lands have greatly been reduced which indicates the changing preferences and occupation of the people in the area of study. The LCRPGR result shows that the first buffer zone of 5km is having maximum pressure of population on land with highest LCRPGR rate. Interestingly, the last zone also shows an increased value of the index which indicates the recent development of small scale urban centers in around the vicinity of the city itself i.e. Shivmandir etc. The growing pressure of population inevitably has led towards the new developments in the study area. The arterial roads which are the lifeline of the city, are one of the major reasons behind cluster of settlement growths. The main roads running are NH 10, NH 27 in the west of the area of study, connecting bagdogra and shivmandir. As also been highlighted in past researches79, it has been found in the present study that after the construction of the new bridge and the enhancement of transportation connectivity, urban expansion has gradually become more autonomous in Siliguri city. This is the reason the third buffer has shown the pockets of new development of urban built-up areas (fig. 18). These longitudinal urban growth along the transport network are another triggering factor of lulc change dynamics. The recent development projects especially in transport sector have led to clearing of forest area all around the arterial roads. As per the news published in ‘The Telegraph Online’, The Road Transport Ministry and Highways has approved development of a broad lane roadway along service lanes from Shivmandir, where Asian Highway II bridging NH 31, to the army cantonment in Sevoke and has approved price of Rs 995.04 crore.80 There is huge concentration of settlements in the first buffer zone. The growing demand of land in around the vicinity of the city has resulted in land use changes. The second buffer zone has been occupied by tea gardens and agricultural lands essentially. Thus, land alteration and conversion has been very slow and as the LCRPGR value rightly shows it has least population pressure on land. Population acts as a major triggering factor for new developments. The third buffer zone showed pocket development of small urban settlements. Thus the first and third zone is major two zones of land transformation. The conversion of the land cover land use classes shows that barren land, fallow land and agricultural land has been greatly converted in these two zones. The concentration of river side built development is seen in first zone of the area under study. The study has depicted how land surface temperature has deep association with vegetation growth of the study region. Except the forest area, the study area showed low to moderate level of vegetation quality, these are all tea gardens. During the time span of 30 years (1991-2021) forest density has reduced and quality of vegetation has decreased as shown in the NDVI maps in different spaces all along the study area (fig. 4,9) .These spaces are marked with high LST, making them unsuitable for agricultural usage (fig.10). The increase of tea gardens from 14.88% (131.20 km2 to 219.42 km2) to 24.88% is greatly shown. It has been found that the area under study has an ever-increasing population, catering to more than half a million population only at the municipal corporation level. As an outcome of the urbanization, the city has seen some major residential township projects- Uttarayan at Matigara, Utshodhara Township, Uttora Township, Aerocity Township (in-progress), Bagdogra (ongoing), Himachal Vihar to name a few (fig.15). These projects are not only focusing on development of the city, but also have given opportunities for outsiders to create a cosmopolitan environment in the city surroundings. The competitive bidding of land value is increasing in the study area. Thus, land alteration is very crucial for the planners and policymakers to ensure a proper utilization of available land resources and spaces in the area of study. The new development, continuous land alteration of the peri-urban areas can become a serious hindrance in long term to achieve the goal of ‘sustainable cities and communities’.81 The study has been executed with the hope that a newly growing concept of the peri-urban dynamism should get government attentions and administration must address the issues of unscientific LULC alterations in order to promote balanced urban development, adequate and equitable municipal services.
Conclusion
Peri-urbanization is the result of city growth within a global socio-political context, and it gives rise to intricate ecosystem interactions. The incidence of urban outward expansion and resultant modification in the usage of land in the urban periphery are closely associated with peri-urban development. Siliguri city, which is considered as the gateway of Noth-East, carries a huge burden of ever-increasing population. With the increasing population, the human footprint on the environment is also rising. For sustainable and eco-environmental stays, people are moving towards the outer peri-urban areas of the city. The newly developed Asian highway has given chance for the daily commuters to stay outside the city core. Thus, constant change of land use dynamics is happening in the study area. A few research have been previously undertaken based on LULC dynamics for the area under study, however, the current investigation is unique in application of buffer to study the LULC dynamics and incorporation of indices that correlates with the results to show the true trend of change and Development of Peripheral urban Land usage in and around Siliguri. The study revealed decadal variation of LULC changes, transformations and conversion of different land use classes, correlation of surface temperature of land and normalized index of vegetation in respect of the LULC changes. Hence, foremost attention is required for proper utilization of the open and barren spaces that are at high prospect of changes due to developmental activities. The policy makers should conserve these open spaces and administer sustainable urban development in future and gentrify illegal occupations if and when required. The green spaces are reducing due to anthropogenic development, therefore social forestry can be adopted for better ecosystem health in the study area. The population land pressure analysis indicated the need for immediate attention at zone 1 of the study area with LCRPGR of 5.5 to manage and control the over-exploitation of the land resources. Economic development and rapid urbanization have resulted in an increased pace of change in land coverage and land usage over the decades. This change will accelerate with time in the area under study. Thus, timely detection of these changes can help the decision-makers and urban planners to formulate sustainable management of the area under study. From the perception study, it was found that there is a growing demand of separate administrative body for the urban centers in buffer zone II and III, this study shows the bare space availability by image classification, hotspot areas of built up and land conversion nature as well as pressure on land. These factors will help authorities to critically analyze the feasibility of these demands. Future studies can be conducted to simulate land usage land coverage and map the trends and amount of change, necessarily at the buffer zone levels marked in the present area under study. The limitations of the present area under study include the population data for 2021 was unavailable due to no census conducted, the incorporation of satellite images of not less than 30 meters resolution to mention a few. Finally, the dynamics of land alteration around peri-urban Siliguri is a testament to the novelty of future introspections at the academic level and may act instrumental in policy-making at the administrative level.
Acknowledgements
We sincerely thank the financial support received by the author (SR) as JRF from, University Grant Commission (UGC). We are tankful to the respondents who helped by giving valuable insights during the perception survey.
Funding Sources
NTA Ref No.:200510325813
Conflict of Interest
The authors declare no conflict of interest.
Data Availability Statement
The manuscript incorporates all datasets produced or examined throughout this research study are available on request from the corresponding author.
Ethics Approval Statement
The study doesn’t involve experiments on human and animals.
Reference
- United Nations.68% of the world population projected to live in urban areasby 2050. Department of Economic and Social Affairs. Published, 2018. https://www.un.org/ development/desa/en/news/population/2018-revision-of-world- urbanization-prospects.html
- Brush, John E. “Spatial Patterns of Population in Indian Cities.” Geographical Review, vol. 58, no. 3, July 1968, p. 362. https://doi.org/10.2307/212563.
- Ramachandran. Urbanisation and Urban Svstemsin India. Oxford University Press, Delhi; 1989.
- Ravetz J, Fertner C, Nielsen TAS. The dynamics of Peri-Urbanization. In: Springer eBooks. ; 2012:13-44. doi:10.1007/978-3-642-30529-0_2
- Shaw. Peri-Urban Interface of IndianCities: Growth, Governance and Local Initiatives. Economic and Political Weekly. 2005;40(2):129-136.
- Simon D. Urban Environments: Issues on the Peri-Urban fringe.Annual Review of Environment and Resources. 2008;33(1):167-185. doi:10.1146/annurev.environ.33.021407.093240
- Winarso H, Hudalah D, Firman T. Peri-urban transformation in the Jakartametropolitan area. Habitat International. 2015;49:221-229. doi:10.1016/j.habitatint.2015.05.024
- Khanani RS, Adugbila EJ, Martínez J, Pfeffer K. The Impact of Road Infrastructure Development Projects on Local Communities in Peri-Urban Areas: the Case of Kisumu, Kenya and Accra, Ghana. International Journalof Community Well-Being. 2020;4(1):33-53. doi:10.1007/s42413-020-00077-4
- Turok I, McGranahan G. Urbanization and economic growth:the arguments and evidence for Africa and Asia. Environment and Urbanization. 2013;25(2):465-482. doi:10.1177/0956247813490908
- Dutta D, Rahman A, Paul SK, Kundu A. Impervious surface growth and its inter- relationship with vegetation cover and land surfacetemperature in peri-urban areas of Delhi. Urban Climate. 2021;37:100799. doi:10.1016/j.uclim.2021.100799
- Kafi KM, Shafri HZM, Shariff ABM. An analysis of LULC change detection using remotely sensed data;A Case study of BauchiCity. IOP Conference Series. 2014;20:012056. doi:10.1088/1755-1315/20/1/012056
- Alipbeki O, Alipbekova C, Sterenharz A, et al. A Spatiotemporal assessment of land use and land cover changes in Peri-Urban areas: a case study of Arshaly District, Kazakhstan. Sustainability. 2020;12(4):1556. doi:10.3390/su12041556
- Mengistu D, Salami AT. Application of remote sensingand GIS inlanduse/land cover mapping and change detection in a part of south western Nigeria. African Journal of Environmental Science and Technology. 2007;1(5):99-109. doi:10.5897/ajest.9000008
- Abramson DB. Urban Planningin China: Continuity and Change: What the futureholds may surprise you. Journal of the American Planning Association. 2006;72(2):197-215. doi:10.1080/01944360608976739
- McGregor DFM, Simon D, Thompson DA. The Peri-Urban Interface: Approaches to Sustainable Natural and Human Resource Use. Routledge; 2006.
- Simon D. Urban Environments: Issues on the Peri-Urban fringe.Annual Review of Environment and Resources. 2008;33(1):167-185. doi:10.1146/annurev.environ.33.021407.093240
- Hsing, Y. The Great Urban Transformation: Politics of Land and Property in China. Oxford university press, 2012.
- Lora?Wainwright A, Zhang Y, Wu Y, Van Rooij B. Learning to Live with Pollution: The Making of Environmental Subjects in a Chinese Industrialized Village. China Journal. 2012;68:106-124. doi:10.1086/666582
- O’Brien KJ, Li L. RightfulResistance in Rural China.; 2006. doi:10.1017/cbo9780511791086
- Zhao F, Sun H, Wu J, Gao Z, Liu R. Analysis of road network pattern considering population distribution and Central BusinessDistrict. PLOS ONE.Published online March 16, 2016. doi:10.1371/journal.pone.0151676
- Firman T. Land Conversion and Urban Development in the Northern Region of West Java, Indonesia. Urban Studies. 1997;34(7):1027-1046. doi:https://doi.org/10.1080/0042098975718
- Balakrishnan, S. (2019). Recombinant urbanization: Agrarian–urban landed property and uneven development in India. International Journal of Urban and Regional Research, 43(4), 617–632. https://doi.org/10.1111/1468-2427.12790
- Balakrishnan, S. (2020). Land transformations along urban corridors in India. University of Pennsylvania Press.Shareholder cities
- Ghosh, S., & Meer, A. (2020). Extended urbanisation and the agrarian question: Convergences, divergences and openings. Urban Studies, 0(0), 0042098020943758. https://doi.org/10.1177/0042098020943758
- Sawyer, L., & Schmid, C. (2015). Bypass urbanism. In D. Architektur (Ed.), Jahrbuch/yearbook 2015 (pp. 213–215). ETH.
- Sawyer, L., Schmid, C., Streule, M., & Kallenberger, P. (2021). Bypass urbanism: Re-ordering center-periphery relations in Kolkata, Lagos and Mexico city. Environment and Planning A: Economy and Space, 53(4), 675–703. https://doi.org/10.1177/0308518X20983818
- Karaman, O., Sawyer, L., Schmid, C., & Wong, K. P. (2020). Plot by plot: Plotting urbanism as an ordinary process of urbanisation. Antipode, 52(4), 1122–1151. https://doi.org/10.1111/anti.12626
- Wu Y, Li S, Yu S. Monitoring urbanexpansion and its effectson land use and land cover changes in Guangzhou city,China. Environmental Monitoring and Assessment. 2015;188(1). doi:10.1007/s10661-015-5069-2
- Rimba AB, Mohan G, Chapagain SK, et al. Impact of population growthand land use and land cover (LULC) changes on water quality in tourism-dependent economies using a geographically weighted regression approach. Environmental Science and Pollution Research. 2021;28(20):25920-25938. doi:10.1007/s11356-020-12285-8
- Abhishek N, Jenamani M, Mahanty B. Urban growth in Indiancities: Are the driving forces really changing? Habitat International. 2017;69:48-57. doi:10.1016/j.habitatint.2017.08.002
- Gupta R. Thepattern of urban land-use changes: A case study of the Indian cities. Environment and Urbanization ASIA. 2014;5(1):83-104. doi:10.1177/0975425314521539
- Duraisamy V, Bendapudi R, Jadhav A. Identifying hotspotsin land use land cover change and the drivers in a semi-arid region of India. Environmental Monitoring and Assessment. 2018;190(9). doi:10.1007/s10661-018-6919-5
- Bansal S, Srivastav SK, Roy PS, Krishnamurthy YVN. An analysisof land use and land cover dynamics and causative drivers in a thickly populated Yamuna River Basin of India. Appl Ecol Environ Res. 2016; 14(3):773–792. doi:10.15666/aeer/1403_773792.
- Kennedy L. Regional industrial policies driving peri-urban dynamics in Hyderabad, India. Cities. 2007;24(2):95-109. doi:10.1016/j.cities.2006.06.001
- Jain M, Dawa D, Mehta R, Dimri AP, Pandit MK. Monitoring land use changeand its drivers in Delhi, India using multi-temporal satellite data. Modeling Earth Systems and Environment. 2016;2(1). doi:10.1007/s40808-016-0075-0
- LeGates R, Hudalah D. Peri-Urban Planningfor Developing East Asia: Learning from Chengdu, China and Yogyakarta/Kartamantul, Indonesia. Journal of Urban Affairs. 2014;36(sup1):334-353. doi:10.1111/juaf.12106
- Basak A. Geographical study on urbanization and associated problemsin North Bengal University. 2018
- Ladda, B., Joshi, R., Banerjee, M., Shrivastava, K. K., Reddy, R., Ghatak, T, Parikh, D. City development plan for Siliguri-2041 by CRISIL risk and infrastructure solutions limited. 2015
- Bhattacharyya DB, Mitra S. Making Siliguri a walkable city. Procedia. 2013; 96:2737– 2744
- Rahman, Atiqur, Shouraseni Sen Roy, and Swapan Talukdar, eds. Advancements in Urban Environmental Studies: Application of Geospatial Technology and Artificial Intelligence in Urban Studies. Springer Nature Switzerland AG, 2023.
- Richards, John A., and John A. Richards. Remote sensing digital image analysis. Vol. 5. Berlin/Heidelberg, Germany: springer, 2022.
- Pour, Amin Beiranvand, et al. "Remote sensing for mineral exploration." Geospatial Analysis Applied to Mineral Exploration. Elsevier, 2023. 17-149.
- Jahromi, Maryam Naghdizadegan, et al. "Accuracy assessment of forest mapping in MODIS land cover dataset using fuzzy set theory." Forest resources resilience and conflicts. Elsevier, 2021. 165-183.
- Afify, Hafez A. "Evaluation of change detection techniques for monitoring land-cover changes: A case study in new Burg El-Arab area." Alexandria engineering journal 50.2 (2011): 187-195.
- Chang, Kang-Tsung. Introduction to geographic information systems. Vol. 4. Boston: McGraw-Hill, 2008.
- Huang W, Mao J, Zhu D, Lin C. Impacts of Land Use and Land Cover on Water Quality at Multiple Buffer-Zone Scales in a Lakeside City. Water. 2020; 12(1):47. https://doi.org/10.3390/w12010047
- Kintz, Damion B., Kenneth R. Young, and Kelley A. Crews-Meyer. "Implications of land use/land cover change in the buffer zone of a national park in the tropical Andes." Environmental Management 38 (2006): 238-252. https://doi.org/10.1007/s00267-005-0147-9
- Hassan T, Zhang J, Prodhan FA, Pangali Sharma TP, Bashir B. Surface Urban Heat Islands Dynamics in Response to LULC and Vegetation across South Asia (2000–2019). Remote Sensing. 2021; 13(16):3177. https://doi.org/10.3390/rs13163177
- Bhandari AK, Kumar A, Singh G. Feature Extraction using Normalized Difference Vegetation Index (NDVI): A Case Study of Jabalpur City. Procedia Technology. 2012;6:612- 621. doi:10.1016/j.protcy.2012.10.074
- Braun, M., & Herold, M. Mapping imperviousness using NDVI and linear spectral unmixing of ASTER data in the Cologne-Bonn region (Germany). Proceedings of SPIE. 2004; Vol. 5239, 274284.
- Rodrigue. The Geography of Transport Systems. 5th Edition. Routledge; 2020.
- Siddique MA, Dong-Yun L, Li P, et al. Assessment and simulation of land use andland cover change impacts on the land surface temperature of Chaoyang District in Beijing, China. PeerJ. 2020;8:e9115. doi:10.7717/peerj.9115
- Anandababu, D., Purushothaman, B. M., & Suresh, B. S. Estimation of land surface temperature using Landsat 8 data. International Journalof Advance Research, 2018; 4(2), 177-186.
- Adam, M. "Definition and boundaries of the peri-urban interface: patterns in the patchwork." Waste composting for urban and peri-urban agriculture: Closing the rural-urban nutrient cycle in sub-Saharan Africa. Wallingford UK: CABI Publishing, 2001. 193-208.
- Mardiati, Dani, Peter Pratistha Utama, and Dessy Apriyanti. "Penggunaan Citra Landsat untuk Pendeteksian Anomali Suhu Permukaan Sebagai Indikasi Keberadaan Manifestasi Panas Bumi. Studi Kasus: Sipoholon, Indonesia." Jurnal Ilmiah Geomatika 2.2 (2022): 1-12.
- Avianto, Praditya. "AMMI Automatic Mangrove Map and Index: Novelty for Efficiently Monitoring Mangrove Changes with the Case Study in Musi Delta, South Sumatra, Indonesia." International Journal of Forestry Research 2022 (2022).
- Cai, Guoyin, et al. "Identification of urban land use efficiency by indicator-SDG 11.3. 1." PloS one 15.12 (2020): e0244318.
- Ling, Ziyan, et al. "Continuous Long Time Series Monitoring of Urban Construction Land in Supporting the SDG 11.3. 1—A Case Study of Nanning, Guangxi, China." Land 12.2 (2023): 452.
- Indicator 11 3 1 Training Module Land Consumption Jan 2019. https://data.unhabitat.org/datasets/875facc5fba84d35b31d139969e54555. Accessed 12 Apr. 2024.
- Rawat JS, Kumar M. Monitoring land use/cover changeusing remote sensingand GIS techniques: A case study of Hawalbagh block, district Almora, Uttarakhand, India. The Egyptian Journal of Remote Sensing and Space Science. 2015;18(1):77-84. doi:10.1016/j.ejrs.2015.02.002
- Prakasam. Land use and land cover change detectionthrough remote sensing approach: A case study of Kodaikanal taluk, Tamil nadu. International Journal of Geomatics and Geosciences. 2010;1(2):150.
- Reis, Selçuk. "Analyzing land use/land cover changes using remote sensing and GIS in Rize, North-East Turkey." Sensors 8.10 (2008): 6188-6202.
- Nuissl H, Siedentop S. Urbanisation and land use change. In: Human-Environment Interactions. ; 2020:75-99. doi:10.1007/978-3-030-50841-8_5
- Turner BL. Local faces,global flows: The role of landuse and land cover in global environmental change. Land Degradation & Development. 1994;5(2):71-78. doi:10.1002/ldr.3400050204
- Nendel C, Hu Y, Lakes T (2018) Land-use change and land degradation on the Mongolian Plateau from 1975 to 2015 – a case study from Xilingol, China. Land Degrad Dev 29(6):1595–1606. https://doi.org/10.1002/ldr.2948
- Vitousek PM, Mooney HA, Lubchenco J, Melillo JM. Human domination of Earth’s ecosystems. Science. 1997;277(5325):494-499. doi:10.1126/science.277.5325.494
- Nor ANM, Corstanje R, Harris JA, Brewer T. Impact of rapid urbanexpansion on green space structure. EcologicalIndicators. 2017;81:274-284. doi:10.1016/j.ecolind.2017.05.031
- NRSC. Land Use / Land Coverdatabase on 1:50,000scale, Natural Resources Census Project, LUCMD, LRUMG, RSAA, National RemoteSensing Centre, ISRO, Hyderabad. 2014
- Sommer, S.; Wade, T. A to Z GIS: An Illustrated Dictionary of Geographic Information Systems; Esri Press: Redlands, CA, USA, 2006; pp. 263–264.
- Liu, Xiaoping, et al. "A new landscape index for quantifying urban expansion using multi-temporal remotely sensed data." Landscape ecology 25 (2010): 671-682.
- Xu L, Li B, Yuan Y, Gao X, Zhang T, Sun Q. Detecting different types of directional land cover changes using MODIS NDVI Time Series dataset. Remote Sensing. 2016;8(6):495. doi:10.3390/rs8060495
- Weng Q. Thermal infraredremote sensing for urban climateand environmental studies: Methods, applications, and trends. Isprs Journal of Photogrammetry and Remote Sensing. 2009;64(4):335-344. doi:10.1016/j.isprsjprs.2009.03.007
- Hidalgo D, Arco J (2022) Modeling the Surface Urban Heat Island (SUHI) to study its relationship with variations in the thermal field and with the indices of land use in the metropolitan area of Granada (Spain). Sustain Cities Soc 87:104166.
- Tepanosyan G, Muradyan V, Hovsepyan A, Pinigin G, Medvedev A, Asmaryan S. Studying spatial-temporal changes and relationship of land cover and surfaceUrban Heat Island derived through remote sensing in Yerevan, Armenia. Building and Environment. 2021;187:107390. doi:10.1016/j.buildenv.2020.107390
- Weng Q, Lu D, Schubring J. Estimation of land surface temperature–vegetation abundance relationship for urban heat island studies. Remote Sensing of Environment. 2004;89(4):467-483. doi:10.1016/j.rse.2003.11.005
- Phenology, Remote Sensing. “NDVI, the Foundation for Remote Sensing Phenology .” REMOTE SENSING PHENOLOGY, USGS, 27 Nov. 2018, https://www.usgs.gov/special-topics/remote-sensing-phenology/science/ndvi-foundation-remote-sensing-phenology#:~:text=NDVI%20values%20range%20from%20%2B1.0,(approximately%200.2%20to%200.5).
- Metadata on SDGs Indicator 11.3.1 Indicator Category: Tier II. https://unhabitat.org/sites/default/files/2020/07/metadata_on_sdg_indicator_11.3.1.pdf
- Sikarwar, Ankit, and Aparajita Chattopadhyay. "Analyzing Major Land Alteration Processes in Peri-Urban Villages." Peri-Urban Dynamics: Geospatial Linkages of Population, Development and Land in Gujarat, India. Cham: Springer International Publishing, 2023. 51-76.
- Sarkar A, Chouhan P. Modeling spatial determinants of urban expansion of Siliguri a metropolitan city of India using logistic regression. Modeling Earth Systems and Environment. 2020;6(4):2317-2331. doi:10.1007/s40808-020-00815-9
- Sinha A. Rs 995 crore sanctioned for Siliguri Road Project: Nitin Gadkari. Nitin Gadkari | Rs 995 crore sanctioned for Siliguri road project: Nitin Gadkari - Telegraph India. March 2022.
- Goal 11 | Department of Economic and Social Affairs. United Nations. Accessed March 30. https://sdgs.un.org/goals/goal11


