Assessment of Plants Sensitivity to Air Pollution using Physiological and Biochemical Parameters
G. Sriram Prasath1
 , M. Alga Celine Rebellow2
, Kannan G1
and A Subramani1
*
, M. Alga Celine Rebellow2
, Kannan G1
and A Subramani1
*
1
Department of Biochemistry Dwaraka Doss Goverdhan Doss,
Vaishnav College Arumbakkam,
Chennai,
Tamil Nadu
India
2
Department of Science and Humanities,
Krishnasamy college of engineering and technology,
Cuddalore,
Tamil Nadu
India
http://dx.doi.org/10.12944/CWE.18.3.07
Copy the following to cite this article:
Prasath G. S, Rebellow M. A. C, Kannan G, Subramani A. Assessment of Plants Sensitivity to Air Pollution using Physiological and Biochemical Parameters. Curr World Environ 2023;18(3). DOI:http://dx.doi.org/10.12944/CWE.18.3.07
Copy the following to cite this URL:
Prasath G. S, Rebellow M. A. C, Kannan G, Subramani A. Assessment of Plants Sensitivity to Air Pollution using Physiological and Biochemical Parameters. Curr World Environ 2023;18(3).
Download article (pdf) Citation Manager Publish History

Introduction
Clean air is essential for the relationship between the environment and public health, but as pollution from many sources is released into the environment, the air quality is deteriorating, which has negative effects on both the climate and human health 1-3. The main causes of air pollution emissions and poor air quality include growing urbanization, rising industrialization, and related anthropogenic activities. Fine dust particles are a major problem today due to their undesirable effects on plants and animals. By capturing particulates and absorbing gaseous pollutants, green belts are a natural way to reduce air pollution 4.
Air pollutants and metals like mercury and lead can be filtered by plants.. Conversely, certain air pollutants have the ability to negatively impact plant development and growth through their effects on the biochemical composition, photosynthetic rate, seed stomata, pedicle length, number of flowers on florescence, and germination. These alterations in biochemical traits are utilized to evaluate the plant's APTI. 5, 6.
More tolerant plant species serve as sinks for airborne pollutants and can be employed to create green belts, whilst more sensitive plant species serve as bioindicators. 7. The development of green belts surrounding urban and industrial areas will be aided by the addition of plants having capacity to withstand air pollution. The chlorophyll level, ascorbic acid, pH, and water content are helpful in calculating the tolerance level. This index has been used in studies on the construction of green belts, traffic noise reduction, and pollution mitigation near roadsides and next to businesses. It has been discovered that plants grown in conditions that appear to be contaminated have higher APTI than plants living in circumstances that appear to be less polluted. This is because various plants react to air pollution in different ways.
In the view of the above context, the leaves of Mangifera indica, Ficus religiosa, Psidium guajava, Annona squamosawere used for the present study The objective is to find out the air pollutant tolerance capacity using Mangifera indica, Ficus religiosa, Psidium guajava, Annona squamosa already grown in polluted and unpolluted site.
Materials and Methods
Leaf sample collection
Fresh leaves from the plants Mangifera indica, Ficus religiosa, Psidium guajava, and Annona squamosa were collected in sterile zip lock coversgathered from polluted sites locations near Adyar and the control site (College Campus-Unpolluted site). How many trees?? how many leaves per tree?
Extract preparation
In accordance with standard protocols, fresh leaves were used. The entire experiment was carried out with aqueous extract.
Biochemical analysis
Evaluation of pH of leaves
1g of leaf sample was homogenized followed by centrifugation. Then supernatant was collected and using a pH meter, the pH was determined.8.
Evaluation of relative water content
Leaves weighing 5g were collected, washed, and weighed. After soaking the leaf samples in water for 24 hours, they were wiped dry and weighed to measure the turgid weight. After drying overnight at 70°C in a hot air oven, the leaves were reweighed. Singh's method for determining and computing RWC was employed.
RWC= ((FW-DW)/(TWDW) x 100
FW stands for fresh weight, DW for dry, and TW for turgid weight.
Estimation of ascorbic acid
Stock ascorbic acid solution
100mg of ascorbic acid is weighed & dissolved in 100ml of distilled water in a standard flask.
Working standard ascorbic acid
10ml of stock was pipetted out in to a measuring flask and made up to 100ml with distilled water in a standard flask.
Sample preparation:
5g of leaves crushed in mortar and pestle. Mix the sample with 50ml of 5% metaphosphoric acetic acid solution, transfer it into a beaker and add 50ml of phosphoric acid solution. Filter using whatmann filter paper
To the filtrate add few drops of bromine water. Then add few drops of thiourea solution to remove excess bromine water
85% H2SO4:
DNPH: 3g of 2,4 DNPH in 15ml of concentrated H2SO, then add 90ml of 74% ethanol.
Procedure
0.5, 1.0, 1.5, 2.0, 2.5 ml of working standard ascorbic acid was pipetted out into tubes labelled as standard from S1-S5. 0.1 ml of extract was pipetted out into tubes labelled as T. With 5% TCA, the volume in each tube reached up to 3 ml. 3 mL of 5% TCA acts as a blank. To each tube, 1.0 ml of DTC reagent was added and thoroughly mixed. The tubes were kept in a water bath for 1 hour at 60° C. The tubes were cooled followed by the addition of 5 ml of 9 N sulphuric acid. The tubes were maintained at room temperature for 20 minutes. The intensity of the colour developed was recorded at 520nm. The amount of ascorbic acid was estimated from the standard graph [9]
Estimation of chlorophyll
Arnon's approach 10 9 was used to calculate the chlorophyll content. 1g of leaves were extracted in 20ml of acetone for 15 minutes. The liquid portion was transferred followed by centrifugation at 2,500rpm. In a normal flask, the contents were made up to 50 ml with 80% acetone. The optical density of chlorophyll a, b was recorded at 645nm and 663nm using a visible spectrophotometer, and the following formula was used to perform the calculations


Total chlorophyll: Chlorophyll a + Chlorophyll b
The air pollution tolerance indices for the selected plants were calculated using the following formula
APTI= (A (T+P) + R)/ 10 is the formula.
Ascorbic acid, T=Total chlorophyll, P=pH of the leaf extract, R=Relative water content of leaf percent).
Estimation of Total Soluble Sugar
Anthrone procedure [1110] was used to calculate the total soluble sugar content of leaf tissue. 20 ml of distilled water along with 1 g of leaf tissue was homogenised. The tubes were then hydrolyzed in a boiling conditon for three hours with 5 cc of 2.5 N hydrochloric acid. The tubes were allowed to cool to ambient temperature. After that, the sample was neutralisedneutralized with sodium carbonate solids. The sample was diluted to 100 mlL and centrifugation was performed. The supernatant was collected, and aliquots of one milliliter were utilized for estimate.
Working standards were prepared in separate tubes with various concentrations of glucose, and the volume of the standards and sample was reduced to 1ml using distilled water. The tubes were then filled with anthrone reagent ( 4 ml) and kept in a warm condition for 8 minutes followed by cooling at normal temperature. The reading was recorded at 630 nm using spectrophotometer. Total soluble sugar concentration in the sample was calculated using the standard graph.
Results and Discussion
Table 1: Chlorophyll content in leaves of Mangifera indica, Ficus religiosa, Psidium guajava, Annona squamosa obtained from unpolluted and polluted sites.
S.No | Botanical name | Chlorophyll a in Unpolluted leaves | Chlorophyll b in Unpolluted leaves | Chlorophyll Total (mg/g) in Unpolluted leaves | Chlorophyll a in Polluted leaves | Chlorophyll b in Polluted leaves | Chlorophyll Total (mg/g) in Polluted leaves |
1 | Mangifera indica | 2.170 | 0.630 | 2.800 | 0.117 | 0.310 | 0.427 |
2 | Ficus religiosa | 0.920 | 0.254 | 1.174 | 0.582 | 0.184 | 0.766 |
3 | Psidium guajava | 1.398 | 0.533 | 1.931 | 0.316 | 0.132 | 0.448 |
4 | Annona squamosa | 0.928 | 0.261 | 1.189 | 0.069 | 0.057 | 0.126 |
Chlorophyll content in leaves of Mangifera indica, Ficus religiosa, Psidium guajava, Annona squamosa collected from unpolluted and polluted sites is shown in table 1.
From results obtained , it is well evident that chlorophyll level varied from 1.18 to 2.8 in unpolluted leaf samples and 0.12 to 0.42 in areas exposed to pollution. It is to be observed that if the pollutant level is high chlorophyll content will get decreased
From the study carried out, Mangifera indica, showed the highest total chlorophyll level of 2.82 mg/g, Psidium guajava 1.9. mg/g while Annona squamosa and Ficus religosa showed the lowest chlorophyll content of 1.18 and 1.17 mg/g in leaves collected from unpolluted sample. The total chlorophyll content in polluted sample was found to be highest in Ficus religosa (0.76mg/g) followed by Psidium guajava (0.44 mg/g) and Mangifera indica (0.42 mg/g), very lowest in Annona squamosa (0.261 mg/g) respectively.
The total chlorophyll content decreased in polluted samples than in unpolluted samples.
The levels of chlorophyll was decreased in samples obtained from polluted areas than in controlled sites. The average chlorophyll content of leaves has been frequently used to assess how air pollution affect the photosynthesis 12 1. It is believed that chlorophyll serves as a measure of biomass output, photosynthetic activity, and growth. According to Kameswaran et al. (2019), Plants with a high chlorophyll content are often resistant to contaminants even after being exposed to traffic pollution. 13 2. This shows that the plant's tolerance to SO2 from vehicular exhaust may be causing lower chlorophyll production or deterioration in the already-present chlorophyll concentration.
Table 2: pH of the leaf extracts of Mangifera indica, Ficus religiosa, Psidium guajava, Annona squamosa
S.No | BOTANICAL NAME | pH (Un polluted leaves) | pH ( Polluted leaves) |
1 | Mangifera indica (Mango) | 6.2 | 5.9 |
2 | Ficus religiosa (Peepal) | 5.8 | 5.6 |
3 | Psidium guajava (Guava) | 5.5 | 5.3 |
4 | Annona squamosa (Custard apple) | 6.6 | 6.1 |
The pH of the plant species collected from unpolluted and polluted site is given in the table 2. The pH of the leaves collected from unpolluted site ranged from 6.6- 5.5 and in polluted samples it was found to between 6.1 to 5.3. The highest pH was observed in A.squamosa (6.6) followed by M.indica (6.2), P.guajava (5.5), in unpolluted leaf samples. There was a moderate decrease in the pH of samples from polluted sites. The pH of A.squamosa from areas exposed to air pollutants was found to be 6.1 followed by followed by M.indica (5.9) , F.religiosa (5.6) and P.guajava (5.3),
According to Escobedo (2008), increased pH favors the production of ascorbic acid from hexose, whereas decreasing pH is assumed to be related to susceptibility to air pollution 14 3-. The pH of leaves decreases when they are exposed to acidic pollutants like SOX and NOX, and this pH decrease is more prominent in sensitive plants compared to tolerant ones 15-16 14-15.
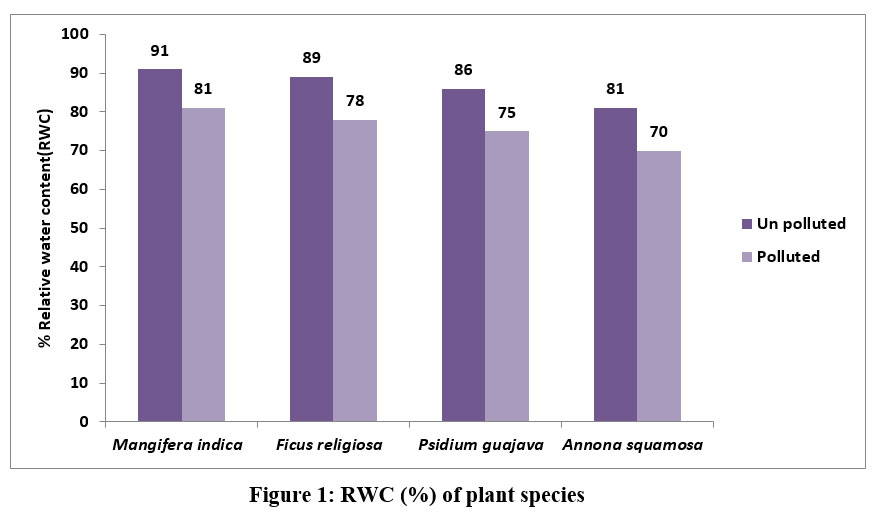 | Figure 1: RWC (%) of plant species.
|
The RWC of the of Mangifera indica, Ficus religiosa, Psidium guajava, Annona squamosa collected from unpolluted and polluted sites is shown in Figure 1
M. indica showed the greatest RWC (91%) followed by F.religiosa by 89% and P.gujava by 86%, A.squamosa by 81% in leaves collected from unpolluted site. In this study it was surprising to note that there was nearly 10% decrease in water content of leaves collected from polluted site.
Under stressful circumstances, plants can maintain their physiological equilibrium thanks to the high relative water content (RWC) in their leaves. Hence, a high RWC number indicates that plants are highly resistant to stress 17 16-. Air pollution has been linked to reduced transpiration rates and damage to leaves that can pull water up from the roots, which prevents plants from bringing in minerals. The rate of transpiration in leaves is affected by the air pollutants with a decrease in relative water content that has been found in some plant species
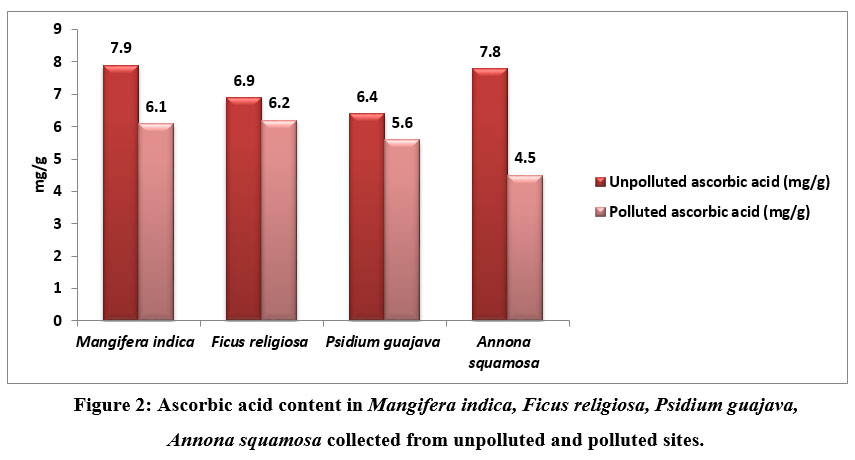 | Figure 2: Ascorbic acid content in Mangifera indica, Ficus religiosa, Psidium guajava, Annona squamosa collected from unpolluted and polluted sites.
|
Ascorbic acid of the leavescollected from unpolluted and polluted sites is shown in figure 2. From this study it was observed that there was slight change in the ascorbic levels of polluted and unpolluted leaves. The ascorbic acid level was found to be 7.9 mg/g in M indica and 7.8 mg/g in A.squamosa and the level was found to be 6.9mg/g in F.religiosa in unpolluted samples. A slight decrease was noted in polluted samples
Apart from synthesizing cell walls, ascorbic acid is essential for cell division, carbon fixation, and functions as a strong antioxidant to protect plants from the damaging effects of free radicals.. Because of this, trees are better able to withstand air pollution. Studies reveal that ascorbic acid can lessen the quantity of ozone that passes through the cell wall and enters the plasma membrane 18-19 17-18. Plant tolerance limits increase as ascorbic acid level increases. As a result, ascorbic acid is required for plants to endure the damage caused by air pollution to their tissues.. [20-21 19-20-]. According to one study, when there is pollution, ascorbic acid levels in plants fall 22 21. However ascorbic acid levels in plants increases if plants withstand pollution 23-24 22-23
Soluble sugar content in leaves of Mangifera indica, Ficus religiosa, Psidium guajava, Annona squamosa from unpolluted and polluted sites is depicted in figure 3. The sugar levels were found to be elevated in all the unpolluted leaf samples when compared to the polluted ones. The amount of Sugar is more in M.indica (24 mg/ g) and least in F.religiosa (21 mg/g) in Unpolluted leaves and in polluted leaves M.indica (20 mg/ g) and least in A.squamosa sp (17 mg/g).
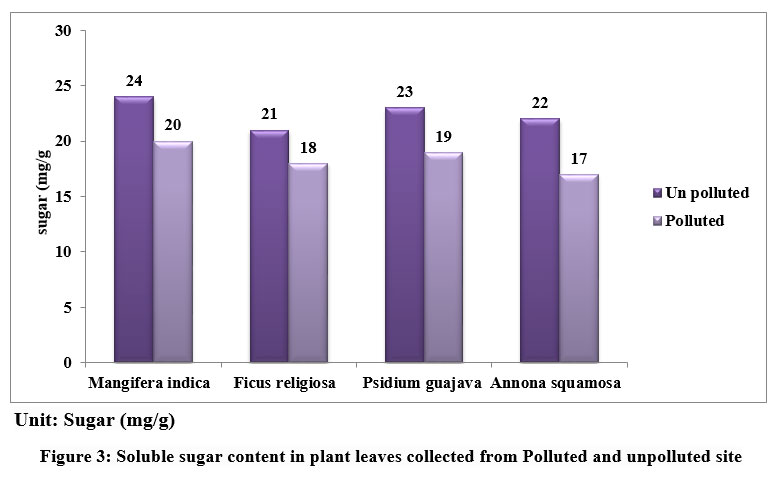 | Figure 3: Soluble sugar content in plant leaves collected from Polluted and unpolluted site.
|
Starch is the end result of photosynthesis and is composed of glucose. In higher plants, sugar serves as both the primary result of photosynthetic energy production and the primary metabolic pathway for carbohydrates. It is believed that the amount of soluble sugar in a plant indicates its physiological activity and its susceptibility to air pollution. Polluted leaves may have less sugar because of decreased photosynthesis brought on by lower pH, less chlorophyll, and less CO2 fixation. APTI showed variations among the various plants obtained from polluted and unpolluted areas. The APTI of plant species were represented in fig 4.
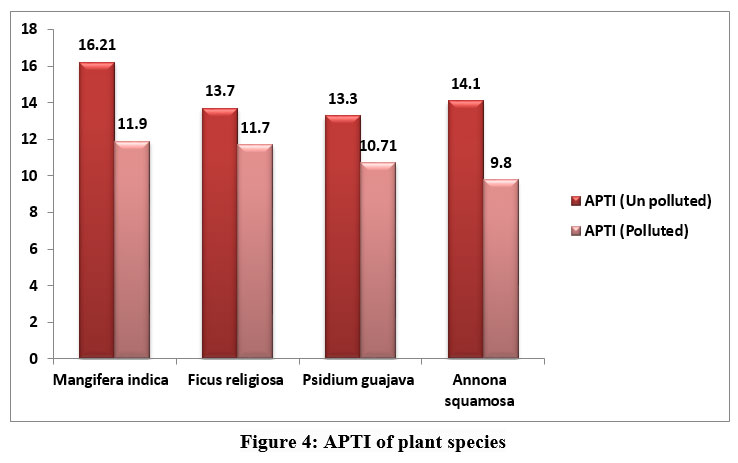 | Figure 4: APTI of plant species
|
The APTI values were in the order M.indica (16.21) > A.squamosa (14.1) > F.religiosa (13.7) > P.guajava (13.3) in unpolluted leaves and in polluted leaves APTI values were 9.8 for A.squamosa, 10.7 for Psidium gujava, 11.7 and 11.9 for F. religiosa and M.indica respectively.
The APTI values provide a reliable way to assess the tolerance and vulnerability of any location's flora to automobile pollution. Plants with APTI values between 12 and 16 are categorised as intermediate, while those with APTI values between 11 and 17 are known to be tolerant.
Conclusion
Plants serve as living filters to reduce air pollution and are a major component in enhancing the green belt. From this study it can be concluded that planting plants like Mangifera indica, Psidium guajava, Annona squamosa, Ficus religosa in urban areas can reduce air pollution. Less than 11 for the APTI value indicates sensitivity; values between 12 and 16 indicate moderate tolerance; values over 17 indicate high tolerance. It is shown that M. indica is extremely tolerant. Also, the other plants used in the study are found to be intermittently tolerant.Thus, attention is needed to promote and develop green belt zones in polluted areas using these type of plants.
Acknowledgements
The authors wish to thank the department and management of Dwaraka Doss Goverdhan Doss Vaishnav College for having provided the necessary chemicals to carry out this project work successfully. .
Conflict of Interest
There is no conflict of interest
Funding Sources
There is no funding or financial support for this research work
References
- Kampa M, Castanas E. Human health effects of air pollution. Environ. Pollut. 2008;151, 362–367.
CrossRef - George MP, Kaur BJ, Sharma A, Mishra S. Seasonal variation of air pollutants of Delhi and its health effects. NeBIO J. Environ. Biodivers. 2013; 4, 42–46.
- Singh P., Saini R., Taneja A. Physicochemical characteristics of PM2.5: Low, middle, and high-income group homes in Agra, India-a case study. Atmos. Pollut. Res. 2014, 25, 352–360.
CrossRef - Godhia M. L., Naik N. Altered Lipid Responses to Dietary Interventions in Obesity. Curr Res Nutr Food Sci Jour. 2015; 3(1):01-11
CrossRef - Brands C. M., Alink G. M. Van Boekel M. A. and Jongen W. M. Mutagenicity of heated sugar? casein systems: Effect of the Maillard reaction. Journal of Agricultural and Food Chemistry. 2000; 48(6): 2271-2275.
CrossRef - Hamraz H., Sadeghi-Niaraki A., Omati M., Noori N. GIS-based air pollution monitoring using static stations and mobile sensor in Tehran/Iran. Int. J. Sci. Res. Environ. Sci. 2014; 2, 435.
CrossRef - Nayak. Dileswar & Patel, Dhiraj & Thakare, Harish & Satashiya, K & Shrivastava, Prashant. Evaluation of air pollution tolerance index of trees. 8. 7-10. Res. Environ. 2015; 8 (1): 7-10
- Leghari, Saadullah & Asrar, Mudassir & Ahmed, M., & Nazim, Kanwal. Air pollution tolerance index (Apti) of various plant species growing in quetta city, Pakistan. Fuuast J. Biol. 2011;1:81-86.
- Rai K., Panda L.L., Dust capturing potential and air pollution tolerance index (APTI) of some roadside tree vegetation in Aizawl, Mizoram, India: An Indo-Burma hot spot region. Air Qual. Atmos. Health 2014; (7):93–101
CrossRef - Singh S.K., Rao D.N. Evaluation of plants for their tolerance to air pollution,In:Proceedings Symposium on Air Pollution Control,Indian Association for Air Pollution Control,New Delhi, India,1,1983,218-224.
- Roe, J.H., and Kuether, C.A. 1943. The determination of ascorbic acid in whole blood and urine through the 2,4-dinitrophenylhydrazine derivative of dehydroascorbic acid. J. Biol. Chem. 147:399-407.
CrossRef - Arnon, D.I. Copper enzymes in isolated chloroplasts. Polyphenoloxidase in Beta vulgaris. Plant Physiol. 1949; 24: 1-15.
CrossRef - Ludwig T.G., Goldberg G.V. The anthrone method for the determination of carbohydrates in foods and in oral rinsing, J Dent Res. 1953;35(1):90-4
CrossRef - Sharma A.P., Tripathi B.D., Biochemical response in tree foliage exposed to coal-fired power plant emission in seasonally dry tropical environment. Environ. Monit. Assess, 2009; 158:197–212.
CrossRef - Kameswaran S., Gunavathi Y., Krishna, P.G. Dust pollution and its infl uence on vegetation–a critical analysis, Research journal of Life sciences, Bioinformatics, Pharmaceutical and Chemical sciences, 2019; 5(1):341-363
- Escobedo F.J., Wagner J.E., Nowak D.J., et al. Analyzing the cost effectiveness of Santiago, Chile’s policy of using urban forests to improve air quality, Journal of Environmental Management, 2008; 86: 148-15
CrossRef - Bharti, Sushil Kumar, Arti Trivedi, and Narendra Kumar. Air pollution tolerance index of plants growing near an industrial site. Urban climate. 2018; 24:820-829.
CrossRef - Rathore, D. S., Kain, T., Gothalkar, P. (2018). A study of air pollution status by estimation of APTI of certain plant species around Pratapnagar circle in Udaipur city. International Journal of Agriculture, Environment and Biotechnology, 11(1), 33-38
- Aghaiee N., Zarei L., Cheghamirza, K. Evaluation of some morpho-physiological characteristics in strawberry under different moisture stress regimes. Journal of Berry Research, 2019; (Preprint), 1-11
CrossRef - Bellini E., De Tullio M.C., Ascorbic acid and ozone: Novel perspectives to explain an elusive relationship. Plants. 2019; 8(5):122
CrossRef - Roshchina V.V., Roshchina V.D. Ozone and Plant Cell. Springer Science & Business Media.2013
- Pasqualini S., Batini P,. Ederli L. et al. Effects of shortterm ozone fumigation on tobacco plants: response of the scavenging system and expression of the glutathione reductase, Plant Cell Environment, 2001; 24:245-25
CrossRef - Wheeler G., Ishikawa T., Pornsaksit V., Smirnoff N. (2015) Evolution of alternative biosynthetic pathways for vitamin C following plastid acquisition in photosynthetic eukaryotes. eLife 4:e06369
CrossRef - Keller T., and Schwager H. (1977). Air pollution and ascorbic acid. European Journal of Forest pathology. 7:338-350
CrossRef - Singh SK., Rao D.N., Agrawal M., Pandey J., and Narayan D. Air Pollution Tolerance Index of Plants. Journal of Environmental Management.1991;32: 45-55.
CrossRef - Manjunath BT., Reddy J. Comparative evaluation of air pollution tolerance of plants from polluted and non polluted regions of Bengaluru. Journal of Applied Biology & Biotechnology. 2019; 7(3): 63-68.
CrossRef


