Localized Profile of Arsenic in Soil and Water in the Area Around Gold Mine
Thanes Weerasiri1 * , Wanpen Wirojanagud1,2 and Thares Srisatit3
1
Faculty of Environmental Engineering,
Khonkaen University,
Thailand
2
Centre of Excellence on Hazardous Substance Management,
PERDO,
Bangkok,
10330
Thailand
3
Faculty of Environmental Engineering,
Chulalongkorn University,
Thailand
DOI: http://dx.doi.org/10.12944/CWE.8.2.08
Copy the following to cite this article:
Weerasiri T, Wirojanagud W, Srisatit T. Localized Profile of Arsenic Concentration in Soil and Water at the Area Around Gold Mine : A Preliminary Site Characterization. Curr World Environ 2013;8(2) DOI:http://dx.doi.org/10.12944/CWE.8.2.08
Copy the following to cite this URL:
Weerasiri T, Wirojanagud W, Srisatit T. Localized Profile of Arsenic Concentration in Soil and Water at the Area Around Gold Mine : A Preliminary Site Characterization. Curr World Environ 2013;8(2). Available from: http://www.cwejournal.org/?p=4880
Download article (pdf) Citation Manager Publish History
Select type of program for download
| Endnote EndNote format (Mac & Win) | |
| Reference Manager Ris format (Win only) | |
| Procite Ris format (Win only) | |
| Medlars Format | |
| RefWorks Format RefWorks format (Mac & Win) | |
| BibTex Format BibTex format (Mac & Win) |
Article Publishing History
| Received: | 2013-07-17 |
|---|---|
| Accepted: | 2013-08-12 |
Exposure to arsenic can result in a variety of health problems in humans, including various forms of cancer (e.g. skin, lung, and bladder), cardiovascular and peripheral vascular disease, and diabetes. Human encounter arsenic from natural and anthropogenic sources (Henke, 2009). Environmental Protection Agency (U.S. EPA) specified that the arsenic contamination in drinking water should be less than 10 µg/l. In case of soils used for agriculture and for other usages, the Office of National Environment Board of Thailand set the maximum concentration limits (MCL) to be of 3.9 mg/kg and 27 mg/kg, respectively.
Arsenic enters the environmental through herbicides, wood preservatives, and mining industry (Chopra, Parmar, 2007). It can distribute in either soil or water, transport to other places, pollute to water resources, and subsequently affect water for daily consumption. Gold mining also contributes to the distribution of arsenic. During gold extraction, arsenic, which is the composition of Arsenopyrite, is also separated and diffused into soil and water, and pollutes to the environment (Henke, 2009).
Gold mining at Wangsaphung district, Loei province of Thailand, is the one of mining industry that encountered this problem. After starting its work in 2006, villagers from 6 villages complained that the natural water they normally use become contaminated with arsenic resulting in affected human life, which has never been before. Related government agencies and staffs from the goldmine have investigated the arsenic contamination in both surface water and groundwater, the study revealed that contamination level is less than MCL.
The objective of this study is to investigate whether there are arsenic contaminated in soil and find the amount of concentration both in water and soil. It would be the first study for investigating arsenic in soil for this area and the results will give the preliminary guidelines for further studies in the distribution, direction, and transportation of arsenic, which will be advantageous for managing the agriculture and living area in near future.
General Information
Loei, one of 76 provinces of Thailand, is situated in Northeastern part attached to the Maekong River and border of Republic of Laos. The area of this study is in Wangsaphung district of Loei province (Figure 1), which is mountainous and plateau area. The altitude of gold mine is about 300 meters from mean sea level. Within 5 kilometers from the goldmine, there are 6 villages that have the most impact from arsenic including Ban Nam Huai, Ban Na Nong Bong, Ban Huai Phuk, Ban Kok Sathon, Ban Kaeng Hin, and Ban Tak Daed (Figure 2). The nearest village to the goldmine, 250 meters from the mine and at the altitude of 277meters from the mean sea level, is Ban Na Nong Bong. In those 6 villages, the farthest one is Ban Tak Daed, which is 5 kilometer from the mine and at the altitude of 276 meters from the mean sea level. Most of lands were engaged in farming and cropping plants such as bananas, tapiocas, nuts, and rubber trees. Within catchment area that goldmine situated, there are many small waterways such as Huai Nam Chan, Huai Muno, Huai Haeng, Huai Khok Yai and Huai San, flowing form high elevation at the top of plateau directing to lower elevation area and combining to be one stream, called Nam Huai stream, finally joint together with Loei River.
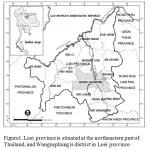 |
Figure 1: Loei province is situated at the northeastern part of Thailand, and Wangsaphung is district in Loei province. Click here to View figure |
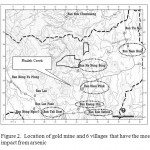 |
Figure 2: Location of gold mine and 6 villages that have the most impact from arsenic Click here to View figure |
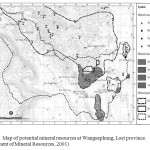 |
Figure 3: Map of potential mineral resources at Wangsaphung, Loei province. (Department of Mineral Resources, 2001) Click here to View figure |
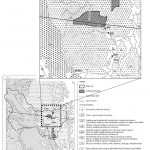 |
Figure 4: Thai Geological map No.5343 IV covering study area. (Department of Mineral Resources, 2008) Click here to View figure |
Gegological Characteristics
The area in Loei province consists of metamorphic, sedimentary, and igneous rocks, dating back from Silurian - Devonian to Quaternary period. The rock in each period has its own characteristics. Fossils can be found in some of sedimentary rocks, which can be exactly dated. Geological structure of rocks lies in North-South direction. The observed igneous rocks include volcanic and plutonic rocks, which mostly classified as granitic rocks. Sedimentary rocks are from regional, contact, or from thermal metamorphism. (Putthapiban, 1987)
The geological map of Thailand No. 5343 IV (Figure 4), located the area in between 17o15’ N – 17o30’ N latitude and 101o30’ E – 101o45’ E longitude covering the study area, shows that the underlaid rock types are micaceous sandstone, siltstone, shale, mudstone, and dark gray with plan fossils. The altitudes of rock at the location corresponding to gold mine and nearby villages are approximately 300 meters from mean sea level.
The mineral and potential mineral map No. NE 47-12 (Figure 3), located in between 17o00’ N – 18o00’ N latitude and 100o30’ E – 102o00’ E longitude covering the study area, displays that there are many minerals in this area either metallic or non-metallic, e.g. iron (Fe), gold (Au), copper (Cu), lead (Pb), zinc (Zn), manganese (Mn), coal (anthracite) and gypsym (CaSO4 ×2H2O). Determining throughout the map, there is the gold mineral in many places seem to be as the whole area not concentrated only on the study area.
Sampling Collection and Testing
Soil and water samples were collected to quantify arsenic contaminant. The positions of sampling are mostly in the catchment area covering gold mine and affected villages. However, another position of soil and water samples outside the water basin was also acquired for comparison. The details of soil and water samplings are shown below:
Soil Sampling
Five boreholes (BH) have been drilled into the ground and soil samples were collected at 0.50 meter along the depth of borehole. Total depth of each borehole depends on the level of rock or gravel bed underneath, or until the standard penetration number, the number of hammer drops to push sampler into the ground, is greater than 50 Bl/ft (ASTM, 2000). The position of each borehole are depicted in Figure 5. As clearly seen, BH 5 is at Ban Kok Chumsaeng outside the study catchment. Each soil sample was measured pH value before wrapping with foil sheet and coated with paraffin to protect the moisture loss and oxidizing reaction that might be occurred during carry on for further tests in laboratory.
Water Sampling
Surface water samples have been collected from 13 positions and samples of groundwater have been collected from 8 position. All positions were shown in Figure 5. The samples are treated to remain acidic by nitric acid (5% concentration), and poured in the light brown bottles, sealed with masking tape for conducting arsenic contamination test.
Testing
Inductively Coupled Plasma Mass Spectrometry (ICP-MS) method was utilized to quantify the arsenic contaminants in either soil or water. This technique provides high precision determination of substance, even metallic or non-metallic, from relatively small amount of samples (Skoog et al., 2007). The procedure starts from grinding/homogenization, weighing, digestion, dilution, and final measurement. Since this technique related to analytical chemistry and spectrometry, more details of this method can be found in Bailey et al, (2003).
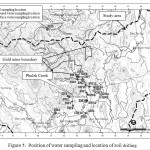 |
Figure 5: Position of water sampling and location of soil drilling Click here to View figure |
Results and Discussion
Arsenic Contamination in Water
Laboratory results reveal that the amount of arsenic in surface water and groundwater (Table 1 and Figure 6) are not more than MCL of 0.01 mg/l in general areas, except at one position called Phulek creek. Arsenic content at that location significantly exceeds MCL both in surface water (SW1, SW2, SW3 and SW4) and groundwater (GW3 and GW8).
Considering the geography map, the position of Phulek creek is at the mouth of mountainous pass, therefore it may be possible that the water would flow from upper area nearby goldmine and carry arsenic to the sampling location as SW1, SW2, SW3 and SW4.
Arsenic Contamination in Soil
Soil samples from 5 boreholes have been classified using the Unified Soil Classification System. Soil profiles and their altitudes were orderly arranged from high to low elevation of existing ground level; those are BH5, BH4, BH1, BH2, and BH3, respectively, as shown in Figure 7. These boreholes represent rather similar soil profiles which are the alternate layer of clay, silty clay, and sandy silty clay. However, most soil types were classified as silty clay and sandy silty clay, as can be seen in Shepard chart shown in figure 8. Because of their high cohesion, silty clay and sandy silty clay can allow lower permeable than coarse grained soil as sand and gravel.
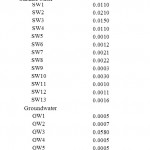 |
Table 1: Arsenic Contamination in waters Click here to View table |
Contaminant test results reveal that all soil samples have arsenic contaminants and most of them contain more than 3.9 mg/kg, the MCL designated by the Office of National Environment Board of Thailand, as detailed in Table 2. The average arsenic contaminant in some boreholes present somewhat higher than 27 mg/kg, the second level of MCL for other usage in Thailand, such as BH1, BH4, and BH5, with the average value of 41.90, 48.84, and 30.94 mg/kg, respectively. It can be notice that even in the soil samples of BH5 which located at outside of study catchment also have much high arsenic content. By the reasons of location at outside and highest ground elevation of BH5, it can be indicate that there also exists arsenic in nearby catchment. The arsenic content found in whole area may not merely come from anthropogenic sources as goldmine or some other mining activities. However, site characterization in the catchment around and close to goldmine may possible give the best indicator for finding out the elevated arsenic.
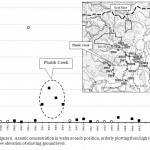 |
Figure 6: Arsenic concentration in water at each position, orderly plotting from high to low elevation of existing ground level Click here to View figure |
 |
Table 2: Arsenic Contamination in soils Click here to View table |
Arsenic concentration versus depth, as in figure 9, illustrates that there are seriously potential risk to human health since there are much higher of arsenic content than MCL in root zone, about within 1 m depth from existing ground level, especially at BH1, BH4, and BH5. Remarkable notice was found at BH4 which is the location of plain area at the mountain pass nearby goldmine. Within 4 m depth from top soil, range of arsenic contents are 42.27 mg/kg to 118.2 mg/kg which is the largest quantity compared to those of soils at corresponding depths in other boreholes. Elevated arsenic only exists in the top four meter depth, however, it gradually decreases with greater depth and finally reach to the concentration quantity approximately close to those in the soils at BH2 and BH3. As of such appearance, this location may be a possible place that arsenic-carrying water passes through. Greater detailed study starting from this location would probably point out its pathway which finally can give the source.
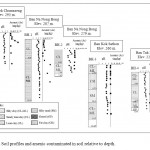 |
Figure 7: Soil profiles and arsenic contaminated in soil relative to depth. Click here to View figure |
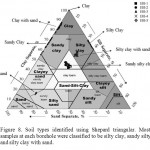 |
Figure 8: Soil types identified using Shepard triangular. Most soil samples at each borehole were classified to be silty clay, sandy silty clay and silty clay with sand. Click here to View figure |
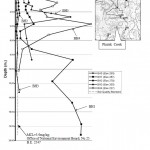 |
Figure 9: The amount of Arsenic contaminated in soil versus depth of each borehole. Click here to View figure |
Considering geological characteristics, depicted in Figure 4, it can be seen that the bottom of BH2, BH3, and BH4 are placed on the originally deposited gravel, which is somewhat loose media, whereas BH1 and BH5 placed on sandstone which is denser. Arsenic concentration at the bottom of bore holes seem to be quite different. At the lower part near the bottom of BH2, BH3 and BH4, which place on the gravel layer, the concentration of arsenic is lower compared to those of BH1 and BH5. Especially in BH4, the concentration of arsenic is even so high at the upper depth but abundantly decreases to the low value near the bottom part. Geologic condition plays an influence on the accumulation and the occurrence of arsenic in the deeper soil layer. As of having more pores in gravel, water can easier flow pass with arsenic, leading less accumulation of arsenic in that place. Unlike BH2, BH3, and BH4, the BH1 have arsenic quantity increased with depth and still retained high arsenic content at the bottom due to the densely impermeable bedrock. Since higher arsenic content present at the bottom, it also reveals that arsenic can comes from bed material which may be arsenopyrite or other arsenic-bearing minerals.
Conclusion
This study reveals that the arsenic contaminant can be found at all excavation points. The contamination does not only occur in the study catchment. It is possible that the arsenic originally exist over there for long time before. Soil samples of at least 3 locations have arsenic contaminant greater than MCL of 3.9 mg/kg. In most area Arsenic content in water is less than MCL of 10 µg/l, except for those at the location called Phulek creek. Surface water at Phulek creek have remarkable contaminant, and consistently agree with those in top soil of adjacent borehole. This position is the mouth of mountain pass, where the water can flow from upstream nearby goldmine and downward passing through. Because of its plain area, the water might drain arsenic from goldmine and settle there.
The study indicates that more information can be taken from the contaminant in soils. The location for further study can be selected from these findings. The influence factors of studying arsenic distribution such as the geological characteristics, compositions of soil, porosity and permeability of soil, may be needed to be determined. The arsenic mobility which would threaten villages, will be of greater importance in next study.
Acknowledgement
This work has been supported by the Higher Education Research Promotion and National Research University Project of Thailand, Office of the Higher Education Commission.
References
- American Society for Testing and Materials Annual Book of ASTM Standards. West Conshohocken, PA.,Vol.04.08 (2000).
- Bailey, R.M., Stokes, S., Bray, H., Inductively Coupled Plasma Mass Spectrometry (ICP-MS) for dose rate determination: some guidelines for sample preparation and analysis, Oxford, UK:Oxford Luminescence Research Group, School of Geography and the Environment, University of Oxford, (2003).
- Chopra, H.K., Parmar, A. Engineering Chemistry - A Text Book. India: Alpha Science International Ltd., 5-10 (2007).
- Department of Mineral Resources, Bureau of Geological Survey, Geological map of Thailand 1:50,000, Loei, Thailand (Sheet 5343IV) (2008).
- Department of Mineral Resources, Mineral resources map 1:250,000 (Sheet NE47-12),From http://www.dmr.go.th/download/map/250000/NE47-12.pdf, Retrieved January 6 (2010).
- Henke, K.R., Arsenic Environmental Chemistry Health Threats and Waste Treatment. 1st ed., John Wiley & Sons. Ltd.,1-5, 238-243 (2009).
- Putthapiban, P., Geology of AEM area, Loei Province and mineral potential. 4th Academic conference, Department of Mineral Resources, p.39-67 (1987).
- Shepard, F.P., Nomenclature based on sand-silt-clay ratios. J. Sed. Petrol. 24, 141- 158 (1954).
- Skoog, D.A., Holler, F.J., Crouch, S.R. Principles of Instrumental Analysis. 6th ed. Canada: Thomson Brooks/Cole, 291-299 (2007).
- United States Environmental Protection Agency, Arsenic in Drinking Water, http://www.epa.gov/safewater/arsenic/index.html, Retrieved February 10 (2010).


