Microbial Contamination of Community Pond Water in Dibrugarh District of Assam
Purnima Gogoi1 * and Dhruba Sharma1
1
Department of Botany,
Rajiv Gandhi University,
Itanagar,
India
DOI: http://dx.doi.org/10.12944/CWE.8.1.09
Copy the following to cite this article:
Gogoi P, Sharma D. Microbial Contamination of Community Pond Water in Dibrugarh District of Assam. Curr World Environ 2013;8(1) DOI:http://dx.doi.org/10.12944/CWE.8.1.09
Copy the following to cite this URL:
Gogoi P, Sharma D. Microbial Contamination of Community Pond Water in Dibrugarh District of Assam. Curr World Environ 2013;8(1). Curr World Environ 2012;8(1). Available from: http://www.cwejournal.org/?p=3312
Download article (pdf) Citation Manager Publish History
Select type of program for download
| Endnote EndNote format (Mac & Win) | |
| Reference Manager Ris format (Win only) | |
| Procite Ris format (Win only) | |
| Medlars Format | |
| RefWorks Format RefWorks format (Mac & Win) | |
| BibTex Format BibTex format (Mac & Win) |
Article Publishing History
| Received: | 2013-02-14 |
|---|---|
| Accepted: | 2013-03-02 |
With two thirds of the earth's surface covered by water and the human body consisting of 75 percent of it, it is evidently clear that water is one of the prime elements responsible for life on earth. Our drinking water today is far from being pure, contains bacteria, viruses, inorganic minerals (making the water hard) and a chemical cocktail that is unsuitable (if not deadly) for human consumption.
The particular group in this regard is the coliforms which are considered as a warning signal and the water is subject to potentially dangerous pollution even with single coliform bacterium. Even the water used for washing and animal drinking purpose should not contain more than 50 coliform bacteria (CPCB, 2001-2002). It is well known that freshwater fish and their aquatic environment can harbour human pathogenic bacteria, particularly members of the coliform group (Leung, Huang & Pancorbo 1992; Pullela, Fernandes, Flick, Libey, Smith & Coale1998; Ramos & Lyon 2000).
The coliforms bacteria group may occur in water due to faecal contamination, i.e, discharge of faeces by humans, all warm-blooded aquatic animals and some reptiles (Enriquez et al., 2001). Coliform includes the members of the family Enterobacteriaceae, e.g. Escherichia coli, Enterobacter aerogenes, Salmonila and Klebsiella. The faecal indicator bacterium (viz. E. coli) has been considered as bioindicator of faecal contamination of drinking water. The public health burden is determined by the severity of the illnesses associated with pathogens, their infectivity and the population exposed. There has therefore been an increased interest in the application of quantitative risk assessment for microbial load in drinking sources (Suthar et al., 2009). The present study is aimed to study the water quality standard by analyzing the viable coliforms along with other water born bacteria of three major community ponds which are used for human and animal bathing, washing clothes and also for drinking under water crises condition (winter). The data of this study may provide some important information about public health risks associated with the use of pond water in the region.
Materials and Methods
Sample Collection
Water samples which are used mostly for consumption as well as watering livestock were collected from three ponds of Dibrugarh district in the month of August 2002. August month is the post monsoon month with aquatic bodies full of water and pollutants. The samples were collected in triplicate from each pond. Bacteria were isolated by dilution plate technique following Halvorson and Ziegler (1933) methods using nutrient agar media. Presence of Coliform group of bacteria was tested with the reference to EPA manual (1978). Schematic method for coliform detection is shown in Figure 1. The primary identification of the isolates was carried out on the basis of their culture characteristics on agar plates and microscopic observations. The Secondary identification of the isolates was carried out on the basis of their enzymatic characteristics (Greenberg et al., 1985).
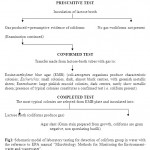 |
Figure 1: Schematic model of laboratory testing for detection of coliform group in water with the reference to EPA manual “Microbiology Methods for Monitoring the Environment- water and wastewater”. Click here to View figure |
After 24 hrs of incubation under anaerobic condition at 30oC, gas and acid production indicate presence of coliform bacteria. For conformation of coliform group, presumptive and confirmed tests were done using EMB agar and Endo agar medium by streak method. Besides coliform, three other bacterial species (gram positive round shaped and rod shaped) were selected for comparative analysis. The colonies formed on EMB agar were picked up on nutrient agar slant for further study.
Growth Conditions and Growth Yield
The total plate count was conducted by pour plate technique on plate count agar (PCA) and counting the colonies developed after the incubation at 37°C for 24 hours (APHA, 1998). All bacteria were grown in sterilized peptone water with nitrate medium (pH=7.2) supplemented with 0.1gm KNO3. Cultures were incubated at 27ºC for 24 hours. After 24 hrs 1 ml from each tube was transferred into four test tubes (each) containing sterilized peptone water with nitrate medium for growth and estimation of enzyme activity. Growth was monitored by measuring the absorbance at 660nm using spectrophotometer. Protein content of media was estimated after different incubation period following Lowery method, 1951. After incubation the media was centrifuged to remove bacterial pellets at 20,000 rpm for 5 minutes. The unit of protein measurement was µg/ml (Figure 3). One unit is equivalent to the amount of lysine utilize in one minute under standards experimental condition.
Nitrite Analysis
To confirm the presence of anaerobic bacteria in the water sample and to analyze the enzymatic activities of selected bacterial strains, nitrate test was performed. Fermentation of lactose broth and demonstration of Gram-negative, non sporulating bacilli constitute a positive completed test demonstrating the presence of some member of the coliform group in the volume of sample examined. Nitrite was determined by the method of (Daniels et al., 1994). Cultures were inoculated in 10 ml sterilized peptone water with nitrate medium separately and incubated in the incubator for 1 day. 1 ml from each test tube was transferred into four test tubes containing sterilized medium. After 3 days, 8 ml of each type were separated out in centrifugal tube and were centrifuged at 20,000 rpm for 30 minutes. The supernatant were used for extra cellular enzyme and the pellets suspended in the same volume of water were used for intracellular enzyme estimation. The unit of measurement was µg/mg of protein.
Results
The screening of three selected pond showed large number of bacterial colony in the water sample. Among the 3 ponds, pond 1 showed highest number of bacterial counts (30x104) followed by pond 3 (24 x104) whereas pond 2 showed minimum colony count (12 x 103) per ml of water. Microbial analysis showed four dominant types of bacterial group viz, gram negative rod shaped coliform group, two groups of gram positive round shaped (with colony colour violet and orange) and gram positive rod shaped bacteria, besides several other species (Table 1). From 1st pond, about 74 numbers of coliform bacteria were counted per 100ml of water sample. Similarly, from Pond 2 and three 59 and 67 numbers of coliform bacteria were identified per 100 ml of water respectively.
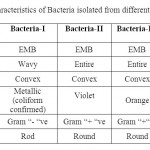 |
Table 1: Cultural characteristics of Bacteria isolated from different pond water Click here to View table |
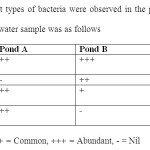 |
Table 2: Four different types of bacteria were observed in the plates. The intensity of each type recorded in water sample was as follows Click here to View table |
The non diluted (control) sample showed maximum bacterial growth as compared to diluted samples followed by 2 timed diluted samples. However, least bacterial growth was recorded in 10 times diluted sample. An increase in growth was recorded with the increase in incubation period in control and 2 times diluted samples but 10 times diluted samples shows non sequential growth pattern (Fig 2). The maximum growth of bacteria I was observed in 4th day (1.193 O.D/cell suspensions) in non diluted sample however, analogous growth was observed from 2nd to 3rd day at two times dilution. However unequal growth pattern is visible in the samples with ten fold dilution. The protein content of Bacteria I was highest (834.49 µg / ml) in control medium at 4th day compared to other three groups (Fig 3). In contrary, this bacterium confines maximum protein in ten times diluted sample at 1st, 2nd and 4th day consecutively in 2 times dilution. As a whole, Bacteria IV produced maximum protein (1541.6 µg / ml) at 1st day followed by Bacteria I in 10 times diluted sample.
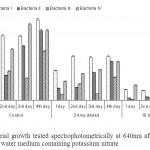 |
Figure 2: Bacterial growth tested spectrophotometrically at 640nm after incubation at 30oC in peptone water medium containing potassium nitrate Click here to View figure |
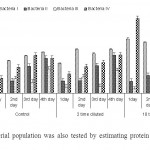 |
Figure 3: Bacterial population was also tested by estimating protein content / ml of culture Click here to View figure |
The amount of nitrite produced both by Bacteria I, III and IV was found maximum in control sample after 62, 24 and 62 hrs of incubation respectively (Fig 4). Bacteria II however, showed highest nitrate reductase activity in 2 times diluted samples after 62 hrs of incubation. The nitrate reduction of intercellular enzyme produced by Bacteria I was always high except 2nd day of incubation, where Bacteria IV showed the highest enzymatic activity. However, the extra cellular enzymatic activity of Bacteria IV was higher in all the four days in comparison to the other three isolates.
Discussion
Detection of faecal indicator bacteria in drinking water provides a very sensitive method of quality assessment and it is not possible to examine water for every possible pathogen that might be present. Ideally, drinking water should not contain any microorganisms known to be pathogenic or any bacteria indicative of faecal pollution (WHO, 1993). Similarly the washing and bathing water should not contain more than 50 coliform bacteria per 100ml of water (CPCB, 2001-2002). Coliform bacteria counted in the above study are well above the safety guidelines together with the other gram positive and gram negative bacterial group. The selected ponds have allochthonous inputs in the form of domestic waste, bathing of human and animals, washing of cloths and utensils, etc. According to WHO guidelines (1984), the occurrence of pathogens or indicator organisms in ground or surface water mainly depends on the range of human activities and animal sources that release pathogens to the environment.
Nonetheless, the inadequate availability of water, ill maintenance of pond water, unsafe disposing of human, animal and household wastes, unawareness about good sanitation and personal hygienic practices etc. are some key factors responsible for poor drinking water quality in rural India including the state of Assam (report by planning commission of India 2002). Coliforms may be used as water quality indicator, and if such bacteria are not detected in 100ml of sample; the water can be said as safe for drinking and bathing purpose (Klen and Casida 1967). The water sample of three ponds of Dibrugarh area showed the presence of faecal coliforms i.e, E. coli, which indicates the contaminations of pond water by animal and human generated wastes.
The continuous consumption of such contaminated water may pose a serious health risks in local community of the area especially during the summer season as this is a flood prone and high rainfall area (Sutar et al 2009). Borah et al. (2010) have found over 78% of tested pond samples as E. coli contaminated. MPN of fecal coliform count was reported to be around 28000 cfu/100 ml in Kakotibari TE and Sockieting TE of Assam. They have reported over 0.7 % population affected by the diarrheal and dysentery disease. High coliform counts were the most common reason for the failure of potable water to meet acceptable standards. Usha et al (2006) also reported the presence of faecal streptococci, Escherichia coli, Enterobacter sp., Aeromonas sp. and Vibrio sp. in lake water of Tamil Nadu. Presence of coliform count in the water sample also point towards pollution of the lake and leads to pathogenic fish diseases. In the present survey the bacterial count of about 104 to 105 are reported per ml of the sample water. The detection of pathogenic enteric bacteria in different sources of water in this area also reveals the alarming situation for water borne diseases in this particular area.
Water quality signifies that pollution of the water is increasing alarmingly and that it has created serious threat to human health and environment. The breakdown of nitrate during the ensiling fermentation is caused by nitrate reductase enzymes, found in Enterobacteria, Clostridia and Lactobacilli species. Enterobacteria are mainly responsible for degradation of nitrate in silage (Spoelstra, 1987). Nitrate reduction in a silage counteracts the acidification process (Spoelstra, 1985) resulting in a poorer quality product. Present study also depicted higher nitrate reductase activities among the isolated bacterial strains (Fig 4). The lack of safe water supply and of adequate means of sanitation is blamed for as much as 80 % of all diseases in developing countries. A regular monitoring the water quality for improvement not only prevents disease and hazards but also checks the water resources from going further polluted (Trivedy and Goel, 1986). The management of water resources is of the essence to provide safe water. Moreover, water sources must be protected from contamination by human and animal waste, which can contain a variety of bacterial, viral, protozoan and helminthes parasites.
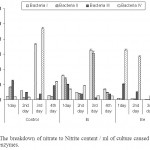 |
Figure 4: The breakdown of nitrate to Nitrite content / ml of culture caused by nitrate reductase enzymes. Click here to View figure |
Acknowledgement
The authors are highly grateful to Prof. R. Samanta, Department of Life sciences, Dibrugarh University, Assam for his valuable suggestions in conducting the work and also to the Department of Life sciences providing the essential laboratory facilities to carry out the experiments.
References
- Anand, C., P. Akolkar, and R. Chakrabarti. 2006. Bacteriological water quality status of river Yamuna in Delhi. J. Environ. Biol. 27: 97-101.
- APHA. 1998. Standards Methods for the Examination of Water and Wastewater. 20th edition, American Public Health Association, Washington, D.C.
- Borah M., J. Dutta, and A.K. Misra. 2010. Int. J. Chem. Tech. Res. 2: 1843-1851.
- CPCB (Central Pollution Control Board): Water Quality Criteria and Goals. MINARS/17/2001-2002
- Drinking Water Quality Standards.www.edstrom.com
- Environment Protection Agency: Microbiology Methods for Monitoring the Environment, Water and Wastes. U. S. Environmental Protection Agency, Washington, D. C. 1978. A manual of laboratory procedures.
- Halvorson, H.O. and N.R. Ziegler. 1933. Application of Statistics to problems in bacteriology: I. A means of determining bacterial population by the dilution plate method. J. Bacteriol. 25: 101-121.
- Klein D.A. and L.E. Casida 1967. E. coli dies out from normal soil as related to nutrient availability and the indigenous microflora. Can. J. Microbiol. 13: 1456-1461, http://dx.doi.org/10.1139/m67-194
- Leung, C., Y. Huang and O. Pancorbo. 1990. Bacterial flora associated with a Nigerian freshwater fish culture. J. Aquacul. Trop. 5: 87-90.
- Lowry, O.H., N.J. Rosebrough, A.L. Farr and R.J. Randall. 1951. Protein measurement with the Folin-Phenol reagents. J. Biol. Chem. 193: 265-275.
- Pulella, S., C. Fernandes, G.J. Flick, G.S. Libey, S.A. Smith and C.W. Coale. 1998. Indicative and pathogenic microbiological quality of aquacultured finfish grown in different production systems. J. Food Prot. 61: 205-210.
- Ramos, M. and W.J. Lyon. 2000. Reduction of endogenous bacteria associated with catfish fillets diversity of using the grovac process. J. Food Prot. 63: 1231-1239.
- Suthar S., V. Chhimpa and S. Singh. 2009. Bacterial contamination in drinking water: a study in rural areas of northern Rajasthan, India. Environ. Monit. Assess. 159: 43-50, http://dx.doi.org/10.1007/s10661-008-0611-0
- Trivedi, R.K. and P.K. Goel. 1986. Chemical and Biological Methods for Water Pollution Studies. Environmental publication, Karad 415110. India.
- Usha R., K. Ramalingam and B. Rajan. 2006. Freshwater Lakes- A potential source for aquaculture activities- A model study on perumal lake, Cuddalore, Tamil Nadu. J. Environ. Biol. 27: 713-722.
- World Health Organization 1983. Guidelines for Drinking water quality, Vol.1,2 and 3.
- World Health Organization 1984. Guidelines for drinking water quality recommendations. Geneva: WHO.
- World Health Organization 1989. Health Guidelines for the Use of Wastewater in Agriculture and Aquaculture. WHO Technical Report Series, Number 778. World Health Organization, Geneva, Switzerland.
- World Health Organization 1992. Our Planet, Our Health, Report of the WHO Commission on Health and Environment. World Health Organization, Geneva.
- World Health Organization 1993. Guidelines for Drinking Water Quality, Volume I, II and III, World Health Organizations, Geneva.
- World Health Organization 1997. Basic Environmental Health, Geneva.
- World Health Organization 2003. Emerging issues in water and infectious disease. Geneva: WHO.


