Studies in River’s Bottom Sediments in Swarnarekha River around Jamshedpur and Ghatsila for Metallic Pollution
H. S. Mishra1 and S. K. Jha2 *
1
Department of Chemistry,
Jamshedpur Co-operative College,
Jamshedpur,
India
2
Department of Chemistry,
J.S.M. College,
Jamshedpur,
India
DOI: http://dx.doi.org/10.12944/CWE.7.1.25
Studies of heavy metals namely Iron, Chromium, Manganese, Cobalt, Nickel, Copper, Zinc, Cadmium and lead as pollutants in river water and waste water discharge samples of rivers around steel plants of Jamshedpur and Ghatsila, East Singhbhum, Jharkhand, was carried out from February,2012 to March, 2012. Atomic Absorption spectrophotometric analysis of non-filterable residue of bottom sediments for the heavy metals were made. The fractionation analysis of the adsorption and/or ion exchangeable, oxide coating, organic solids and crystalline phase was carried out. Total metals concentration was also determined. The sum of the concentration of metals in adsorbed, oxide coating and organic solid phases is available to biota. The crystalline phase is not available to biota. The results have been discussed and the conservation of metal available to biota have been estimated.
Copy the following to cite this article:
Mishra HS, Jha SK. Studies in River’s Bottom Sediments in Swarnarekha River around Jamshedpur and Ghatsila for Metallic Pollution. Curr world Environ 2012;7(1):163-167 DOI:http://dx.doi.org/10.12944/CWE.7.1.25
Copy the following to cite this URL:
Mishra HS, Jha SK. Studies in River’s Bottom Sediments in Swarnarekha River around Jamshedpur and Ghatsila for Metallic Pollution. Curr world Environ 2012;7(1):163-167. Available from: http://www.cwejournal.org/?p=2058
Download article (pdf) Citation Manager Publish History
Select type of program for download
| Endnote EndNote format (Mac & Win) | |
| Reference Manager Ris format (Win only) | |
| Procite Ris format (Win only) | |
| Medlars Format | |
| RefWorks Format RefWorks format (Mac & Win) | |
| BibTex Format BibTex format (Mac & Win) |
Article Publishing History
| Received: | 2012-04-28 |
|---|---|
| Accepted: | 2012-06-10 |
Introduction
The chemical composition of the bottom sediments and its variation of different sites in the river Swarnarekha receiving the treated and untreated waste water from domestic and industrial sources have a profound impact on the water quality of the river basin. Water chemistry only assesses the effluent impact at the time of sampling while the bottom sediments geo-chemistry gives a cumulative assessment of pollution. Bottom sediments analysis has been used to trace pollutant inputs and to anticipate the effects of their pollutants on water quality.
In this work, the bottom sediments from different sites on the river Swernarekha around Steel City of Jamshedpur and Ghatsila was analysed for their multi-element composition with a view to establish the relationship between the pollution of rivers and the discharge of domestic and industrial waste waters.
Experimental
Sampling Sites.
(i) Swarnarekha River (Near Nirmal nagar, Sakchi) in February, 2012
Site IA – Discharge Sample
Site IB – River Water Sample (1 Km away from discharge)
(ii) Swarnarekha River (Near Ghatsila) in March, 2012
(iii) Site II A – Discharge Sample
(iv) Site II B – River Water Sample (1 Km away from discharge)
Partitioning of waste water discharge sample
The sample was transferred into two 1 litre measuring flasks separately and then filtered through Whatman filter paper (No.-42) separately. Filtrate in all the cases were rejected. The residues in the above two cases were collected separately and treated as follows:
Residue-I
The residue obtained after filtration of the waste water discharge sample along with the filter paper was treated with 20 ml aqua regia and heated for 0.5 hours over water bath. It was then filtered through Whatman filter paper (No.-42) and the volume was made up to 500 ml with distilled water in a volumetric flask. The metals determined in this filtrate were the total metal concentration in this sample.
Residue-II
The residue obtained after filtration of 1 litre of waste water discharge sample along with the filter paper was leached with 50ml of 0.5 N MgCl2. 6H2O solution for 7 hours stirring from time to time and it was then filtered through Whatman filter paper (No.-42). The filtrate was then made upto 500ml with distilled water in a volumetric flask for the determination of adsorbed and/or ion exchangeable heavy metals (Eisenreich-1980). The residue left over on the filter paper along with the filter paper itself was then leached with 0.4 N sodium pyrophosphate solution for 10 hours stirring from time to time and then filtered. The filtrate was then made upto 500ml and heavy metals associated with organic solid were estimated from this filtrate. The residue along with filter paper was treated with 50ml 0.3 N HCl solution and heated at 90oC for 0.5 hr and then filtered. The filtrate, was then made, upto 500ml. Heavy metals in oxide coating were determine in the filtrate. The residue along with the filter paper was then treated with 20ml aqua regia and heated over water bath for 0.5 Hrs. It was then filtered and the volume of the filtrate was made upto 250ml. The metals determined in this last filtrate were designated metals in crystalline state.
Partitioning of river Water Sample
Similar procedure was followed for the determination of total concentration of heavy metals and concentration of heavy metals in different phases.
The samples obtained as above were analysed for estimation of heavy metals such as Fe, Mn, Cr, Ni, Co, Cu, Zn, Cd and Pb by Atomic Absorption spectrophotometer.
Results and Discussion
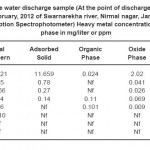
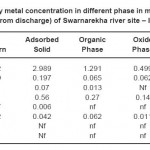
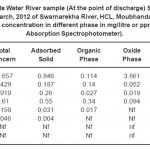
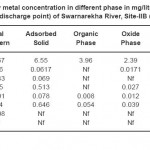
Among the heavy metals, iron occurs in much higher concentration at site IA & IIA (discharge sample) 18.52 to 16.857 ppm. At site IB & IIB (river water sample) the concentration is 11.67 to 6.402. Total Mn content in the sample as determined by Atomic absorption spectrophotometer were 0.85 to 0.429 ppm at the point of discharge and in river water sample it is 0.259 to 0.16 ppm. Ni in discharge sample were estimated to be 0.919 ppm to 0.766 ppm where as in river water sample it is 0.183 ppm to 0.1 ppm. Total Zn metal concentration in discharge sample was found to be 1.61 to 1.34 ppm and in river water sample was estimated to be 1.15 to 0.84 ppm. Lead metal concentration was found to be 0.26 to 0.158 ppm in discharge sample and in river water sample it was 0.201 to 0.017 ppm. Higher concentration of Pb-metal in River water is probably due to domestic discharge in the River water.
 |
Table 1: Waste water discharge sample (At the point |
 |
Table 2: Heavy metal concentration in different phase in mg/litre or ppm (1 Km away from discharge) of Swarnarekha river site – IB (Feb, 2012) Click here to View table |
 |
Table 3: Waste Water River sample (At the point of discharge) Site-IIA in the Month of March, 2012 of Swarnarekha River, HCL, Moubhandar, Ghatsila. Heavy metal concentration in different phase in mg/litre or ppm(By Atomic Absorption Spectrophotometer). |
 |
Table 4: Heavy metal concentration in different phase in mg/litre or ppm (1 Km away from discharge point) of Swarnarekha River, Site-IIB (March, 2012) |
The partioning of Iron in different forms show that the dominant phase is the crystalline one for transportation of iron. This finding is similar to the finding of Roy and Mishra (1988) and Mishra & Tiwary but it is contrast to that of Roy and Upadhyaya (1985) found in their studies.
The more common transport phase behavior for iron in the river water in Swarnarekha river is adsorbed>crystalline>oxide>organic solid but at site IIA the trend is crystalline> adsorbed> oxide>organic solid.
Mn concentration in different phases as analysed by Atomic absorption spectrophotometer in Swarnarekha river is adsorbed>crystalline> oxide>organic except for site IIA where crystalline> adsorbed>oxide>organic. These finding are different from Dr.Mishra & Tiwary.
Zn concentration in different phase were estimated and found to be adsorbed>crystalline> oxide>organic solid in site IB while in the rest it was found to be crystalline>adsorbed>organic>oxide while not found in oxide phase. The variation of concentration of Ni metal in sample IB was adsorbed>crystalline>organic while not found in oxide phase whereas in others it was crystalline> adsorbed>organic>oxide form. Partioning of
Pb-metal in different phases were found as crystalline>adsorbed>organic>oxide wherein concentration of metal is very low. However, oxide phase and organic phase was found to be almost nil in some of the samples.
Conclusion
There data about the occurrence of Fe, Mn, Cu, Cr, Ni, Zn and Pb in the various available and unavailable metal phases would help in determining the effect of these metals on the crops and other biota. The higher concentration of these heavy metals in water prevents the self purification of water and thereby produces adverse effect for aquatic lives.
General standard for discharge of environmental pollutants (inland surface water) such as Fe = 3.0mg/L, C-2.0 mg/L, Cu-3.0 mg/L, Zn = 5.0 mg/L, Ni = 3 mg/L. However it needs further study on the co-relation of the concentration of these metals in the various phases and their toxilogical and other effects.
References
- APHA Standard methods for examination of water and waste water (12th edn; part I). American public Health Association, New York 317-320 (1967).
- S.J. Eisenreich, M.R. Hoffman, D. Rastetter, E. Yost and W.J. Maier, ACS symp Ser. 189: 135 (1980).
- H.S. Mishra, Studies in metal transport phases in rivers around Jamshedpur Ph.D., Thesis, Ranchi (1988).
- N.N. Roy, and N.P. Upadhyaya Toxicological and environmental Chemistry, 10: 285-298. (1985).
- V.R. Sub. Naniu. Van Grieken and I, vant dacka Env. Geolr water Sci. 9(2): 93-103, (1987).
- A.I. Vogel, A text book of quantitative inorganic analysis (4th edn.). The English Language Book society and Longman, London (1978).
- W. Stummn and J.J. Morgan Aquatic Chemistry (2nd edn) John Wiley and Sons. New York. (1981).
- M.M. Reddy, Environmental International (1979).
- R.M. Chattopadhyaya, Studies in river sediments around Jamshedpur. Ph.D. Thesis, Ranchi University, Ranchi (1985).
- H.S. Mishra and P.B. Tiwary J. Chemtracks 6: 69 (2004).
- W. Schott, Dtsch. Labensmitt Rdsch, 48: 62-63 (1952).
- M.J. Stiff, Water res, 5(8): 585-599 (1971)
- A.I. Kadukin, V.V. Krasintseva, G.I. Romanova and L.V. Tarasonko, Gidribiol Zh, 18(1): 79-82 (1982).
- H.S. Mishra & P.B. Tiwary “Studies in monitoring and Control of chemical Pollution due to heavy metals”, Jchemtracks., 10(1&2):121-128 (2008).
- A.S. Waznah, B.Y. Kamaruzzaman, M.C. Org. S.Z. Rina and S.M. Zahir. Orient. J. Chem. 26(1): 39-44 (2010).
- V. Magarde, S.A. Iqbal, S. Pani and N. Iqbal. Orient. J. Chem. 26(4): 1473-1477 (2010).


