Investigation of Exhaust Emission Factors Based on Vehicle Models
Farnaz Takizad1 *
1
Department of Environment,
Tonekabon Branch,
Islamic Azad University,
Tonekabon,
Iran
DOI: http://dx.doi.org/10.12944/CWE.7.1.13
Hydrocarbon and Carbon monoxide emissions in passenger cars of Iran’s production is very high. This research is trying to technical examination of three vehicle models (Pride, Peugeot 206 and Samand) production of 2004, 2006 and 2008 check out amount of HC and CO emissions. MGT5 device was used to measure exhaust emission factors from this vehicle. The result of this study indicate that Pride and 206 Peugeot production of 2006 and Samand production of 2004 have most pollution in the production of HC. Most CO emissions was in vehicle production of 2004. Samand and Pride have lowest and most emissions, respectively. vehicles manufactured in 2008 is close to Euro IV Standard. However, vehicles manufactured since 2004 are Euro II standard. by increasing vehicle age was obsorved emissions increase.
Copy the following to cite this article:
Takizad F. Investigation of Exhaust Emission Factors Based on Vehicle Models. Curr World Environ 2012;7(1):79-85 DOI:http://dx.doi.org/10.12944/CWE.7.1.13
Copy the following to cite this URL:
Takizad F. Investigation of Exhaust Emission Factors Based on Vehicle Models. Curr World Environ 2012;7(1):79-85. Curr World Environ 2012;7;79-85. Available from: http://www.cwejournal.org/?p=1859
Download article (pdf) Citation Manager Publish History
Select type of program for download
| Endnote EndNote format (Mac & Win) | |
| Reference Manager Ris format (Win only) | |
| Procite Ris format (Win only) | |
| Medlars Format | |
| RefWorks Format RefWorks format (Mac & Win) | |
| BibTex Format BibTex format (Mac & Win) |
Article Publishing History
| Received: | 2012-05-09 |
|---|---|
| Accepted: | 2012-06-10 |
Introduction
Emissions of many air pollutants have been shown to have variety of negative effects on public health and the natural environment . Emissions that are principal pollutants of concern include: Hydrocarbons, Carbon monoxide(CO), Nitrogen oxides (NOx), Particulate matter, Sulfur oxide (SOx), Volatile organic compounds (VOCs). hydrocarbons are toxins. Hydrocarbons are a major contributor to smog, which can be a major problem in urban areas. Carbon Monoxide poisoning is also a major killer. By 1964, most new cars sold in the U.S. were so equipped, and PCV quickly became standard equipment on all vehicles worldwide (Rosen and Erwin, 1975).
Air pollution and cars were first linked in the early 1950’s by a California researcher who determined that traffic was to blame for the smoggy skies over Los Angeles. At the time, typical new cars were emitting nearly 13 grams per mile hydrocarbons (HC), 3.6 grams per mile nitrogen oxides (NOx), and 87 grams per mile carbon monoxide (CO) (Milestones in Automobile Emissions, 1994). Emission levels are dependent upon many parameter including vehivle-related factors such as model. Size, fuel type, technology level and milage, and opration factors such as speed, acceleration, gear selection, road gradient and ambient temperature (Boulter et al, 2007). The power to move a car comes from burning fuel in an engine. Pollution from cars comes from by-products of this combustion process (exhaust) and from evaporation of the fuel itself (Automobile Emissions, 1994).
Similarly, Ford Motor Company Chemistry Department Research Staff has instrumented a 1992 Aerostar van with Fourier transform infra-red instrumentation to measure approximately 20 species of emissions (e.g., CO, CO2, methane, total hydrocarbons, NO, and so forth) at high time resolution while on the road (Jession, 1994). Diesel engines while they have many advantages, they also have the disadvantage of emitting significant amounts of particulate matter (PM) and the oxides of nitrogen (NOx) and lesser amounts of hydrocarbon (HC), carbon monoxide (CO) and toxic air pollutants (Manufacturers of Emission Controls Association. 2009).
Air pollution is the most serious environmental problem in Tehran with exhaust emissions from spark-ignition engines accounting for a major part of problem. The formation and accumulation of deposits on the internal surfaces of engines could adversely affect the exhaust emission from vehicles. It is the perception that some of fuel additives can remove these deposits due to their detergency. It is found that the decarbonization process could reduce the exhaust CO and HC emissions, significantly. Emissions from Peykan and Pride vehicles decreased considerably after decarbonization (Daryabeigi Zand et al, 2007).
Quoting from Office of Vehicle If you consider the useful life of passenger cars in 20 years, This means that the vehicles to get out before the 1982, Number 1541200 old car are the traffic in Iran that make up The 40.21 percent of all passenger vehicles. According to statistical surveys, The share of cars in polluted air are approximately 60% and other emissions are about 40% (Khanfekr et al, 2009). about 1.5 million tons of pollutants are produced in Tehran every year. Carbon monoxide makes up a large percentage of this material (Roshan Zamir and Eikani, 2004). Given that the share of hydrocarbon and Carbon monoxide emissions in passenger cars of Iran’s production is very high, This research is trying to technical examination of three vehicle models (Pride, Peugeot 206 and Samand) production of 2004, 2006 and 2008 check out amount of HC and CO emissions produced from this vehicle.
Material and Methods
Technical examination as an accepted method was done around the world by government agencies or quasi-governmental for evaluation of vehicles that consistent with defined standards of safety and pollution. This study was done 2011 and was attempted using the data collected in previous years by the center of vehicl technical examination. Three types of domestically produced cars (Pride, Peugeot 206 and Samand modeles years 2004, 2006 and 2008) based on years of production and operation were compared the amount of emissions.
MGT5 device was used to measure exhaust emission factors from gasoline-powered vehicles such as CO2 - CO - HC - O2 - NO. If the vehicle is out of state or there is a defect in performance ignition systems, exhaust pollutants will go beyond the standard. This device consists of a Propp that placed inside the vehicle exhaust and Pumps. MGT5 device analysis the exhaust gases by using a computer system and displays on the monitor or LED. Then the result of vehicle test is printed. CO and HC emissions of exhaust gases of vehicles, operating years and car model are the input data of this study. It is worth noting that the amount of suffering to pass a technical examination of the test are as follows: in Auto injector for the CO gas approval number is up 2.5 and HC gas to number 250.
Results and Discussion
Pay attention to Table1, between HC emission of Samand vehicle and 206 Peugeot production of 2004 is no significant difference. It means, The amount of their pollution is close together but the difference emissions of Samand, Pride and 206 Peugeot, Pride in this year’s production is significant at level of 0.05 percent. between HC emission in vehicles produced 2006 and 2008 is no significant difference exept of Pride and Samand cars production in 2008, this difference is significant because of Samand car is be more modern.
Result of correlation measure the amount of CO emission of vehicle manufactured of 2004, 2006 and 2008 showed that only between emissions of Peugeot 206 and Pride production of 2008 are no significant difference. Between the amount of CO emission in other vehiceles production of different years in this study are significant different at level of 0.05 percent (table 2). Kelly and Groblicki, 1993 found that during moderate to heavy loads on the engine, the vehicle ran under fuel enrichment conditions, resulting in CO emissions 2,500 times greater than those at normal stoichiometric operation (HC was 40 times as great).
LeBlanc et al1995 in their study appear capable of adequately distinguishing the CO emission effects associated with variations in engine and vehicle operations for individual vehicle makes and models. However, it should be noted that the large variability in vehicle-to-vehicle CO emission response to changes in operating modes that has been noted in ongoing studies indicates that a model based on vehicle speed and acceleration profiles alone may not provide sufficient CO emission rate predictive capabilities for the fleet.
97 percent of CO and 92.8 percent of HC in Tehran air caused by pollution from the transportation sector in 1995 year (Department of Energy, 1996). in 2008 year, The share of HC and CO emissions from passenger cars was 59 percent and 88 percent, respectively in Iran (Department of Energy, 1999). Yli-Tuomi et al(2005) by research on emissions of fine particles, NOx and CO from on-road vehicles in Finland resulted: Relative to fixed site urban PM2.5, street air PM2.5 concentrations of Cu, BC, Fe, and Zn were elevated. Weather and road conditions influenced PM concentrations more than the differences between the city and highway traffic environments.
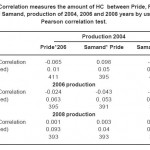 |
Table1: Correlation measures the amount of HC between Pride, Peugeot 206 and Samand, production of 2004, 2006 and 2008 years by using the Pearson correlation test. Click here to View table |
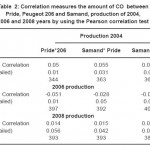 |
Table 2: Correlation measures the amount of CO between Pride, Peugeot 206 and Samand, production of 2004, 2006 and 2008 years by using the Pearson correlation test Click here to View table |
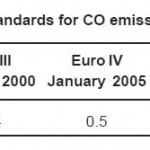 |
Table 3:European emission standards for CO emission in passenger cars (g/km). Click here to View table |
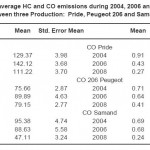 |
Table 4: The average HC and CO emissions during 2004, 2006 and 2008 years between three Production: Pride, Peugeot 206 and Samand Click here to View table |
Iran’s government in line with environmental protection and prevent air pollution, Timeline standards limit emissions of gasoline, diesel and dual burner vehicles, Domestic and imported and motorcycles be determined. Accordingly, the standards limit emissions of light vehicles, semi-heavy and heavy vehicles in 2010 and 2011 is Euro II, But the years 2012, 2013 and 2014 the vehicles must earn Euro IV standard. Table 3 shows european emission standards for CO emission in passenger cars.
The results of Table 4 indicate that Pride and 206 Peugeot production of 2006 and Samand production of 2004 have most pollution in the production of HC. Most CO emissions was observed in vehicle production of 2004. Samand and Pride have lowest and most emissions, respectively.
According to the results in table 4 can be said newer car models closer to international standards and we see a reduction of gas emissions. Comparison of CO emissions with Europe emissions standards can be stated vehicles manufactured in 2008 is close to Euro IV standard. However, vehicles manufactured since 2004 are Euro II standard. by increasing vehicle age we have emissions increase.
Kuhns et alin 2004 resulted that Emission factors were related to vehicle age, weight class and fuel type by matching license IDs to the state registration data. No relationship was observed between PM (particulate matter) emissions and VSP (vehicle specific power). PM emission factors from LDGV (light-duty gasoline vehicles) increased with vehicle age. Good agreement was observed for HC emission factors for vehicles less than 20 years old. CO emission factors were 2 times greater than measured CO emission factors for vehicles less than 13 years old. Measured NO emission factors were 50% greater than factors for vehicles 7–15 years old but in good agreement for vehicles less than 7 years old. Measured PM emission factors showed a clear increase with vehicle age.
Wang et al (2012) shows that trucks with high BC EFs do not usually have high NOx EFs, and vice versa, indicating that the current emission standards implemented in Beijing and nationwide have only limited impact on NOx emissions control.Therefore, effective multi-pollutant control strategies and in-use compliance programs are imperative to reduce the overall emissions from the transportation sector.
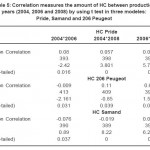 |
Table 5: Correlation measures the amount of HC between production years (2004, 2006 and 2008) by using t test in three modeles: Pride, Samand and 206 Peugeot Click here to View table |
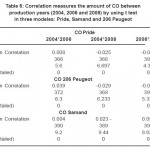 |
Table 6: Correlation measures the amount of CO between production years (2004, 2006 and 2008) by using t test in three modeles: Pride, Samand and 206 Peugeot Click here to View table |
Another test that was used to measure the HC and CO emissions in three models of vehicle in different years was t test. This test was performed on a product in 2004, 2006 and 2008 years. The results showed that between HC emission in vehicles manufactured in 2004, 2006 and 206 Peugeot manufactured of 2004 and 2008 are significant difference at the level of 0.05 percent. This difference between models of vehicles manufactured of 2004 and 2008 , 2006 and 2008 years was quite significant at level of 0.01 percent (table 5).pay attention to table 6, amount of CO emission between 2004 and 2006, 2004 and 2008, 2006 and 2008 years in Samand, Pride and 206 Peugeot have significant different at level of 0.01 percent. It is reason to reduce emissions of HC and CO in the newer cars.
Experimental results of (Horng Tsai et al,2000), indicate that the emissions of CO and THC from in-use motorcycles are significantly higher than new ones, but not for NOx, and the emissions of THC from 2-stroke motorcycles are much higher than 4-stroke ones. The emissions of VOCs (volatile organic compounds) from in-use motorcycles are higher than new motorcycles for all five driving patterns, and those from 2-stroke engines are higher than 4-stroke motorcycles. Emission of VOCs in the modes of deceleration and idle accounts for the most mass emitted during the test driving cycle.
There is reasonable agreement between the different types of studies for emissions of NOx, but agreement for emissions of other pollutants is qualitative. Remote sensing studies indicate that emissions of NO are normally distributed, while emissions of CO and HC are skewed to a few high emitting vehicles. (Yanowitz. et al, 2000) indicate that average emissions of PM, CO, and HC have been reduced during the past two decades, but average emissions of NOx have not changed. Thus, emissions regulations for PM have been somewhat effective, although the degree of PM reduction is less than expected based on changes in the standards. Emission regulations have apparently not been effective at reducing in-use NOx. In comparison, there are estimates that transit buses generate less than 5% of the vehicle miles traveled for heavy-duty vehicles.
Conclusion
Today one of the important factors affecting the issue of vehicle emissions is receiving tax of the vehicles. in Europe and other developed countries around the world receiving tax depends on their pollution. High consumption and high polluting vehicles pay more taxes . for approaching emissions standards to international standards should be made legal with non-standard products and with full compliance standardization of vehicles and construction technical examination centers trying to improve pollution problem in Iran.
References
- Automobile Emissions: An overview. U.S. Enviromental protection agency office of mobile sources. EPA. 400-F-92-014 (1994).
- Boulter, P.G., MeCare, I. S., Barlow,T. J., A review of instantaneous emission models for road vehicles. Transport Research Laboratory, Published project report per 267. Version: final (2007).
- Daryabeigi Zand, A., Nabi bidhendi, G., Mikaeili, A., Pezeshk, H., The influence of deposit control additives on exhaust CO and HCemissions from gasoline engines (case study: Tehran). Transportation Research Part D: Transport and Environment. 12(3): 189-194 (2007).
- Department of Energy,. Understanding Iran’s energy sector and provide basic data. Department of Environment. Iran. (1999).
- Department of Energy,. 1999. Feasibility of developing an electric car in Iran. Office of Planning. Technical Faculty of Tehran University. Iran. (1999).
- Horng Tsai, J., Chyun Hsu, Y., Cheng Weng, H., Yinn Lin, W., Tien Jeng, F., Air pollutant emission factors from new and in-use motorcycles, Atmospheric Environment. 34(28): 4747–4754 (2000).
- Jession, G., Studies Relating On-Board Emissions Measurements with Engine Parameters and Driving Modes. Proceedings of the Fourth CRC-APRAC On-Road Vehicle Emission Workshop, San Diego, Calif., 3(41): 3-58 (1994).
- Kelly, N.A. and Groblicki, P.J., Real-World Emissions from a Modern Production Vehicle Driven in Los Angeles. Journal of the Air & Waste Management Association, 43: 1351–1357 (1993).
- Khanfekr, A., Amroni Hoseini, M., Nemati, Z., Arzani, K., Azadmand, M., Production of catalytic converters for hybrid vehicle Roa and comparison with catalytic converters import Iran Khodro. Environmental Science and Technology. 11(2): 87-95 (2009).
- Kuhns, H. D., Mazzoleni, C., Moosmüller, H., Nikolic, D., Keislar, R. E., Barber, P. W., Li, Z., Etyemezian, V., Watson, J. G., Remote sensing of PM, NO, CO and HCemission factors for on-road gasoline and diesel engine vehicles in Las Vegas, NV. Science of The Total Environment. 322(1-3): 123–137 (2004).
- LeBlanc, D C., Saunders, F M., Meyer, M D., Guensler, R., Driving pattern variability and impacts on vehicle carbon monoxide emission. Transportation Research Board. 1472, ISSN: 0361-1981. 45-52 (1995).
- Manufacturers of Emission Controls Association., Retrofitting Emission Controls for Diesel-Powered Vehicles. 1730 M Street, NW, Suite 206 , Washington, D.C. 20036 (2009).
- Rosen, E.D., Erwin, M., The Peterson automotive troubleshooting & repair manual. Grosset & Dunlap, Inc.. ISBN 978-0-448-11946-5 (1975).
- Roshan Zamir, S., Eikani, M. H., Research of Tehran air pollution. Third National Conference on Iran’s energy. Iran (2004).
- Yanowitz. J., McCormick. R L., and Graboski. M.S., In-Use Emissions from Heavy-Duty Diesel Vehicles. Environmental Science and Technology ., 34(5): 729-740 (2000).
- Yli-Tuomi, T., Aarnio, P., Pirjola, L., Makela, T., Hillamo, R. and Jantunen, M., Emissions of fine particles, NOx and CO from on-road vehicles in Finland. Atmospheric Environment 39(35): 6696-6706 (2005).
- Wang, X., Westerdahl, D., Hu, J., Wu, Y., Yin, H., Pan, X., Zhang, M., 11-On-road diesel vehicle emission factors for nitrogen oxides and black carbon in two Chinese cities. Atmospheric Environment. 46: 45-55 (2012).


