Trend Analysis of Atmospheric Lifted Index, Precipitable Water, and Rainfall Over Hyderabad, India
Mohammad Taiyab1
 , Maniyar Shanawaz Begum2
 , Rizwan-ul Haq Ansari1
*
 , Md Khaleelur Rahiman1
 and Hakeem Aleem Basha1

1
Department of Physics, School of Sciences,
Maulana Azad National Urdu University,
Hyderabad,
Telangana
India
2
Department of Physics,
Silver Jubilee Government College,
Kurnool,
Andhra Pradesh
India
Corresponding author Email: rizwanans@manuu.edu.in
DOI: http://dx.doi.org/10.12944/CWE.19.3.30
Copy the following to cite this article:
Taiyab M, Begum M. S, Ansari R. H, Rahiman M. K, Basha H. A. Trend Analysis of Atmospheric Lifted Index, Precipitable Water, and Rainfall Over Hyderabad, India. Curr World Environ 2024;19(3). DOI:http://dx.doi.org/10.12944/CWE.19.3.30
Copy the following to cite this URL:
Taiyab M, Begum M. S, Ansari R. H, Rahiman M. K, Basha H. A. Trend Analysis of Atmospheric Lifted Index, Precipitable Water, and Rainfall Over Hyderabad, India. Curr World Environ 2024;19(3).
Download article (pdf)
Citation Manager
Publish History
Select type of program for download
| Endnote EndNote format (Mac & Win) | |
| Reference Manager Ris format (Win only) | |
| Procite Ris format (Win only) | |
| Medlars Format | |
| RefWorks Format RefWorks format (Mac & Win) | |
| BibTex Format BibTex format (Mac & Win) |
Article Publishing History
| Received: | 2024-09-09 |
|---|---|
| Accepted: | 2024-12-05 |
| Reviewed by: | 
 S N Abhishek
|
| Second Review by: |

 Ghanshyam Patle
|
| Final Approval by: | Dr. Gangadhar Andaluri |
Introduction
The atmosphere can be envisioned as a covering enveloping the Earth. The atmosphere is categorised into distinct layers: the troposphere, stratosphere, mesosphere, thermosphere, and exosphere. This study will examine the atmospheric water content, which exists in three states: gas, liquid, and ice. Water evaporates, ascends into the sky, cools, condenses into clouds, and subsequently precipitates; this process is termed the hydrological cycle, which facilitates the movement of water throughout the Earth's atmosphere. The hydrological cycle amidst the atmosphere and the surface of the Earth is crucial for weather formation. Furthermore, water evaporation and condensation of water vapour are associated with heat absorption and radiation. Consequently, water vapour is a crucial greenhouse gas that maintains the Earth's climate conducive to life.
Three conditions are requisite for the formation of a thunderstorm: moisture, atmospheric instability, and lifting. On a sunny day, a significant volume of water is moved into the troposphere through evaporation. This moisture is necessary for the formation of precipitation. Atmospheric instability signifies a persistent ascent of warm, buoyant air. The ascent of warm air is referred to as lifting or convection, occurring due to elevated temperatures, weather fronts, or mountainous terrain. Precipitable water (PW), lifted index (LI), and rainfall are crucial factors for comprehending moisture availability, atmospheric instability, and climate change within the framework of weather patterns and climate dynamics.
The Mann-Kendall, Sens slope and other non-parametric tests were used in several studies to detect trends in hydrometeorological time series viz stream flow, groundwater, lake level, water quality, temperature and precipitation data. The groundwater trend analysis has been studied and analyzed.1 The time series trend in streamflow has been studied.2 Trends in water quality were analyzed.3 Lake-level time series trend analysis was performed.4 Temperature and precipitation trend analysis was examined.5 In this study, the Mann-Kendall test is used to detect the presence of statistically significant trends in LI, PW, and rainfall. In this paper, an attempt has been made to examine the importance of prior research on LI, PW, and rainfall.
Precipitable Water (PW)
Cloud formation and precipitation depend on precipitable water (PW) in the vertical column of the atmosphere. The parameter PW represents the quantity of water that will be obtained by condensing a column of humid air having a cross-sectional area of one square meter extending from the surface to the upper layer of the atmosphere. It is measured in millimeters (mm). PW is an essential parameter for monitoring and analyzing weather and climate.
In India, the variability of PW is high due to the diverse topography and climate of the country. It is observed that the interannual variation of PW ranges from 3 to 10 percent for Northeastern India, 9 to 19 percent for the Himalayan region and 9 to 22 percent for peninsular India.6 It is also found that there is a 1.69% decadal increase in PW derived from MERRA 2 from 1980 to 2018 over India.7 It has been observed that PW has increased significantly in India from 0.1 to 0.2 mm/year during the last few decades.8 A study found that there were significantly positive trends (0.6 to 0.9 mm/year) in PW over India from 1980 to 2020. Seasonal distribution of PW was observed with a maximum of 40 to 65 mm during monsoon. The annual PW distribution was observed to be maximum (40 to 50 mm) on the east coast and minimum (less than 10 mm) in the western Himalayas.9 The study of air temperature, water vapor, ozone, carbon monoxide and methane trends has been studied over (Mumbai, Kolkata, Ahmedabad, Delhi, Chennai, Thiruvananthapuram, and Hyderabad) using satellite data for a period of ten years from 2003 to 2012. PW in the surface to 850 hPa atmospheric layer showed a significantly rising trend only in Hyderabad and Delhi, with rates of 1.663 and 0.580 percent per year respectively. PW in the 850 to 500 hPa atmospheric layer is statistically significant only in Hyderabad, increasing at the rate of 2.266 percent per year. PW in the 500 to 100 hPa atmospheric layer showed a significant declining trend only in Ahmedabad, decreasing at the rate of 2.718 percent per year. Further, it was observed that the total water vapor in Hyderabad had a rising trend at the rate of 2.274 percent per year.10
Lifted Index (LI)
Since the atmosphere of Earth is a dynamic system, analysis of atmospheric instability is crucial to the forecasting of severe weather. Temperature, moisture content, air mass, wind direction and speed, and environmental lapse rate are some of the variables that impact atmospheric instability. Several indices including the Showalter Index, LI, K-Index and Total Totals Index were developed to aid in thunderstorms or severe weather prediction.11-14 LI is an atmospheric instability index, useful as an afternoon thunderstorm forecast based on morning radio-sounding LI data. The LI has also been found to be useful for evaluating tornado outbreaks.15 For a detailed review on the importance of LI in the atmosphere see.16 The primary objective of LI is to investigate convective weather in the lower tropospheric layers. The difference in temperature between an air parcel and its surroundings at 500 hPa is measured as LI. In the case where a parcel of air rises into the atmosphere from the Earth's surface to 500 hPa, it first follows a dry adiabatic process from the Earth's surface to the lifting condensation level (LCL) and then a wet adiabatic process from the LCL to 500 hPa. A more negative value of LI indicates an unstable atmosphere. The trends of atmospheric instability parameters over India from 1996 to 2016 have been studied. LI results indicated a decreasing trend in New Delhi and Mumbai stations but other stations Kolkata, Hyderabad, Bengaluru and Chennai indicated an increasing trend. The slope of LI for the Hyderabad station is observed to be 0.15, indicating decreasing convection and local storms.17 The trends of stability indices are observed at 31 meteorological stations in India over a long period from 1980 to 2016. Some stations, including Aurangabad, Bangalore, and Nagpur, showed a decreasing trend in LI, while some stations, including Visakhapatnam, Bhopal, and Cochin, showed an increasing trend. The LI trend over Hyderabad station is found to be falling; the linear regression slope is (-0.0015), and the Mann-Kendall test Z value is (-0.2003).18 There is a negative relationship between the two pairs, one pair is LI and PW, and the other pair is LI and precipitation, as revealed by correlation studies.19
Rainfall
Rain, snow, hail, sleet, and drizzle are all forms of precipitation that fall from the atmosphere to the ground in solid or liquid form, the occurrence of rainfall is the result of atmospheric moisture and instability. The changes in climate affect the rainfall, therefore rainfall trend analysis is important to understand the influence of changes in climate on water resources planning and management. A study that analyzed trends in monsoon rainfall and overall rainy days in the monsoon season over Hyderabad, Nagpur, Bangalore, Delhi, Jaipur and Kanpur from 1951 to 2007. Hyderabad region observed a negative trend in monsoon rainfall (-5.9%) and also in the total number of rainy days (-10.4%).20 Rainfall trends over areas of the states of Andhra Pradesh and Telangana in India from 1969 to 2008 have been studied. A significant annual increasing trend was observed in relative humidity, vapor pressure and rainfall over Hyderabad. The slope observed in Hyderabad for rainfall was 10.92 mm/year.21 It was observed that rainfall over Telangana increased significantly during August, October and post-monsoon, while it decreased during September. Apart from this, there were trends observed for annual, seasonal and monthly rainfall over India from 1871 to 2005.22 It was observed that there had been a significant decline in yearly and winter, monsoon, pre-monsoon, and post-monsoon rainfall over Madhya Pradesh (1901-2011)23, but a study showed no significant trend in yearly and four seasons of rainfall over Madhya Pradesh (1951-2021).24 Karnal district of Haryana, India, witnessed a significant rising trend in minimum temperature and relative humidity from 1981 to 2011 but a significant decreasing trend in daily sunshine hours and reference evapotranspiration.25 It was found that no significant trend in annual and seasonal rainfall for Shillong (1992-2017) in Meghalaya and Agartala (1995-2019) in Tripura.26 A study in four districts of Arunachal Pradesh (1971-2007) revealed that there were no significant trends in monsoon and pre-monsoon rainfall in all four districts but a significantly negative trend was found in annual and post-monsoon rainfall except in West Siang district.27 Monthly, seasonal and annual rainfall (1871–2008) and temperature trends (1901–2003) over the Northeast region of India suggested no significant trend in monthly (except August), seasonal, and yearly rainfall while a significant rising trend was found in the mean temperature during February, August, October to December, and four seasons.28
Most previous climate studies focused on examining climate variability by analyzing trends in precipitation and temperature. This study aims to explore the time series trend analysis of LI, PW and rainfall over Hyderabad over the long period 1980 to 2023. The atmospheric water vapor and atmospheric stability patterns were analyzed using radiosonde data, and their impacts on rainfall were also investigated. Since Hyderabad is situated in a semi-arid zone, it is historically considered that life here is sustained by wells, ponds, tanks, reservoirs and lakes rather than the river. However urban expansion is causing a water crisis as lakes are drying up, affecting groundwater recharge. The urban land area in Hyderabad increased from 31.2% in 1973 to 62.87% in 2015, with an expansion rate of 5.03 square km per year.29 It is found that in Telangana and Tamil Nadu, changes in LULC, mainly caused by increasing urbanization, increased rainfall by 20 to 25% during heavy rainfall events.30 Due to persistent heavy rainfall, Hyderabad has witnessed several devastating floods in the past, including in September 1908, August 1954, July 1989, August (2000-2002, 2008), September 2016, September 2019 and October 2020, causing massive loss of life and property.31 Analyzing trends in such a rapidly growing urban area is important to understand regional climate variability and aid sustainable urban planning.
Materials and Methods
This section discusses the study area description, data source details, and the statistical methods applied for LI, PW and rainfall analysis which are described below.
Study Area
Hyderabad (urban) district is situated in India, in the state of Telangana. Geographically, the city is located on the banks of the Musi River in the northern part of the Deccan Plateau between 17.366° North latitude and 78.476° East longitude. The area of Hyderabad district is approximately 217 square kilometers. The population of Hyderabad, as recorded in the 2011 census, was 3,943,323. The altitude of Hyderabad is 536 meters, it has a climate (tropical wet and dry) and the rainfall here is 89 cm (June to September). The highest temperature during the summer is 40°C, while the lowest temperature is 22°C. The highest temperature during winter is 22°C, while the lowest temperature is 13.8°C.32 The geographical location of Hyderabad is shown in Figure 1 which was prepared with the help of QGIS software.
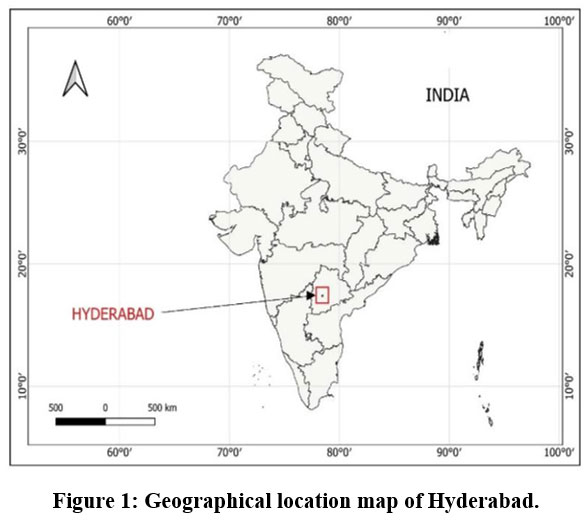 | Figure 1: Geographical location map of Hyderabad.
|
Land use land cover (LULC) data of Telangana and Hyderabad is shown in Figure 2, taken from NRSC, ISRO, Bhuvan, Thematic services, web map service and plotted in QGIS. LULC (50k) data for 2015-2016 have been downloaded from Thematic Services of Bhuvan Indian Geo platform of ISRO, NRSC.33, 34
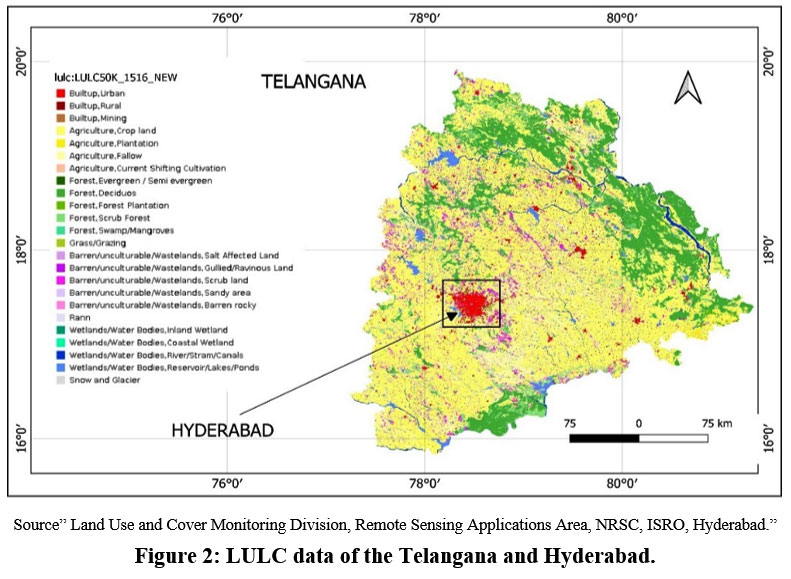 | Figure 2: LULC data of the Telangana and Hyderabad.
|
Source” Land Use and Cover Monitoring Division, Remote Sensing Applications Area, NRSC, ISRO, Hyderabad.”
Figure 2 is useful to detect development activities in different parts of the study area and to determine local and regional climatic conditions. Surface energy balance, evapotranspiration, and local climate conditions are all affected by LULC, providing a useful understanding of the interactions between land surface characteristics and climate variables in the study area. Changes in LULC can affect land surface temperature and thus have a significant effect on rainfall patterns. The total Geographical Area of Telangana state is 112079 square kilometers. The urban area is 1.67% of the total area of Telangana state while the urban area is 90.92% of the total area of Hyderabad. The LULC class distribution numerical values ??over the geographical location of Telangana and Hyderabad are presented in Tables 1 and 2 which provide clear identification of LULC information.
Table 1: LULC Information (2015-16) for Telangana
LULC Class | Area (in square kilometers) | % of the total area |
Built-up, Urban | 1866.44 | 1.67 |
Built-up, Rural | 2035.82 | 1.82 |
Building, Mining | 466.35 | 0.42 |
Agriculture, Cropland | 60442.02 | 53.93 |
Agriculture, Plantation | 1176.89 | 1.05 |
Agriculture, Fallow | 9748.65 | 8.7 |
Forest, Evergreen/Semi-evergreen | 0.13 | 0 |
Forest, Deciduous | 18014.42 | 16.07 |
Forest, Forest plantation | 354.02 | 0.32 |
Forest, Scrub Forest | 4616.13 | 4.12 |
Forest, Swamp/Mangroves | 0.03 | 0 |
Grass/Grazing | 32.48 | 0.03 |
Barren/unculturable/wastelands, Salt-affected land | 434.11 | 0.39 |
Barren/unculturable/wastelands, gullied/Ravenous land | 128.8 | 0.11 |
Barren/unculturable/wastelands, Scrub land | 5087.01 | 4.54 |
Barren/unculturable/wastelands, Sandy area | 4.99 | 0 |
Barren/unculturable/wastelands, Barren rocky | 767.26 | 0.68 |
Wetlands/Water bodies, Inland wetlands | 18.97 | 0.02 |
Wetlands/Water bodies, River/Stream/canals | 2196.58 | 1.96 |
Wetlands/Water bodies, Reservoir/Lakes/Ponds | 4687.91 | 4.18 |
Source” Land Use and Cover Monitoring Division, Remote Sensing Applications Area, NRSC, ISRO, Hyderabad.”
Table 2: LULC Information (2015-16) for Hyderabad
LULC Class | Area (in square kilometers) | % of the total area |
Built-up, Urban | 197.31 | 90.92 |
Agriculture, Cropland | 1.44 | 0.66 |
Agriculture, Fallow | 0.55 | 0.25 |
Forest, Deciduous | 0.54 | 0.25 |
Grass/ Grazing | 0.59 | 0.27 |
Barren/unculturable/wastelands, scrubland | 5.08 | 2.34 |
Wetlands/ Water Bodies, River/ Stream/ Canals | 2.63 | 1.21 |
Wetlands/ water bodies, reservoirs/lakes/ponds | 8.87 | 4.09 |
Data Sources
To determine the rainfall statistics in Hyderabad, monthly average rainfall data was acquired from the India Water Resources Information System for the period from 1980 to 2023, covering January to December.35 The rainfall data was obtained from the GRID dataset of the Indian Meteorological Department. Generally, the most radiosonde observations are taken daily at 00:00Z and 12:00Z.36 To evaluate the trends of LI and PW, daily atmospheric sounding data for LI and PW at 00:00Z for the same period were obtained from the Wyoming Weather Web of the University of Wyoming.37 The radiosonde data description, processing and analysis have been discussed in the study.38 Monthly average data were calculated to analyze trends in LI and PW. Rainfall, LI, and PW data have been studied based on monthly, annual, and seasonal.
Rainfall, LI and PW Trends Analysis
The trend analysis for LI, PW and rainfall was carried out employing Mann Kendall test statistics and the trend's slope was determined using linear regression statistics. Both statistics are described below.
Mann Kendall Test
It is a non-parametric statistical test that identifies patterns in time series data. The Mann-Kendall test is utilized to understand the decreasing or increasing trend of time series data to statistically identify variation in long-term temporal data.39, 40 The Mann–Kendall statistics calculation flowchart is shown in Figure 3.
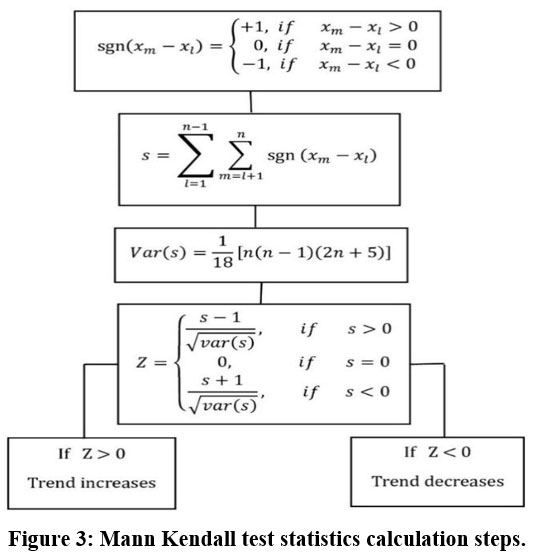 | Figure 3: Mann Kendall test statistics calculation steps.
|
In Figure 3, n represents the total number of data points; xm and xl represent the data values ??in time series m and l, where m > l. If Z is greater than zero then the trend increases and if Z is less than zero which is negative then the trend decreases. The tests are performed at a specified significance level. For this analysis, a trend test was performed at the 5% significance level. The trend test is based on the alternative hypothesis (H1) and the null hypothesis (Ho), the alternative hypothesis indicates that the data have a significant increasing or decreasing trend and the null hypothesis states that there is no trend.
Interpretation of the test based on Z and P values
The critical value of Z at a 5% significance level for a two-tailed test is 1.96. So, the decision rule is: accept the alternative hypothesis if Z ? -1.96 or if Z ? 1.96.41 Trends can also be identified based on the P-value. P-values are calculated corresponding to different Z values. If the value of P ? 0.05 then H1 is accepted and it is found that a trend exists.
Regression Analysis
The magnitude and direction of the trend have been calculated using the linear regression equation. The equation commonly used to define the linear regression model is Y = m X + C. The dependent variable in this study is denoted as Y, which represents rainfall/LI/PW. The independent variable is represented as X, which represents time in months/years. The line slope is denoted as m, and the intercept constant coefficient is denoted as C.
Results
Results of the statistical analysis of rainfall, LI and PW data for the period 1980-2023 over Hyderabad are discussed below.
Lifted Index (LI)
Statistical details (Z values, P values, and regression slopes) for LI trends are discussed in this section. The LI trend for each month for the period 1980 to 2023 is shown in Figures 4 and 5. The average monthly LI regression analysis is shown in Figure 4. These results show that the linear regression slope was positive only in February with a value of 0.004 oC/year. The slope values were negative for the other months. This slope represents the monthly LI increasing or decreasing trend rate per year. Figure 5 shows linear regression analysis for annual and seasonal LI data, the linear regression slope is negative, as shown in Table 3, representing a decreasing annual LI trend.
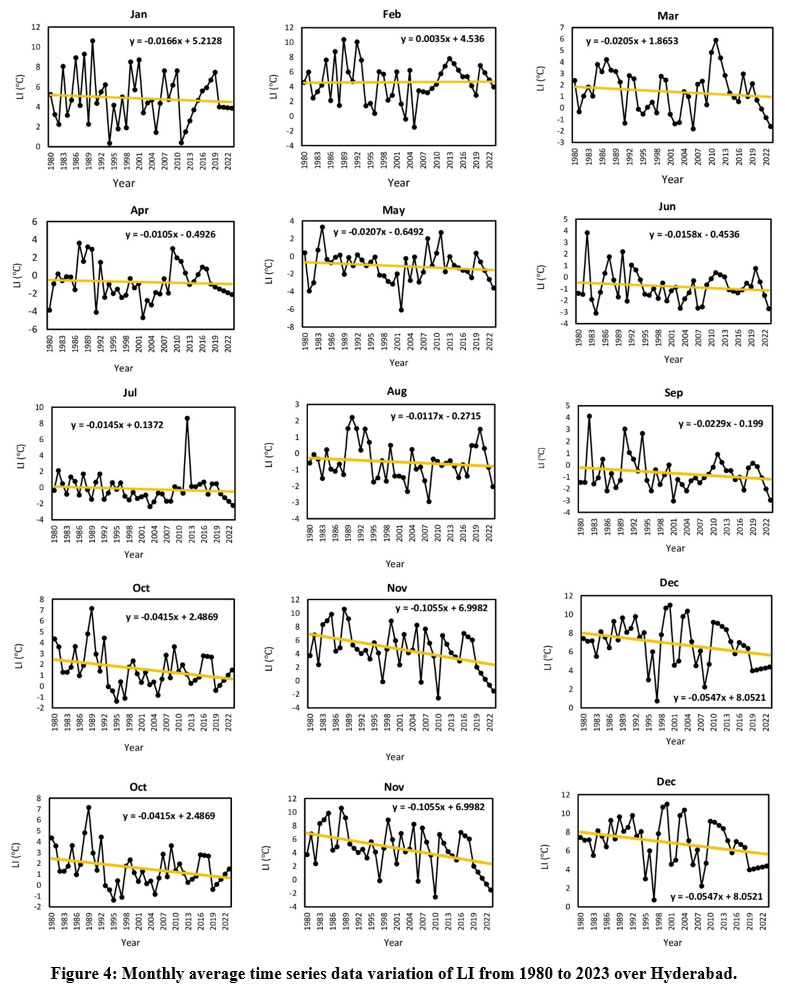 | Figure 4: Monthly average time series data variation of LI from 1980 to 2023 over Hyderabad.
|
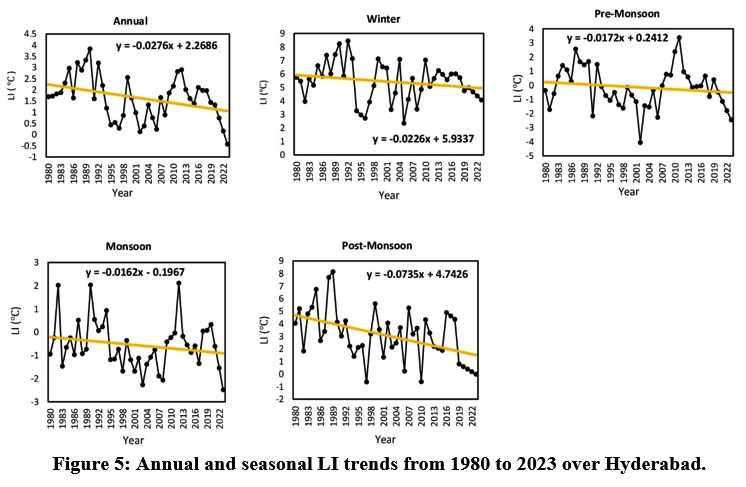 | Figure 5: Annual and seasonal LI trends from 1980 to 2023 over Hyderabad.
|
The calculated Z values, P values, and line slopes are presented in Table 3. Significant negative trends are observed in November and December as the value of Z < (-1.96), the P value < 0.05, and the regression slope is negative. Similarly, a negative trend is observed in the post-monsoon and annual as shown in Table 3.
Table 3: Result of Mann-Kendall test and linear regression analysis for LI over Hyderabad (A: accept, R: reject).
Z | P | Slope | H1 | |
January | -0.334 | 0.739 | -0.017 | R |
February | 0.425 | 0.671 | 0.004 | R |
March | -1.335 | 0.182 | -0.021 | R |
April | -0.546 | 0.585 | -0.011 | R |
May | -1.285 | 0.199 | -0.021 | R |
June | -0.152 | 0.879 | -0.016 | R |
July | -1.639 | 0.101 | -0.015 | R |
August | -0.678 | 0.498 | -0.012 | R |
September | -0.111 | 0.911 | -0.023 | R |
October | -1.659 | 0.097 | -0.042 | R |
November | -2.68 | 0.007 | -0.106 | A |
December | -2.175 | 0.03 | -0.055 | A |
Yearly | -2.154 | 0.031 | -0.028 | A |
Winter | -1.355 | 0.175 | -0.023 | R |
Pre-monsoon | -1.102 | 0.27 | -0.017 | R |
Monsoon | -0.86 | 0.39 | -0.016 | R |
Post-monsoon | -2.802 | 0.005 | -0.074 | A |
Precipitable Water (PW)
Statistical details (Z values, P values, and regression slopes) for PW trends are discussed in this section. Figures 6 and 7 show linear regression analysis for monthly, annual and seasonal time series trends of PW data, the linear regression slope is positive, shown in Table 4, representing an increasing monthly, annual and seasonal PW trend. The maximum positive linear regression slope was observed in November with a value of 0.3441 mm/year. This positive slope represents increasing trends of PW over Hyderabad.
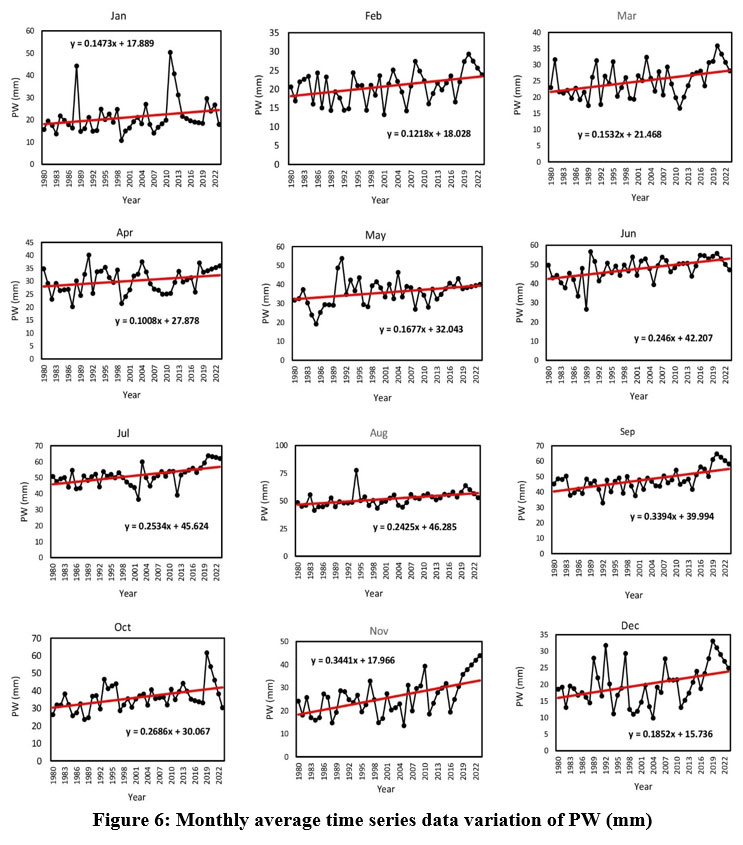 | Figure 6: Monthly average time series data variation of PW (mm)
|
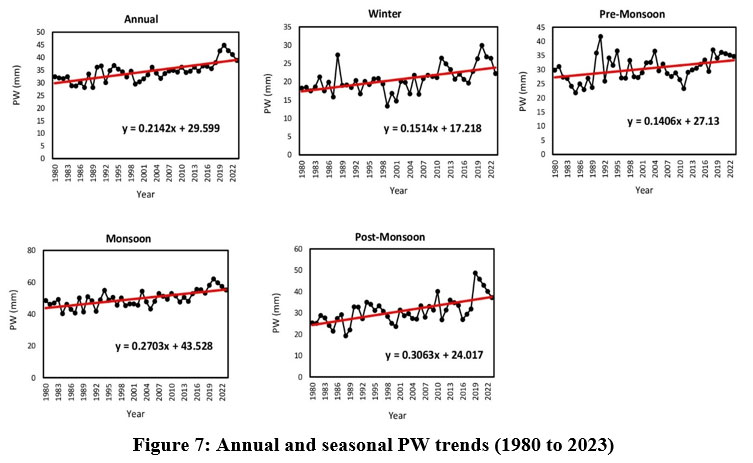 | Figure 7: Annual and seasonal PW trends (1980 to 2023).
|
The calculated Z values, P values, and line slopes of PW are presented in Table 4. Significant positive trends were observed in all months, annually and four seasons as the value of Z > 1.96, the calculated P value < 0.05 and the regression slope is positive.
Table 4: Result of Mann-Kendall test and linear regression analysis for PW over Hyderabad.
Z | P | Slope | H1 | |
January | 2.0531 | 0.04 | 0.1473 | A |
February | 2.4375 | 0.0147 | 0.1218 | A |
March | 2.7005 | 0.0069 | 0.153 | A |
April | 2.0329 | 0.042 | 0.1008 | A |
May | 2.4375 | 0.0148 | 0.1677 | A |
June | 3.631 | 0.0003 | 0.246 | A |
July | 4.1165 | 3.85e-05 | 0.2534 | A |
August | 4.6829 | 2.83e-06 | 0.242 | A |
September | 3.813 | 0.0001 | 0.339 | A |
October | 2.66 | 0.0078 | 0.2686 | A |
November | 3.7119 | 0.0002 | 0.3441 | A |
December | 2.5589 | 0.0105 | 0.1852 | A |
Yearly | 4.9054 | 9.32e-07 | 0.2142 | A |
Winter | 4.1974 | 2.70e-05 | 0.1514 | A |
Pre-monsoon | 3.0848 | 0.002 | 0.1406 | A |
Monsoon | 4.6626 | 3.12e-06 | 0.2703 | A |
Post-monsoon | 3.9546 | 7.66e-05 | 0.3063 | A |
Rainfall
Statistical details (Z values, P values, and regression slopes) for rainfall trends are discussed in this section. Figures 8 and 9 show linear regression analysis for monthly, seasonal and annual average time series rainfall data, the positive and negative linear regression slope is observed shown in Table 5, representing an increasing and decreasing rainfall trend. The maximum positive linear regression slope was observed in September (1.9984), annual (3.3164) and monsoon (3.103). The maximum negative linear regression slope was observed in November (-0.678).
.jpg) | Figure 8: Monthly average time series data variation of rainfall (mm) from 1980 to 2023
|
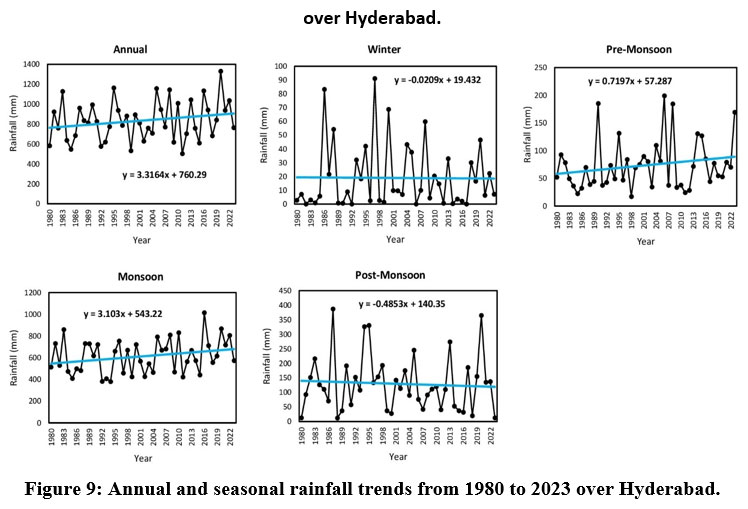 | Figure 9: Annual and seasonal rainfall trends from 1980 to 2023 over Hyderabad.
|
The calculated Z values, P values, and rainfall line slopes are presented in Table 5. No significant trend was found in monthly, annual and seasonal rainfall as the value of Z is less than 1.96 and greater than -1.96, the value of P is also greater than 0.05. There is a positive trend in September at a 10% significance level as the value of Z > 1.645 and the value of P < 0.10.
Table 5: Result of Mann-Kendall test and linear regression analysis for Rainfall over Hyderabad.
Z | P | Slope | H1 | |
January | 0.3944 | 0.6932 | -0.025 | R |
February | 0.8698 | 0.3843 | 0.0088 | R |
March | -0.3438 | 0.7309 | -0.0112 | R |
April | 1.4463 | 0.148 | 0.394 | R |
May | 1.5879 | 0.1123 | 0.3368 | R |
June | -0.1112 | 0.9114 | -0.0032 | R |
July | 0.4247 | 0.6709 | 0.5607 | R |
August | 0.3742 | 0.7082 | 0.5472 | R |
September | 1.952 | 0.0509 | 1.9984 | R |
October | -0.1517 | 0.8794 | 0.1927 | R |
November | -0.9608 | 0.3366 | -0.678 | R |
December | 0.4349 | 0.6636 | -0.0047 | R |
Yearly | 1.0822 | 0.2791 | 3.3164 | R |
Winter | 0.5765 | 0.5642 | -0.0209 | R |
Pre-monsoon | 1.2845 | 0.1989 | 0.7197 | R |
Monsoon | 1.4665 | 0.1449 | 3.103 | R |
Post-monsoon | -0.4753 | 0.6345 | -0.4853 | R |
It was observed from Tables 3, 4 and 5 that there is a negative trend in annual LI (-0.028 oC/year) and a positive trend in annual PW (0.2142 mm/year) at a 5% significance level. A positive slope (3.3164 mm/year) was observed in annual rainfall, but no significant trend was found. Significant negative trends were found in November (-0.106 oC/year), December (-0.055 oC/year) and annual (-0.028 oC/year) LI. The negative trend of LI showed a higher amount of water vapor in the atmosphere. Significant positive trends were found in November (0.3441 mm/year), December (0.1852 mm/year), and annual (0.2142 mm/year) PW. When the LI trend is negative then PW shows a positive trend.
Monthly Average Time Series Trend Analysis of LI, PW and Rainfall
The monthly average time series trend of LI, PW, and rainfall was also analyzed and its time series variations are shown in Figure 10. Monthly average time series statistical details of LI, PW and rainfall are represented in Table 6.
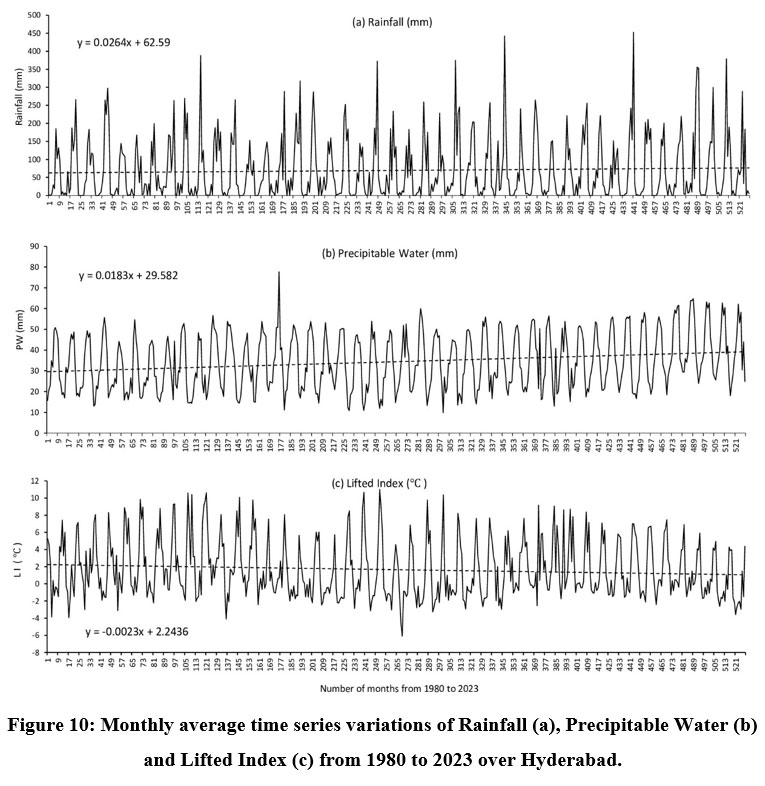 | Figure 10: Monthly average time series variations of Rainfall (a), Precipitable Water (b) and Lifted Index (c) from 1980 to 2023 over Hyderabad.
|
Table 6: Statistical details of LI, PW and rainfall.
Statistics | LI | PW | Rainfall |
Z value | -2.3161 | 4.8835 | 0.7227 |
P value | 0.02055 | 1.0417e-06 | 0.4698 |
Slope | -0.0023 | 0.0183 | 0.0264 |
Min | -6.0769 | 9.8453 | 0 |
Max | 11 | 77.7107 | 452.32 |
Mean | 1.6472 | 34.4173 | 69.5756 |
Median | 0.5721 | 32.5456 | 32.49 |
Standard deviation | 3.3645 | 13.4499 | 85.32 |
The mean value of LI, PW and rainfall for monthly average time series variation was observed to be (1.6472 oC), (34.4173 mm) and (69.5756 mm), respectively. A negative trend was found in LI (-0.0023 oC/year) and a positive trend in PW (0.0183 mm/year) at a 5% significance level. A positive slope (0.0264 mm/year) was observed in rainfall, but no significant trend was found.
LI, PW and Rainfall Variations with Respect to the Month, Year and Seasons
Statistical details (minimum, maximum, mean, median and standard deviation) of LI, PW and rainfall data are shown in Tables 7, 8 and 9. The average value of LI was found to be negative during April-September, pre-monsoon and monsoon. The minimum negative average value of LI observed in May is (-1.11 oC). The maximum positive average value of LI observed in December is 6.82 oC. The annual mean value of LI is 1.65 oC and the annual standard deviation of LI is observed to be 0.99 oC. Hyderabad showed a significant downward trend in the annual average LI, with a minimum annual average LI of -0.42 oC in 2023 and a maximum annual average LI of 3.84 oC in 1990.
Table 7: Details of LI data analysis for the long period 1980 to 2023 over Hyderabad.
LI | Min | Max | Mean | Median | Standard deviation |
January | 0.36 | 10.63 | 4.84 | 4.53 | 2.43 |
February | -1.48 | 10.4 | 4.61 | 4.64 | 2.61 |
March | -1.81 | 5.9 | 1.4 | 1.18 | 1.86 |
April | -4.69 | 3.61 | -0.73 | -0.96 | 1.94 |
May | -6.08 | 3.31 | -1.11 | -1.07 | 1.73 |
June | -3.11 | 3.83 | -0.81 | -1.1 | 1.37 |
July | -2.38 | 8.62 | -0.19 | -0.62 | 1.73 |
August | -2.95 | 2.2 | -0.53 | -0.67 | 1.12 |
September | -3.03 | 4.13 | -0.71 | -1.07 | 1.44 |
October | -1.39 | 7.14 | 1.55 | 1.27 | 1.72 |
November | -2.54 | 10.58 | 4.63 | 4.59 | 3.07 |
December | 0.75 | 11 | 6.82 | 7.12 | 2.33 |
Yearly | -0.42 | 3.84 | 1.65 | 1.66 | 0.99 |
Winter | 2.35 | 8.45 | 5.43 | 5.65 | 1.45 |
Pre-monsoon | -4.05 | 3.39 | -0.15 | -0.14 | 1.47 |
Monsoon | -2.48 | 2.11 | -0.56 | -0.7 | 1.05 |
Post-monsoon | -0.63 | 8.15 | 3.09 | 3.19 | 2.07 |
Maximum average PW (49.61 mm) was observed in monsoon. The average value of PW for June, July, August and September is more than 40 mm. The minimum average value of PW observed in December is 19.9 mm. The annual average value of PW is 34.42 and the standard deviation of PW is observed to be 3.81 for the annual. Hyderabad witnessed a significant rise in annual average PW, with the minimum and maximum annual average PW being 28.14 mm in 1989 and 44.85 mm in 2020, respectively.
Table 8: Details of PW data analysis for the long period 1980 to 2023 over Hyderabad.
PW | Min | Max | Mean | Median | Standard deviation |
January | 10.75 | 50.35 | 21.2 | 19.13 | 7.82 |
February | 13.27 | 29.33 | 20.77 | 21.25 | 4.12 |
March | 16.6 | 35.88 | 24.92 | 24.16 | 4.81 |
April | 20.22 | 40.19 | 30.15 | 29.96 | 4.67 |
May | 19.17 | 53.78 | 35.82 | 37.42 | 6.71 |
June | 26.7 | 56.67 | 47.74 | 49.25 | 6.04 |
July | 36.57 | 63.82 | 51.33 | 51.07 | 6.04 |
August | 41.56 | 77.71 | 51.74 | 51.59 | 6.36 |
September | 32.99 | 64.79 | 47.63 | 47.57 | 6.95 |
October | 23.66 | 61.63 | 36.11 | 35.39 | 7.33 |
November | 13.51 | 43.96 | 25.71 | 24.91 | 7.64 |
December | 9.85 | 33.09 | 19.9 | 19.02 | 6.05 |
Yearly | 28.14 | 44.85 | 34.42 | 34.5 | 3.81 |
Winter | 13.4 | 29.98 | 20.62 | 20.25 | 3.52 |
Pre-monsoon | 21.85 | 41.77 | 30.29 | 29.75 | 4.48 |
Monsoon | 40.35 | 62.06 | 49.61 | 49.03 | 5.04 |
Post-monsoon | 19.22 | 48.72 | 30.91 | 30.24 | 6.15 |
The maximum average rainfall (613.04 mm) was observed in monsoon. The average value of rainfall was found to be higher during June-October. The minimum mean value of rainfall in December is 4.69 mm.
Table 9: The details of rainfall data analysis over Hyderabad from 1980 to 2023.
Rainfall | Min | Max | Mean | Median | Standard deviation |
January | 0 | 51.11 | 7.46 | 0.7 | 13.09 |
February | 0 | 64.55 | 6.82 | 0 | 14.85 |
March | 0 | 151.16 | 16.43 | 5.37 | 26.96 |
April | 1.36 | 83.93 | 24.87 | 21.49 | 18.89 |
May | 0 | 152.8 | 32.18 | 21.29 | 29.97 |
June | 35.91 | 202.85 | 113.53 | 115.7 | 49.29 |
July | 39.76 | 387.91 | 168.73 | 148.46 | 88.59 |
August | 33.2 | 442.26 | 172.14 | 153.5 | 77.96 |
September | 35.38 | 452.32 | 158.63 | 140.03 | 88.69 |
October | 0 | 352.67 | 105.1 | 90.78 | 88.06 |
November | 0 | 263.09 | 24.33 | 11.26 | 42.68 |
December | 0 | 40 | 4.69 | 0.12 | 9.41 |
Yearly | 503.09 | 1331.79 | 834.91 | 811.5 | 198.58 |
Winter | 0 | 91.11 | 18.96 | 8.06 | 23.53 |
Pre-monsoon | 17.08 | 199.23 | 73.48 | 69.36 | 45.47 |
Monsoon | 381.21 | 1014.85 | 613.04 | 595.85 | 155.44 |
Post-monsoon | 12.05 | 387.37 | 129.43 | 112.34 | 95.93 |
The study area witnessed a non-significant rising trend in annual average rainfall, with the minimum and maximum annual average rainfall found to be 503.09 mm in 2011 and 1331.79 mm in 2020, respectively.
In this work, box and whisker plots have been employed to examine the distribution of LI, PW and rainfall data in different months and seasons. In this box whisker plot, the mean value is shown as a cross (x), outlier data points are represented by dots (o), and the median value is shown as a horizontal bar inside the box. For monthly average analysis from 1980 to 2023, a box whisker diagram of LI, PW and rainfall over Hyderabad is presented in Figure 11.
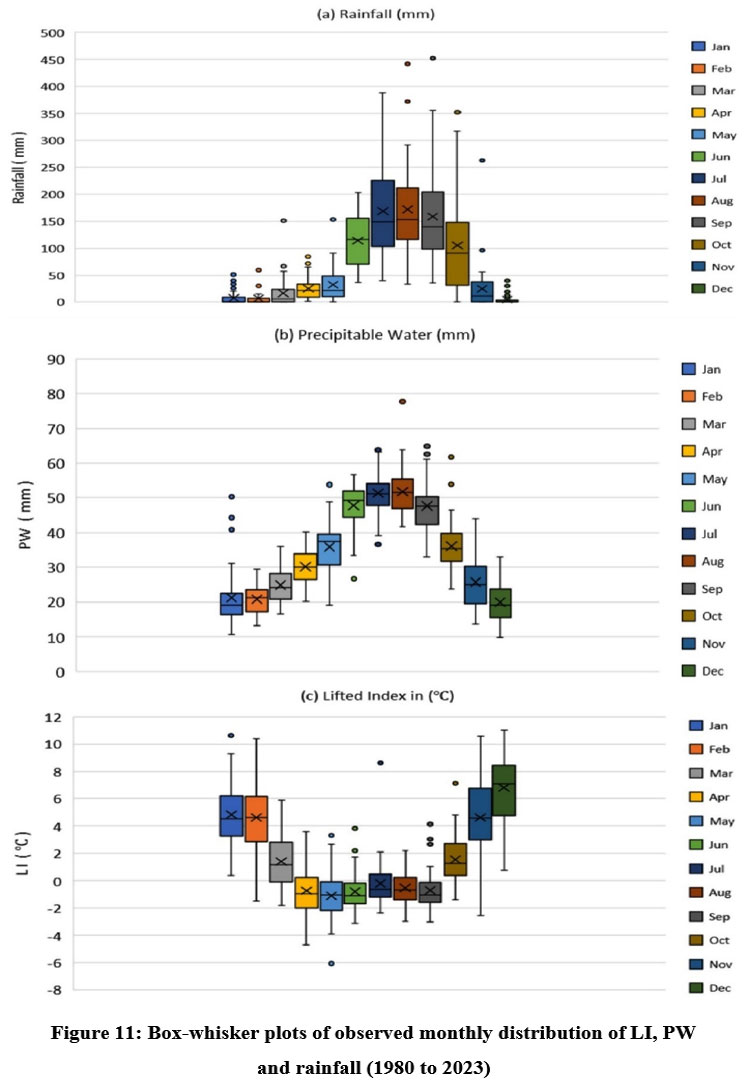 | Figure 11: Box-whisker plots of observed monthly distribution of LI, PW and rainfall (1980 to 2023)
|
Figure 11 explains the monthly rainfall pattern, which shows that the study area receives maximum rainfall from June to October. It is also observed that PW is more in the monsoon season (June–September) compared to other months. More negative LI values were observed in April and May. As shown in Figure 11, rainfall in the growing season increases from March to July and then decreases at August. Similarly, it was observed that PW increases from March to August and then decreases at September. Whereas LI decreases from March to June and after increasing in July, decreases till September and then starts increasing from October to December. For seasonal and annual analysis of LI, PW and rainfall from 1980 to 2023, a box whisker diagram over Hyderabad is presented in Figure 12.
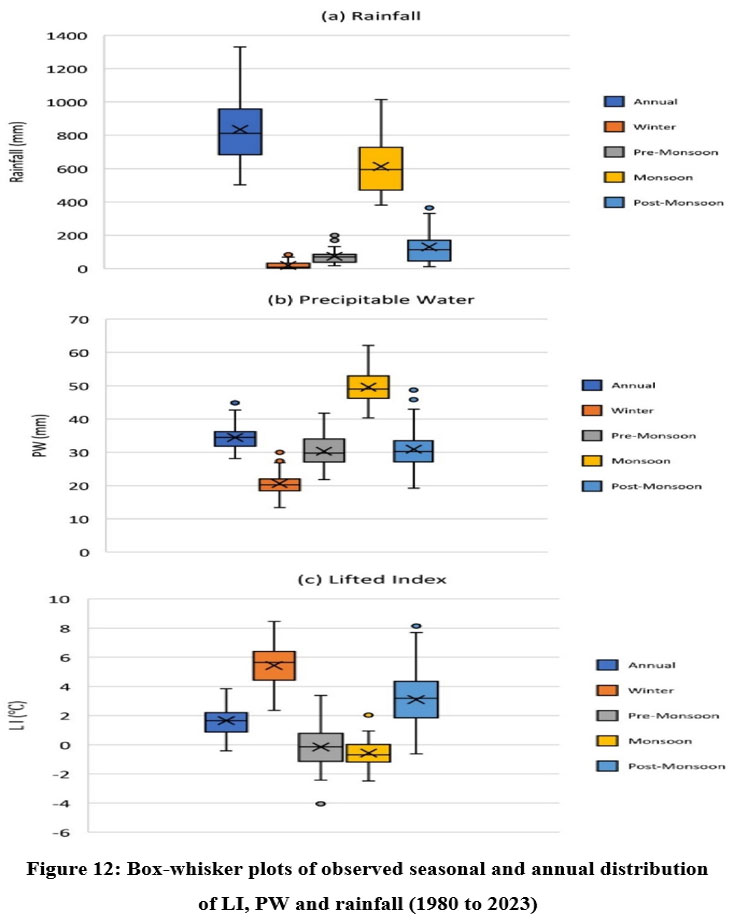 | Figure 12: Box-whisker plots of observed seasonal and annual distribution of LI, PW and rainfall (1980 to 2023)
|
It is seen from Figures 11 and 12 that when the LI value was more positive and the PW value was less positive, then rainfall decreased. Maximum rainfall was observed during monsoon season when LI is more negative and PW is more than 40 mm. It was found that PW is positively related to rainfall. While LI has a negative relationship with PW and rainfall.
Discussion
The trend analysis of LI, PW, and rainfall provides significant insights into the atmospheric and hydrological dynamics of the region. Based on the monthly average time series trend analysis in the present work, it was observed from Figure 10 and Table 6 that there was a significant decreasing trend in LI, a significant increasing trend in PW and a non-significant increasing trend in rainfall. It was also observed from Tables 3, 4 and 5 that there was a significant decreasing trend in annual LI (which indicates an increase in atmospheric instability) and a significant rising trend in annual PW (which indicates an increase in atmospheric moisture content) but, annual rainfall witnessed a non-significant increasing trend (suggesting that the overall rainfall pattern over Hyderabad may be increasing).
Tables 3, 4 and 5 show that there was a significant positive trend in PW during winter and post-monsoon seasons, a significant negative trend in LI during post-monsoon seasons, but there was a non-significant negative trend in rainfall during winter and post-monsoon seasons. This negative trend in winter and post-monsoon rainfall is of particular concern because these seasons are crucial for groundwater recharge and sustaining water levels in reservoirs and rivers. This information may be useful, particularly in water resource management and the agriculture sectors.
Significant negative trends were observed in LI and significant positive trends were observed in PW in November, December, post-monsoon and annually, implying that when the trend of LI is negative the PW shows a positive trend. The negative trend of LI indicated a high amount of water vapor in the atmosphere.
A significant positive and a non-significant positive trend were found in monthly, annual and seasonal PW and rainfall respectively over Hyderabad (1980-2023). A similar result has found that PW exhibited a positive trend during the season of pre-monsoon and monsoon over India.42 It was also found that globally PW has increased by about 2% per decade from 1993 to 2021.43 A study reported that a significant rising trend in annual rainfall, while no significant trend in monsoon rainfall in Hyderabad from 1901 to 2002.44 A significant increasing trend is seen in rainfall only in August over Telangana (1871-2008), while spatial variability in rainfall trend was found to increase during June-August and monsoon but found a decreasing trend in September.45 A study found no significant rising trend on days when rainfall is heavy i.e. ?65 mm and very-heavy rainfall days (?125 mm) during the southwest monsoon season in Hyderabad from 1969 to 2008 but, the trend in heavy rainfall days showed a significant positive in August and a significant negative trend in September.46 Regarding September, an increasing trend was observed in rainfall, PW and a decreasing trend was observed in LI (at 10% significance level), which indicates increasing instability, water vapor and increasing rainfall which suggests that there may be more rainfall during this month. The change in rainfall patterns will have an impact on agricultural production (crops grown using irrigation) and water availability in other sectors.
The average annual rainfall in Hyderabad from 1980 to 2023 was found to be 834.91 mm, of which the northeast monsoon contributes 16.05% and the southwest monsoon contributes 73.56%. Tables 7, 8 and 9 showed that rainfall in (June-October) was more than 100 mm, in PW (June-September) was more than 40 mm and the value of LI was more negative in pre-monsoon and monsoon months.
The urbanized area of Hyderabad has increased drastically over the last few decades. The present study found that due to increasing urbanization, LI witnessed a significant increase in atmospheric instability (severe weather activity, flooding and heavy rainfall), PW witnessed a significant increase in atmospheric water vapor and a non-significant increase in rainfall patterns, which can affect the agricultural yields and other water-dependent processes such as landslides, soil moisture, floods, groundwater reserves. Similarly, several studies have found that changes in LULC due to urbanization have increased the frequency and intensity of heavy rainfall events.47, 48
Conclusion
This study examined the patterns of LI, PW, and precipitation over a 44-year period (1980-2023) utilising Mann-Kendall and linear regression analyses. The trend of annual LI data has dramatically declined. The annual LI declining rate trend was measured at (-0.028 oC/year), signifying heightened convection and localised storms. We noted an upward trend in the annual PW data. The annual PW rising rate trend was 0.2142 mm/year, attributed to a recent rise in surface temperature, resulting in increased atmospheric moisture. The rise in PW may influence local and regional climates, as PW is associated with temperature and climate change via atmospheric water vapour. No trend in annual rainfall was found. The average monthly and seasonal LI trends diminished in November, December, and the post-monsoon period. The average monthly and seasonal PW trends rose in every month and all four seasons. No trend is noticed in the average monthly and seasonal rainfall during all months and four seasons. Monthly average time series analysis indicated a considerable upward trend in PW (0.0183 mm/year), a negative trend in LI (-0.0023 oC/year), and no discernible trend in rainfall. The monthly average time series regression slope for rainfall is 0.0264 mm per year. All aforementioned results are computed using a 5% significance threshold. In September, a positive rainfall trend of 1.9984 mm/year was noted at a 10% significance level. This study may be crucial for comprehending atmospheric moisture content, fluctuations in atmospheric instability, and precipitation patterns in Hyderabad. This may have significant ramifications for predicting rainfall and severe weather, which can subsequently benefit several industries, including agriculture, water resource management, and disaster preparedness.
Acknowledgement
The authors are very grateful to India WRIS for providing rainfall data, the University of Wyoming for providing atmospheric LI and PW data. We have used the Land Use / Land Cover information on our research work from Land Use and Cover Monitoring Division, Remote Sensing Applications Area, the Natural Resources Census Project of National Remote Sensing Centre (NRSC), ISRO, Hyderabad, India and we are thankful to them.
Funding Sources
The author(s) received no financial support for the research, authorship, and/or publication of this article.
Conflict of Interest
The authors do not have any conflict of interest.
Data Availability Statement
The PW and LI datasets generated and/or analyzed during the current study are available in the (Wyoming Weather Website) repository, (https://weather.uwyo.edu/upperair/sounding.html). Rainfall data has been collected from the India WRIS website. Rainfall data is available via the India WRIS (https://indiawris.gov.in/wris/#/rainfall). Land use Land cover data has been collected from the Bhuvan website (https://shuvan-app1.nrsc.gov.in/thematic/thematic/index.php).
Ethics Statement
This research did not involve human participants, animal subjects, or any material that requires ethical approval.
Informed Consent Statement
This study did not involve human participants, and therefore, informed consent was not required.
Clinical Trial Registration
This research does not involve any clinical trials.
All authors contributed in conceptualizing the idea. Material preparation, data collection and analysis were performed by Mr. Mohammad Taiyab and Dr. Md Khaleelur Rahiman. The first draft of the manuscript was written by Mr. Mohammad Taiyab. Dr. Rizwan Ul Haq Ansari was involved in the analysis of results and writing of the revised drafts of the manuscripts. Prof. Hakeem Aleem Basha and Dr. Maniyar Shanawaz Begum critically reviewed the results and suggested feedback on the manuscript. All authors read and approved the final manuscript.
References
- Helsel D. R., Hirsch R. M. Statistical Methods in Water Resources. USGS. 1992; 04(A3): 1-510. https://doi.org/10.3133/twri04A3.
CrossRef - Douglas E. M., Vogel R. M., Kroll C. N. Trends in floods and low flows in the United States: impact of spatial correlation. J Hydrol. 2000; 240(1-2): 90–105. https://doi.org/10.1016/S0022-1694(00)00336-X.
CrossRef - Hirsch R. M., Slack J. R., Smith R. A. Techniques of trend analysis for monthly water quality data. Water Resour Res. 1982; 18(1): 107–121. https://doi.org/10.1029/WR018i001p00107.
CrossRef - Chebana F., Aissia M. A. B., Ouarda T. B. M. J. Multivariate shift testing for hydrological variables, review, comparison and application. J Hydrol. 2017; 548(1): 88–103. https://doi.org/10.1016/j.jhydrol.2017.02.033.
CrossRef - Lettenmaier D., Wood E., and Wallis J. Hydro-climatological trends in the continental United States, 1948-88. J Climate. 1994; 7(4): 586–607. https://doi.org/10.1175/1520-0442(1994)007<0586:HCTITC>2.0.CO;2.
CrossRef - Jade S., Shrungeshwara T. S., Anil B. Water vapor study using MODIS and GPS data at 64 continuous GPS stations (2002–2017) in Indian subcontinent. J Atmos Sol Terr Phys. 2019; 196(105138): 1-12. https://doi.org/10.1016/j.jastp.2019.10513 8.
CrossRef - Mishra A. K. Variability of integrated precipitable water over India in a warming climate. Meteorol Appl. 2020; 27(e1869): 1-4. https://doi.org/10.1002/met.1869.
CrossRef - Patel V. K., Kuttippurath J. Significant increase in water vapour over India and Indian Ocean: Implications for tropospheric warming and regional climate forcing. Sci Total Environ. 2022; 838(1): 1-32. https://doi.org/10.1016/j.scitotenv.2022.155885.
CrossRef - Sarkar S., Kuttippurath J., Patel V. K. Long-term changes in precipitable water vapour over India derived from satellite and reanalysis data for the past four decades (1980–2020). Environ Sci Atmos. 2023; 3(4): 749-759. https://doi.org/10.1039/D2EA00139J.
CrossRef - Jindal P., Thapliyal P. K., Shukla M. V., Sharma S. K., Mitra D. Trend analysis of atmospheric temperature, water vapour, ozone, methane and carbon-monoxide over few major cities of India using satellite data. J Earth Syst Sci. 2020; 129(60): 1-17. https://doi.org/10.1007/s12040-019-1325-0.
CrossRef - Showalter A. K. A stability index for thunderstorm forecasting. Bull Amer Meteor Soc. 1953; 34(6): 250-252. https://doi.org/10.1175/1520-0477-34.6.250.
CrossRef - Galway J. G. The lifted index as a predictor of latent instability. Bull Amer Meteor Soc. 1956; 37(10): 528-529. https://doi.org/10.1175/1520-0477-37.10.528.
CrossRef - George J. J. Weather Forecasting for Aeronautics. New York, Academic Press. 1960; 407-415. https://doi.org/10.1016/C2013-0-12567-6.
CrossRef - Miller R. C. Notes on Analysis and Severe-Storm Forecasting Procedures of the Air Force Global Weather Central. Air Weather Service United States Air Force. 1972; 200: 1-177. https://apps.dtic.mil/sti/pdfs/AD0744042.pdf.
- Ferguson E. W., Ostby F. P., Leftwich Jr. P. W., Carle W. E., Corfidi S. F., Cundy R. G., and Hirt W. D. The tornado season of 1983. Mon Wea Rev. 1985; 113(3): 395-404. https://doi.org/10.1175/1520-0493(1985)113%3C0395:TTSO%3E2.0.CO;2.
CrossRef - Taiyab M., Ansari R. U. H., Rahiman M. K., and Basha H. A. Significance of the Lifted Index in Atmosphere. Int J Ecol Environ Sci. 2024; 50(2):167-175. https://doi.org/10.55863/ijees.2024.3286.
CrossRef - Parveen T., Rehman M. K., Basha H. A. Comparative Study of Trends, Seasonality and Distribution of Atmospheric Instability Parameters over India during 1996-2016. In: Anuradha M, Gayathiri E, Gupta A, Jayarajan D, Sarma B. K. eds. Contemporary Research in Environmental Science, Management, IT, Pharmaceutical and Social Sciences. First volume. Karnataka, India: Selfypage Developers Private Limited; 2022: 1-15.
- Rahiman M. K., Basha H. A., Thyagarajan K. Trends of stability Indices over different meteorological stations of India by using IGRA radiosonde data. J Emerg Technol Innov Res. 2017; 4(12): 513-518. https://www.jetir.org/papers/JETIR1712095.pdf.
- Taiyab M., Ansari R. U. H., Rahiman M. K., Basha H. A. Impact of Surface Dew Point Temperature, Precipitable Water and the Lifted Index on the Precipitation over Hyderabad (India). Curr World Environ. 2024; 19(1): 207-219. http://dx.doi.org/10.12944/CWE.19.1.19.
CrossRef - Kharol S. K., Kaskaoutis D. G., Sharma A. R., Singh R. P. Long-term (1951–2007) rainfall trends around six Indian cities: current state, meteorological, and urban dynamics. Adv Meteorol. 2013; 2013(1):1-15. https://doi.org/10.1155/2013/572954.
CrossRef - Jyothy S. A., Murthy D. S., Mallikarjuna P. Climate change impacts on seasonal rainfall trends in the regions of Andhra Pradesh and Telangana states, India. J Inst Eng India Ser A. 2021; 102(3): 673-685. https://doi.org/10.1007/s40030-021-00545-w.
CrossRef - Kumar V., Jain S. K., Singh Y. Analysis of long-term rainfall trends in India. Hydrol Sci J. 2010; 55(4): 484-496. https://doi.org/10.1080/02626667.2010.481373.
CrossRef - Kundu S., Khare D., Mondal A., Mishra P. K. Analysis of spatial and temporal variation in rainfall trend of Madhya Pradesh, India (1901–2011). Environ Earth Sci. 2015; 73(2): 8197–8216. https://doi.org/10.1007/s12665-014-3978-y.
CrossRef - Kumar A., Kumar S., Rautela K. S., Shekhar S., Ray T. Thangavel M. Assessing seasonal variation and trends in rainfall patterns of Madhya Pradesh, Central India. J Water Clim Chang. 2023; 14(10): 3692–3712. https://doi.org/10.2166/wcc.2023.280.
CrossRef - Patle G. T., Singh D. K., Sarangi A., Rai A., Khanna M., Sahoo R. N. Temporal variability of climatic parameters and potential evapotranspiration. Indian J Agric Sci. 2013; 83(5): 518-524. https://epubs.icar.org.in/index.php/IJAgS/article/view/29637.
- Sangma M. L. K., Reang H., Patle G. T., Dabral P. P. Variability and Trend Analysis of Rainfall Data of Shillong and Agartala Stations of North East India. Int J Environ Clima Chang. 2020; 10(11): 134–142. https://doi.org/10.9734/ijecc/2020/v10i1130273.
CrossRef - Patle G. T., Libang A. Trend analysis of annual and seasonal rainfall to climate variability in North-East region of India. J Appl Nat Sci. 2014; 6(2): 480-483. https://doi.org/10.31018/jans.v6i2.486.
CrossRef - Jain S. K., Kumar V., Saharia M. Analysis of rainfall and temperature trends in northeast India. Int J Climatol. 2013; 33(4): 968-978. https://doi.org/10.1002/joc.3483.
CrossRef - Sannigrahi S., Rahmat S., Chakraborti S., Bhatt S., Jha S. Changing dynamics of urban biophysical composition and its impact on urban heat island intensity and thermal characteristics: the case of Hyderabad City, India. Model Earth Syst Environ. 2017; 3(2): 647-667. https://doi.org/10.1007/s40808-017-0324-x.
CrossRef - Boyaj A., Dasari H. P., Hoteit I., Ashok K. Increasing heavy rainfall events in South India due to changing land use land cover. Q J R Meteorol Soc. 2020; 146 (732): 3064-3085. https://doi.org/10.1002/qj.3826.
CrossRef - Rangari V. A., Bhatt C. M., Umamahesh N. V. Rapid Assessment of The October 2020 Hyderabad Urban Flood and Risk Analysis Using Geospatial Data. Curr Sci. 2020; 120(12):1840-1847. https://doi.org/10.18520/cs/v120/i12/1840-1847.
CrossRef - Hyderabad District, Government of Telangana. Study area details. https://hyderabad.telangana.gov.in/. Access date 8 April, 2024.
- Bhuvan-Thematic Services. Land Use Land Cover (50K): 2015-2016. Bhuvan Indian Geo-Platform of ISRO, National Remote Sensing Center. https://bhuvan-app1.nrsc.gov.in/thematic/thematic/index.php. Accessed date 1 April 2024.
- NRSC (Department of Space, Government of India) Hyderabad. Land Use / Land Cover database on 1:50,000 scale, Natural Resources Census Project, LUCMD, LRUMG, RSAA, National Remote Sensing Centre, ISRO, Hyderabad, 2019; 1-11. https://bhuvan-app1.nrsc.gov.in/2dresources/thematic/LULC503/lulc.pdf.
- Government of India, Ministry of Jal Shakti, Department of Water Resources, RD and GR. Rainfall Data. India Water Resources Information System. https://indiawris.gov.in/wris/#/rainfall. Access date 5 February 2024.
- Radiosondes. NOAA. https://www.noaa.gov/jetstream/upperair/radiosondes. Accessed date 20 August 2024.
- University of Wyoming. Atmospheric sounding data of LI and PW. Wyoming Weather Web. https://weather.uwyo.edu/upperair/sounding.html. Accessed date 2 February 2024.
- Durre I., Vose R. S., Wuertz D. B. Overview of integrated global radiosonde archive. J Climate. 2006; 19(1): 53-68. https://doi.org/10.1175/JCLI3594.1.
CrossRef - Mann H. B. Nonparametric tests against trend. Econometrica. 1945; 13: 245-259. https://www.jstor.org/stable/1907187.
CrossRef - Kendall M. G. Rank Correlation Methods. 4th ed. London: Charles Griffin; 1975.
- Wayne W. L. Hypothesis Testing for Means and Proportions. Boston University School of Public Health. (Hypothesis Testing: Upper-, Lower, and Two-Tailed Tests (bu.edu)). Update date 6 November 2017. Accessed date 5 January 2024.
- Chakraborty R., Ratnam M. V., Basha S. G. Long-term trends of instability and associated parameters over the Indian region obtained using a radiosonde network. Atmos Chem Phys. 2019; 19(6): 3687-3705. https://doi.org/10.5194/acp-19-3687-2019.
CrossRef - Wan N., Lin X., Pielke Sr R. A., Zeng X., Nelson A. M. Global total precipitable water variations and trends over the period 1958-2021. Hydrol Earth Syst Sci. 2024; 28(9): 2123-2137. https://doi.org/10.5194/hess-28-2123-2024.
CrossRef - Waghaye A. M., Rajwade Y. A., Randhe R. D., Kumari N. Trend analysis and change point detection of rainfall of Andhra Pradesh and Telangana, India. J Agrometeorology. 2018; 20(2): 160-163. https://doi.org/10.54386/jam.v20i2.532.
CrossRef - Subash N., Ram Mohan H. S., Sikka A. K. Decadal frequency and trends of extreme excess/deficit rainfall during the monsoon season over different meteorological sub-divisions of India. Hydrol Sci J. 2011; 56(7): 1090–1109. https://doi.org/10.1080/02626667.2011.608677.
CrossRef - Singh G. P., Khole M., Rase D. M. Extreme rainfall events and urban floods in the growing cities of India. Mausam. 2015; 66(4): 825–840. https://doi.org/10.54302/mausam.v66i4.592.
CrossRef - Niyogi D., Lei M., Kishtawal C., Schmid P., Shepherd M. Urbanization Impacts on the Summer Heavy Rainfall Climatology over the Eastern United States. Earth Interact. 2017; 21(5): 1-17. https://doi.org/10.1175/EI-D-15-0045.1.
CrossRef - Paul S., Ghosh S., Mathew M., Devanand A., Karmakar S., Niyogi D. (2018) Increased spatial variability and intensification of extreme monsoon rainfall due to urbanization. Sci Rep. 2018; 8(3918): 1-10. https://doi.org/10.1038/s41598-018-22322-9.
CrossRef


