A GIS Based Spatio-Temporal Analysis of Air Quality Index Across Diverse Land-Use Zones in Rohtak City, India
Moni Jakhar
 , Meenakshi Nandal
*
and Jitender Singh Laura
, Meenakshi Nandal
*
and Jitender Singh Laura
1
Department of Environmental Science,
Maharshi Dayanand University,
Rohtak,
Haryana
India
http://dx.doi.org/10.12944/CWE.21.1.15
Copy the following to cite this article:
Jakhar M, Nandal M, Laura J. S. A GISBased Spatio-Temporal Analysis of Air Quality Index Across Diverse Land-Use Zones in Rohtak City, India. Curr World Environ 2026;21(1). DOI:http://dx.doi.org/10.12944/CWE.21.1.15
Copy the following to cite this URL:
Jakhar M, Nandal M, Laura J. S. A GISBased Spatio-Temporal Analysis of Air Quality Index Across Diverse Land-Use Zones in Rohtak City, India. Curr World Environ 2026;21(1).
Download article (pdf)
Citation Manager
Publish History

Introduction
One of the most important environmental issues facing the world today is air pollution, especially in South Asia's rapidly urbanising regions. According to the World Health Organisation,thepollution of ambient air causes premature deaths in millions per year, especiallyfine particulate matter (PM2.5), which has been found to be a major risk factor due to chronic respiratory diseases, stroke and ischemic heart diseases, and neurological disorders through oxidative stress and inflammation.1,2 Apart from PM2.5, gaseous pollutants such asSulphur dioxide (SO2) and Nitrogen oxides (NOx, NO2), as well as coarse particulate matter (PM10 and SPM), considerably deteriorate urban air quality and worsen respiratory and cardiovascular conditions.2,3 Vehicle emissions, industrial combustion, burning biomass, resuspended dust and the use of fossil fuels are the primary sources of these pollutants.4,5 Globally, the relative contributions of various sources to ambient PM2.5 differ. In nations like Singapore and South Africa, the combustion of fossil fuels contributes significantly to PM2.5levels; in many African and Middle Eastern nations, windblown dust is a significant source and in South Asian nations, residential fuel combustion is the primary source.4 In reality, winter smog episodes caused by particulate pollution are a frequent health risk and Indian megacities frequently record annual mean PM2.5two to three times the national standards. Since gaseous precursors (NOx, SO2) form secondary sulfates and nitrates in PM2.5, other criteria pollutants (e.g., NOx, SOx) also matter. In terms of the overall impact on population health, particulate matter outweighs both ozone and CO in India's urban pollution burden.6 India faces some of the highest levels of air pollution globally. Air pollution is still the biggest environmental risk factor for mortality in India, accounting for 17–18% of all deaths in the nation. Widespread exceedance of the NAAQS for PM2.5, PM10, NO2, and SO2 is regularly reported by national assessments, especially in northern India.7
Due to a combination of emission sources and unfavourable weather, air pollution levels in northern India, including Haryana and the wider Indo-Gangetic Plain, are consistently high. Elevated concentrations of particulate and gaseous pollutants are caused by a variety of factors, including vehicle density, industrial clusters, construction activity, burning of seasonal agricultural residue and power generation based on coal and oil.5 Haryana is one of the most polluted states in India, with several districts continuously exceeding national PM2.5 standards throughout the year, according to satellite and ground-based assessments.8 These issues are not exclusive to large cities, they also affect smaller and semi-urban areas, where there is still a dearth of published datasets and monitoring coverage.
Rohtak, a Tier-II city in Haryana, is a typical semi-urban environment influenced by mixed land-use patterns, such as traffic corridors, residential expansion, small-scale industrial activity and surrounding agricultural fields. Despite Rohtak's rapid urban growth, there is still a dearth of peer-reviewed literature on the city's air quality.9 One of the few published studies used data from the Haryana State Pollution Control Board to analyse ambient air quality during the COVID-19 lockdown,conditions were 2.3-2.8 times higher than those of PM2.5 and nitrogen oxides, indicating persistent exceedance of air-quality standards even in the absence of episodic events.10
In northern India, the dispersion and accumulation of pollutants are significantly influenced by meteorological factors. Lower temperatures, slower winds, shallow boundary layers and frequent temperature inversions limit vertical mixing and cause pollutants to accumulate close to the surface in the winter.11,12 Summertime, on the other hand, is typically marked by higher temperatures, increased atmospheric mixing and stronger winds, all of which encourage the dispersion and dilution of pollutants. Winter concentrations of PM, NOx and SO2 are significantly higher than summer concentrations, according to several studies conducted in northern Indian cities.13
Even though there is increasing evidence of severe air pollution in northern India, Tier-II cities still lack systematic multi-pollutant monitoring and spatial analysis, especially in semi-arid climates. The majority of current research focuses only on particulate matter or uses short-term datasets. In order to close this gap, the current study integrates ground-based measurements with GIS-based AQI mapping to perform seasonal monitoring of PM10, PM2.5, NOx and SO2 across several sites in Rohtak city.In order to provide a thorough evaluation of spatial variability and seasonal contrasts, this paper presents findings from two representative seasons: winter (October 2021- February 2022) and Summer (April 2022-July 2022).
“The Objectives of this study are”(1) to evaluate the temporal and spatial variability of air pollutants,(2) to determine the AQI for five different land-use locations,(3)to integrate pollutant trends with meteorological data to elucidate the influence of temperature and seasonality on air quality,and (4) to use GIS for the spatial distribution of AQI by thematic map.It is anticipated that the results of this study will help developing Indian cities to manage and plan for urban air quality.
Meteorological conditions, particularly temperature, wind direction and speed, relative humidity and rainfall, play a crucial role in governing the dispersion, transport and dilution of atmospheric air pollutants. The integration of Geographic Information Systems for air quality mapping allows for the precise identification of urban hotspots and the visualization of spatial gradients that are often missed by point-source monitoring.14 By using Inverse Distance Weightage (IDW) interpolation technique, this study provides a spatial framework that can assist urban planners in targeting high-risk areas for localized air quality management strategies.
Material and Method
Study area
The goal of the current study was to evaluate ambient air quality across different urban land-use settings in Rohtak, Haryana, India. The city of Rohtak (28°54'0'' N, 76°36'0'' E) is located in the National Capital Region (NCR) of north-central Haryana, approximately 70 km northwest of Delhi and is influenced by both local emission sources and regional transport of air pollutants. In 2011, it was home to approximately 0.37 million people and served as the administrative headquarters for Rohtak District. The city is situated at an elevation of approximately 220 meters on the level Indo-Gangetic Plain with a subtropical monsoon climate that features mild winters (~13°C) and extremely hot, dry summers (avg. max ~44°C). The majority of the yearly rainfall (~592 mm) occurs between June and September.15 To capture the spatial variability in air pollutant concentrations, five representative sites were chosen shown in Fig.1- Control site (Maharshi Dayanand University, 28°87'68'' N, 76°62'11'' E),Residential site (Sector-2, 28°89'65''N, 76°63'30''E), Commercial site (District Court complex, 28°89'4''N, 76°59'35''E),Traffic site (Jind Bypass, 28°91'34''N, 76°56'67'') and an Industrial site (HSIIDC, 28°89'67''N, 76°54'74''E).These locations offer a thorough framework for assessing the impact of various emission sources on air quality and collectively represent the main functional zones of Rohtak.
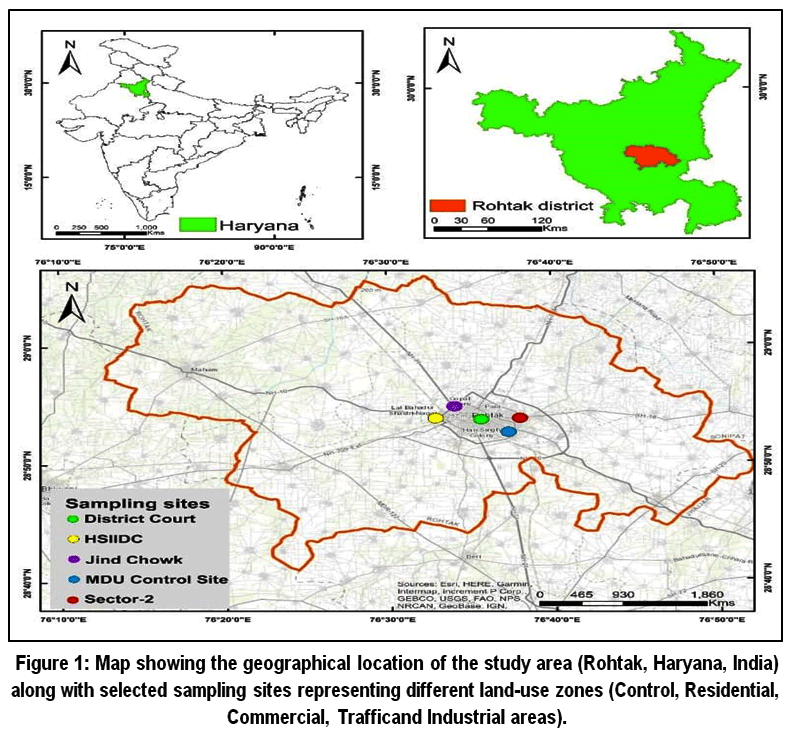 | Figure 1: Map showing the geographical location of the study area (Rohtak, Haryana, India) along with selected sampling sites representing different land-use zones (Control, Residential, Commercial, Trafficand Industrial areas).
|
Sampling and Analysis
Monitoring of air quality was carried out at the selected sites in Rohtak city following a fixed-site sampling approach. The sampling equipment was set up and at each site, 24-hr integrated samples were collected on alternate days over a 15-day deployment period, yielding seven observations per site and 35 samples per season. A US EPA-certified sampler (Ecotech AAS127) was used to collect PM2.5 and PM10 onto pre-weighed glass-fibre filters. To determine particulate mass concentration using gravimetric analysis, filters were conditioned at 105°C and weighed both before and after sampling.16 High-volume samplersAPM-411 setup for gases, were placed approximately 1.5 meters above ground to collect samples of suspended particulate matter and gaseous pollutants (SO2 and NO2). For nitrogen dioxide (NO2) and sulfur dioxide (SO2) measurements, the air drew through impinger bottles at 0.5L/min.Then, analyzed these absorbing solutions for SO2 and NO2 using established colorimetric methods. The modified Jacob-Hochheiser (Arsenite) method was used to measure nitrogen dioxide. Air was drawn through an impinger containing a solution of 0.4% sodium hydroxide (NaOH) and 0.1% sodium arsenite (NaAsO2). In this alkaline medium, NO2 is converted to nitrite (NO2). After sampling, phosphoric acid was added, sulfanilamide and N-(1-naphthyl)ethylenediamine dihydrochloride to the solution. The nitrite reacts with these chemicals to form a pink azo dye, whose absorbance was measured at 540nm. For this NO2 measurement method, the precision was 2.6%, the accuracy was ±14.6% and the detection limit was 1µg NO2/sample.
The standard improved West-Gaeke colorimetric method was used to measure sulfur dioxide. Air was bubbled through an impinger containing 0.04M potassium tetrachloromercurate (K2[HgCl4]) in distilled water. In this solution, SO2 is converted to a dichlorosulphitomercurate complex. Then p-rosaniline added and methanesulphonic acid, which react with the complex to form a colored compound. The solution’s absorbance was recorded at 560nm in UV/VIS spectro-photometer. The method’s precision, accuracy and detection limit were 4.6%, ±10.4% and 0.75µg SO2 per sample, respectively. Using sample volumes and calibration graph factors, mass concentrations were computed from measured absorbance.17
AQIwas calculated usingthe CPCB sub-index approach based on PM2.5, PM10, SO2 and NO2 concentrations.18 The formula used:
Ip = [IHi – ILo / BPHi – BPLo] (Cp – BPLo) + ILo
Ip =Air quality index calculated for the pollutant p.
Cp = the measured conc. Of pollutant p, rounded to a standard level.
BPHi= the upper conc. Limit (breakpoint) that is just above or equal to Cp.
BPLo= the lower conc. Limit (breakpoint) that is just below or equal to Cp.
Ihi= the AQI value that corresponds to the upper breakpoint (BPHi).
Ilo=the AQI value that corresponds to thelower breakpoint (BPLo).
AQI was classified into different categories (Good:0-50, Satisfactory:51-100, Moderate: 101-200, Poor:201-300, Very Poor: 301-400 and Severe: 401-500) based on CPCB guidelines with corresponding color coding. All observations were checked for completeness and analytical reliability prior to AQI calculation and spatial analysis. The final dataset did not include any missing values and samples that failed to satisfy quality-control standards were excluded and were not imputed.
Meteorological parameterssuch as temperature, wind direction and speed, rainfall, and relative humidityfor the sampling period in Rohtak city were obtained from automatic weather stations under the operation ofthe Central Pollution Control Board, New Delhi. Hourly observations recorded during both daytime and nighttime were used and mean values were subsequently computed over 12-hour intervals to represent prevailing meteorological conditions during the sampling period.
Pollutant sources and transport pathways at a given location can be identified using air mass backward trajectories. These trajectories during winter and summer time were drawn following the HYSPLIT(Hybrid Single Particle Lagrangian Integrated Trajectory) model, which was developed by the National Oceanic and Atmospheric Administration through its Air ResourcesLaboratory19,20 and are plotted in figures 4(a) and 4(b). Air back trajectory, prepared by using National Centre for Environmental Prediction (NCEP) reanalysis, provides details of air masses along latitude, longitude, altitude and as a function of time. Here, 72 hours of air backward trajectory analysis was performed for air mass at 500 m, 1000 m and 1500 m height, taking the GDAS-05 scale at each sampling location using the vertical velocity method. Spatial representation of AQI was performed in a GIS environment using kriging interpolation-based thematic mapping.
Result
Spatial and Seasonal Distribution of Air Pollutants
The ambient pollutant concentrations at the five Rohtak monitoring sites during the winter vary significantly geographically. Table 1(a) presents the mean concentrations ± standard deviation of PM2.5, PM10, SO2 and NO2 at five monitoring sites in Rohtak during winter 2021. Pollutant levels exhibit a clear spatial gradient, with the lowest concentrations at the control site (PM2.5,: 72.33 ± 2.90 µg m³; PM10: 83.12 ± 3.66 µg m-3; SO2: 7.74 ± 0.95 µg m-3; NO2: 30.83 ± 5.81 µg m-3) and progressively higher values toward anthropogenically influenced sites, peaking at the industrial site (PM2.5: 92.76 ± 4.04 µg m-3; PPM10: 102.49 ± 3.67 µg m-3; SO2: 14.19 ± 5.25 µg m-3; NO2: 60.16 ± 5.88 µg m-3). Traffic and industrial sites show the highest PM2.5 and PM10 (e.g., traffic PM2.5: 85.36 ± 4.95 µg m-3), reflecting dominant local sources such as vehicular exhaust and industrial emissions.21,22 Gaseous pollutants follow a similar trend, with NO2 elevated at traffic (53.31 ± 6.82 µg m-3) and industrial sites due to combustion processes, consistent with urban patterns in Indian cities. Other studies23,24 have reported elevated NO2 levels in high-traffic zones, where dense vehicular emissions predominate in urban areas.
Table 1(b) reports summer 2022 data, revealing generally lower concentrations across all sites and pollutants compared to winter (e.g., industrial PM2.5: 82.44 ± 4.16 µg m-3 vs. 92.76 ± 4.04 µg m-3; NO2: 61.79 ± 7.46 µg m-3 vs. 60.16 ± 5.88 µg m-3). The control site again has the lowest levels (PM2.5: 61.64 ± 4.49 µg m-3), while industrial and traffic sites remain the highest, underscoring persistent source impacts. Seasonal reductions of 20–30% for particulatesalign with enhanced dispersion from higher mixing heights, stronger winds, and reduced inversions in summer25-27 These patterns mirror observations in northern India, where winter stagnation elevates pollutants28 Winter PM2.5averages >100 µg m-3 and PM10 averages >150 µg m-3 in parts of Delhi, which are generally higher than the Rohtak averages reported here.This is due to megacities higher industrial and traffic density and urban population.5 Similar to the data from the study area, other studies in Tier-II Indian cities have found winter PM2.5values in the 70–90 µgm-3 range and summer values in the 40–60 µg m-3 range in comparable medium-sized urban areas. Wintertime trafficdominated NO2 levels of 53–60 µgm-3 are consistent with findings in other Tier-II Indian cities.29 NO2 levels at high-traffic zones reflect the growing influence of vehicular exhaust on local air quality, a trend that has become increasingly critical as urban centers in Haryana expand.30,31 SO2 concentrations overall lie between 7.74 µgm-3- 15.61 µgm-3 in all seasons and locations, indicating localized industrial activity and fossil fuel combustion from vehicles rather than widespread coal combustion, which is similar with patterns observed in urban areas.32
The PM2.5 and PM10 levels in Rohtak exhibit a pronounced seasonal peak in winter, a phenomenon widely observed across the Indo-Gangetic Plain, where meteorological stagnation prevents effective dispersion.26,27 While the concentrations found in this study, ranging from 72µgm-3 to 92 µgm-3 for PM2.5, are significantly above national standards, they are relatively lower than those reported in neighboring Delhi, where winter averages for PM2.5 and PM10 frequently exceed 100 and 150, respectively. This distinction highlights the unique air quality profile of a "Tier-II" city, as smaller urban centers and rural locations often lack the intensive monitoring coverage found in larger megacities, despite facing significant pollution burdens.12
Table 1: Mean concentrations± SD of Air Pollutants at five monitoring sites in Rohtak
A). Winter 2021
Sites / Pollutants | PM2.5(µg/m-3) | PM10(µg/m-3) | SO2(µg/m-3) | NO2(µg/m-3) |
Mean ± SD | Mean ± SD | Mean ± SD | Mean ± SD | |
Control | 72.33 ± 2.90 | 83.12 ± 3.66 | 7.74 ± 0.95 | 30.83 ± 5.81 |
Residential | 72.05 ± 3.02 | 90.30 ± 4.60 | 10.33 ± 2.16 | 38.71 ± 4.06 |
Commercial | 78.04 ± 2.91 | 94.06 ± 3.52 | 11.49 ± 1.52 | 45.71 ± 6.42 |
Traffic | 85.36 ± 4.95 | 98.17 ± 6.76 | 15.45 ± 3.93 | 53.31 ± 6.82 |
Industrial | 92.76 ± 4.04 | 102.49 ± 3.67 | 14.19 ± 5.25 | 60.16 ± 5.88 |
B). Summer
Sites / Pollutants | PM2.5(µg/m-3) | PM10(µg/m-3) | SO2(µg/m-3) | NO2(µg/m-3) |
Mean ± SD | Mean ± SD | Mean ± SD | Mean ± SD | |
Control | 61.64 ± 4.49 | 70.36 ± 6.65 | 9.63 ± 0.76 | 29.59 ± 5.67 |
Residential | 63.74 ± 5.95 | 76.02 ± 8.34 | 11.32 ± 1.04 | 36.80 ± 6.44 |
Commercial | 70.32 ± 4.04 | 78.90 ± 3.76 | 12.26 ± 0.87 | 48.26 ± 6.27 |
Traffic | 72.09 ± 5.11 | 81.41 ± 3.59 | 15.61 ± 0.97 | 57.29 ± 4.76 |
Industrial | 82.44 ± 4.16 | 91.63 ± 2.66 | 15.19 ± 7.50 | 61.79 ± 7.46 |
Overall, the results highlight site-specific emission influences and meteorological modulation of air quality, with exceedances of national standards (PM2.5 annual mean:40 µgm-3) emphasizing needs for targeted controls at high-emission sites.
Spatial and Seasonal Interpretation
The spatial distribution of air pollutants across Rohtak City, as illustrated in the winter and summer Figure 2(a) and 2(b), reveals a distinct hierarchy of concentrations influenced by land-use patterns and seasonal meteorological shifts.
The data identifies the Industrial and Traffic sites as primary pollution hotspots. In the Winter season, PM2.5 concentrations at the Industrial site reached a mean of 92.76µgm-3, while the Traffic site recorded 85.36µgm-3. This spatial trend underscores the heavy contribution of vehicular exhaust and industrial combustion to the city's aerosol load.33 Conversely, the Control site consistently recorded the lowest concentrations ~72.33µgm-3 PM2.5 in winter, providing a baseline that highlights the intensity of anthropogenic. The data identifies the Industrial and Traffic sites as primary pollution hotspotsat the urban monitoring points.14,34 Rohtak’s PM concentrations are significantly higher than the National Ambient Air Quality Standards but remain lower than megacityadjacent hubs like Gurugram, where seasonal PM2.5 has been recorded as high as 406.9436µgm-3.35 This distinction characterizes Rohtak as a Tier-II city with a severe but distinct pollution profile compared to the National Capital Region.28 NO2 levels60.16–61.79µgm-3 remained high at the Industrial and Traffic53.31–57.29µgm-3 sites across both seasons. This consistency suggests that while particulate matter is heavily influenced by seasonal meteorology and gaseous pollutants like NO2 are driven by continuous local vehicular and industrial activity.33 Similarity with other findings in Rohtak, SO2 levels remained well within permissible limits across all sites and seasons, indicating it is not currently a primary threat to local air qualitya trend also observed in other medium-sized urban areas in Haryana.34
The comparison between the two graphs shows a clear reduction in particulate matter during the summer season (April 2022–July 2022). For instance, PM2.5 at the Industrial site decreased from its winter peak to 82.44µgm-3 in summer, while the Control site dropped to 61.64µgm-3. This seasonal decline is primarily attributed to increased thermal turbulence and higher mixing heights during the pre-monsoon months, which facilitate the vertical and horizontal dispersion of pollutants.35,36 In contrast, the elevated winter levels are a result of the compression of the Planetary Boundary Layer, which traps local emissions near the ground and prevents atmospheric cleansing.37,38
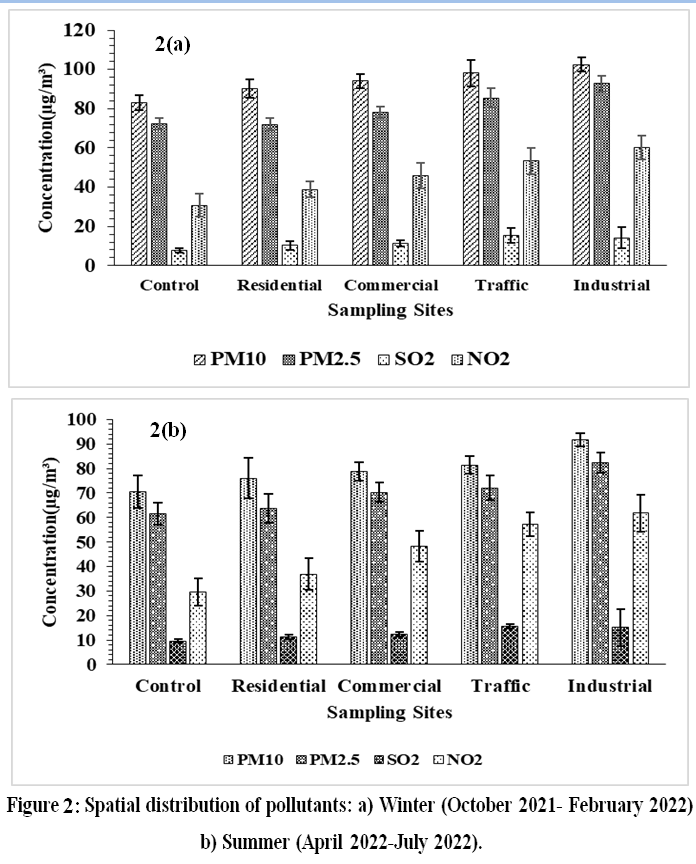 | Figure 2: Spatial distribution of pollutants: a) Winter (October 2021- February 2022) b) Summer (April 2022-July 2022).
|
Air Quality Index Evaluation at various monitoring locations
The Air Quality Index (AQI) was computed by using the Central Pollution Control Board (CPCB) methodology, for every sampling day at all monitoring sites based on sub-index values of PM2.5, PM10, SO2, and NO2. Table 2 summarizes the Air Quality Index values calculated during sampling days in winter and summer across the five sites. In winter, AQI values exhibited significant variability, ranging from 188.43 to 227.39 (Industrial), with consistently higher levels at Traffic (mean ~ 183 ± 15.4) and Industrial (mean = 207 ± 12.5) sites compared to Control (mean ~ 140 ± 11.4) and Residential (mean ~ 138 ± 9.4) sites. Commercial sites showed intermediate values (mean = 159 ± 9.4). These patterns reflect the dominant influence of local emission sources, such as vehicular exhaust and industrial processes, leading to "Poor" to "Very Poor" AQI categories (AQI > 150) particularly at high-exposure sites on most days.28 Notably, peaks like 217.11 and 213.56 underscore episodic pollution spikes.
In contrast, summer 2022 AQI values were markedly lower across all sites (overall mean = 134 vs. winter = 161), ranging from 89.33 to 195.01, with Control (mean = 105 ± 10.5), Residential (mean = 113 ± 15.7) and Commercial (mean = 130 ± 13.0) sites mostly in "Moderate" (AQI 101–200) categories, while Traffic (mean = 138 ± 19.0) and Industrial (mean = 174 ± 12.4) remained "Poor". This seasonal contrast, winter AQI ~20–50% higher than summer-aligns with meteorological drivers like temperature inversions, shallow boundary layers and stagnant conditions trapping pollutants in winter,26,27 versus enhanced dispersion from higher temperatures, winds and mixing in summer.26,36 Spatial gradients highlight anthropogenic impacts, with Traffic and Industrial sites exceeding safer sites by 30–50% on average, emphasizing the need for targeted interventions in high-emission zones.
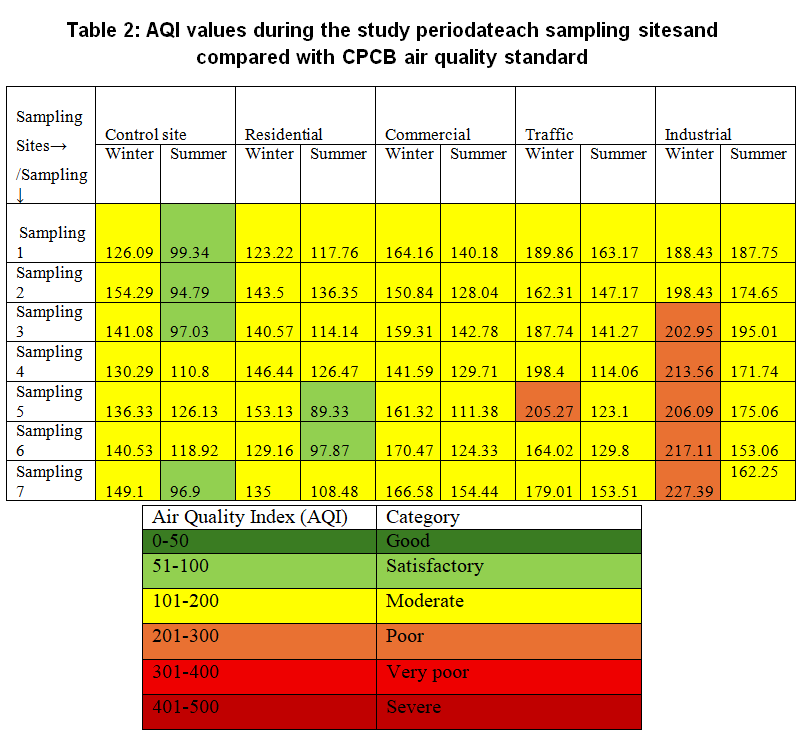 | Table 2: AQI values during the study periodateach sampling sitesand compared with CPCB air quality standard.
|
Figure 3 illustrating the site-wise mean Air Quality Index for Rohtak City demonstrates a distinct spatio-temporal pattern, with the winter season exhibiting significantly higher pollution levels than the summer across every sampling location. The Industrial site recorded the highest mean AQI in both seasons, peaking at approximately 207 in winter and 174 in summer, followed by the Traffic and Commercial sites. The "Poor" to "Very Poor" AQI recorded at the Commercial site during winter underscores the impact of localized emissions from business districts and commercial transit, which are often trapped by the city’s built environment during periods of atmospheric stability.14,22 The AQI of commercial site closely mirrors the trends observed at the Traffic site, suggesting that vehicular emissions and high human density are the dominant factors for both locations. While the Residential and Control sites showed lower AQI values, even these locations experienced seasonal degradation in AQI, with the Control site dropping from ~140-winter mean to~106-summer mean. This city-wide elevation in winter is a result of regional meteorological stagnation and the "shallow" winter boundary layer typical of the Indo-Gangetic Plain.38,39 In the study, AQI improves in summer across all sites that include the commercial zone with high activity, confirms that increased wind speeds and higher temperatures play a critical role in atmospheric cleansing.25,36 However, the persistence of the Commercial and Industrial sites in the "Moderate" to "Poor" categories during summer indicates a constant baseline of pollution that necessitates targeted urban management.34,35 These results resonate with recent spatial assessments using GIS to map pollution hotspots in other North Indian cities, where traffic corridors and industrial clusters are identified as the dominant sources of AQI deterioration during periods of high atmospheric stability.14,22
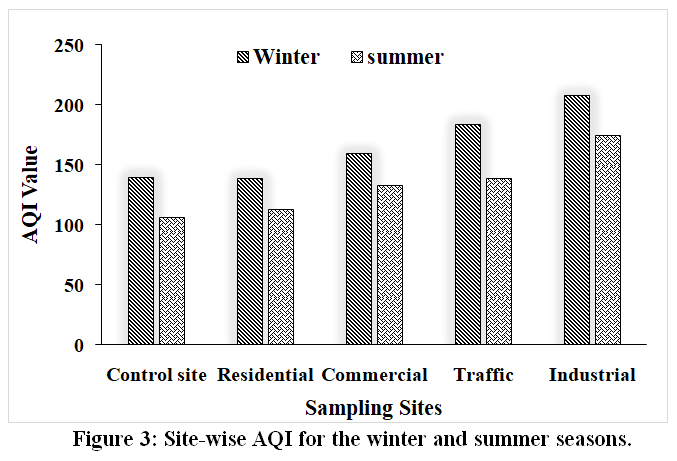 | Figure 3: Site-wise AQI for the winter and summer seasons.
|
Results of the Meteorological parameters during study period
During the study period, the mean maximum and minimum temperatures in winter were 23.3±5.12 °C and 10.6±3.69 °C, respectively. The average relative humidity was 72.47±11.02%, while wind speed remained relatively low (1.29±0.21m s-1), indicating weak dispersion conditions. Rainfall was negligible (1.1±4.63), suggesting minimal wet removal of pollutants. Whereas, summertime mean maximum and minimum temperatures for the study period were 40.2±4.27 °C and 25.8±3.47 °C, respectively, showing much higher thermal conditions than winter. Because of the dry atmosphere, the average relative humidity was comparatively low (40.89±18.04%). The somewhat increased wind speed (1.37±0.23 m-1) indicates a better dispersion of air contaminants. There was more variation in rainfall (2.8±19.62 mm), with occasional precipitation events causing intermittent wet scavenging of pollutants shown in Table 3. Summertime air dispersion conditions are often better due to the combination of high temperatures, reduced humidity and slightly higher wind speeds; however, episodic rainfall may help remove pollutants even more.The higher levels of PM and AQI in winter at each sites match the weather conditions that were present during sampling period that includes low temperature, high RH, weak winds and low rainfall. These conditions keep the atmosphere from mixing, lower the boundary layer height and make it easier for pollutants that are released close to the ground to build up. On the other hand, high temperature in summer, stronger wind and more thermal turbulence make it easier for pollutants to disperse. This means that even though traffic and industrial emissions are still present, the buildup of pollutants is lessened.37,38
Table 3: Meteorological parameters during sampling period.
Meteorological Parameters | ATMax. (°C) | ATMin. (°C) | RH (%) | WS (m/s) | RF(mm) |
Winter 2021 | 23.3±5.12 | 10.6±3.69 | 72.47±11.02 | 1.29±0.21 | 1.1±4.63 |
Summer 2022 | 40.2±4.27 | 25.8±3.47 | 40.89±18.04 | 1.37±0.23 | 2.8±19.62 |
The windrose diagram in Figure 4(a) for the winter season reveals a clear dominance of winds from the North (N) and Northwest directions, with the Northward component accounting for nearly 50% of the total wind frequency. These winds are characterized by relatively low speeds (predominantly <4 m/s), which creates an environment conducive to atmospheric stagnation. The accompanying HYSPLIT backward trajectory model for winter [Figure 4(a)] illustrates that air masses reaching Rohtak originate from the upper regions of Haryana, Punjab and the Indo-Pakistani border. These trajectories are relatively short and remain at low altitudes (typically below 1000–1500 meters AGL), indicating slow-moving air that facilitates the accumulation of local anthropogenic emissions and the regional transport of biomass-burning plumes from upwind agricultural activities.39,40
In contrast, the summer season displays a significant shift in meteorological dynamics. The windrose diagram in Figure 4(b) shows a shift in the prevailing wind direction to the Southwest and South (S), with higher wind speeds compared to the winter months. The HYSPLIT model for summer depicts much longer and more dispersed trajectories, with air masses traveling from the Arabian Sea and across Western India. Crucially, the vertical profile of these summer trajectories [Figure 4(b)] shows air masses reaching altitudes as high as 4500–6000 meters AGL. This increased vertical movement, combined with higher surface wind speeds, facilitates vigorous atmospheric mixing and the dilution of ground-level pollutants.25,36
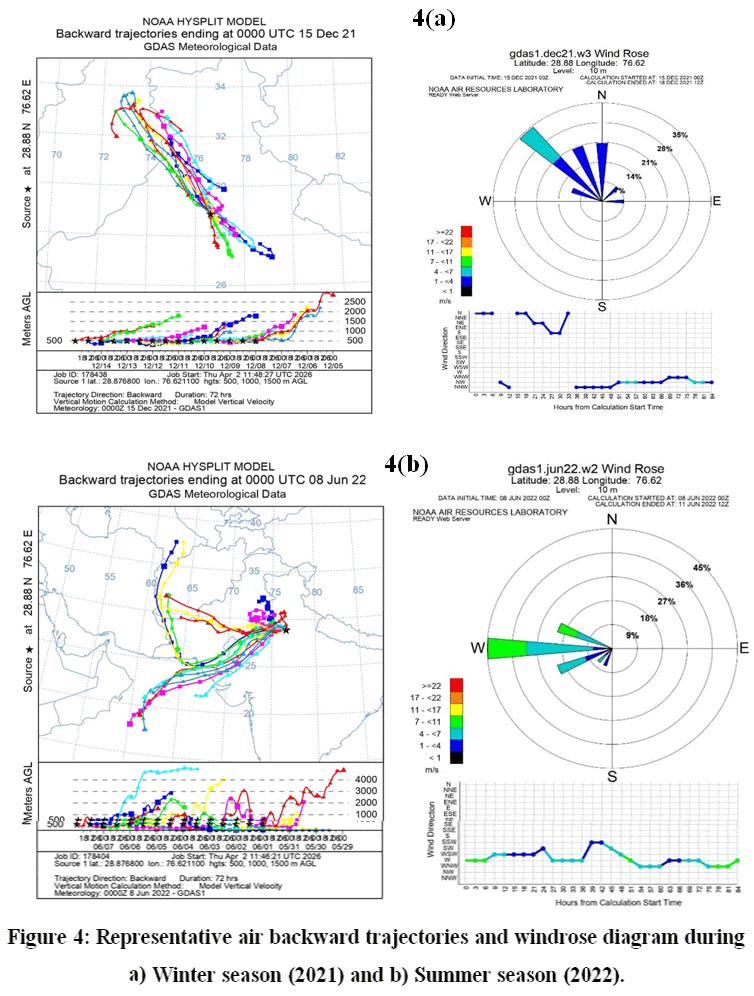 | Figure 4: Representative air backward trajectories and windrose diagram during a) Winter season (2021) and b) Summer season (2022).
|
The comparison between these two periods confirms that the winter degradation of air quality in Rohtak is driven by a "double-whammy" of regional transport from the Northwest and a compressed Planetary Boundary Layer that prevents pollutants from dispersing vertically.37,38 Conversely, the summer's "Satisfactory" to "Moderate" AQI category as per CPCB standards, is supported by the influx of relatively cleaner air masses from the Southwest and enhanced thermal turbulence, which flushes pollutants out of the urban canopy.41,42 This meteorological evidence corroborates the ground-level monitoring data, explaining why the Industrial and Traffic hotspots experience their most hazardous levels during the stagnant NW wind regimes of winter.14,34
Spatial Distribution of AQI by thematic map
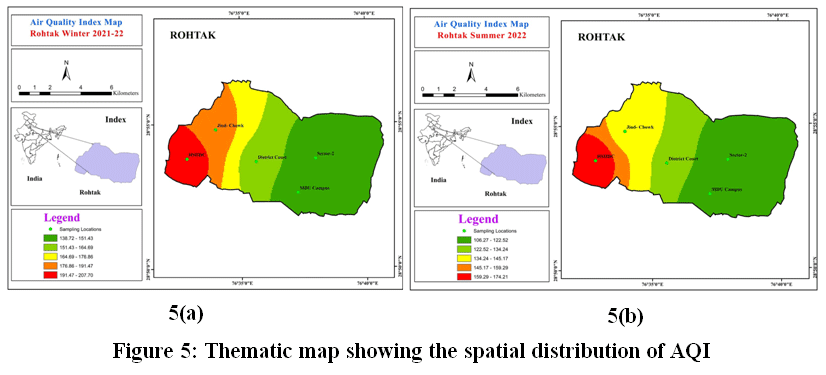
The thematic maps generated using Inverse Distance Weightage (IDW) interpolation techniqueprovide a continuous spatial visualization of the Air Quality Index across Rohtak City, identifying clear pollution gradients and localized hotspots.21,43 The interpolated AQI surfaces for the winter and summer, respectively, are displayed in Figure 5 (a) and (b) using colour coding, where green indicates satisfactory air quality and red indicate poor conditions.
The winter thematic map reveals a high-intensity pollution core in the central-western region of the city, with AQI values reaching a peak of 186.87 to 207.14. According to CPCB AQI classification these values fall within the Moderate to poor category with several location approaching the poor category, this zone coincides with the heavy industrial and traffic-congested corridors of Rohtak. The spatial spread of these elevated values is significantly broader in winter due to the shallow Planetary Boundary Layer, which restricts vertical mixing and traps anthropogenic emissionsparticularly from vehicular exhaust and biomass burningnear the ground surface.38,33 The green zones on the eastern periphery i.e. control and residential sites, representing AQI values between 138.74 and 159.01, falls largely within the moderate categoryhighlight a clear rural-to-urban gradient where pollution levels decrease toward the city's outskirts.34,14
 | Figure 5: Thematic map showing the spatial distribution of AQI
|
In the summer season, the map illustrates a significant reduction in overall AQI intensity, though the spatial "hotspot" remains geographically consistent in the central-western sector. During this period, the peak AQI values dropped to a range of 154.52 to 173.72, which also correspond to Moderate category as per CPCB standards, while the cleaner zones in the east recorded values as low as 106.57 which will come under satisfactory category. This seasonal improvement is driven by increased thermal turbulence and higher mixing heights, which facilitate the dilution and dispersion of particulate matter.25,36 However, the fact that the core hotspot persists in the same location across both seasons indicates that fixed anthropogenic sources, specifically industrial clusters and major transit points like the Jind Bypassare the dominant, year-round drivers of air degradation in the city.33 These findings are consistent with CPCB AQI classification and confirm that Rohtak experiences moderate to poor air quality particularly during winter.
Geospatial Insights for Targeted Urban Air Management
The use ofIDW interpolation successfully identifies the high-density commercial, traffic and industrial core as a critical "action zone" for urban air quality management.22 These maps suggest that while regional meteorology and the seasonal transport of pollutants from upwind agricultural areas exacerbate winter levels, the localized urban-industrial load remains the primary contributor to Rohtak's baseline pollution.39,40 These spatial insights are vital for local authorities to prioritize "green belt" development and stricter emission controls in the western-central hotspots identified by the red and orange contours.21,14
Discussion
The observed concentrations of air pollutants in Rohtak demonstrate a significant seasonal disparity, mirroring broader trends across the Haryana region where the Air Quality Index frequently shifts from "Satisfactory" in the monsoon to the "Very Poor" category during winter.39 When compared to adjacent industrial hubs like Gurugram, where seasonal PM2.5 concentrations have been recorded as high as 406.94,35 Rohtak exhibits a distinct pollution profile characteristic of a rapidly urbanizing Tier-II city. Additionally, the continuous low levels found in this study are comparable with historical data from Rohtak which previously reported values between 5.1-13.1indicating that gaseous sulphur remains within permissible limits despite increasing urban density over the last decade.3
The sharp escalation of pollutant levels during the winter months is intrinsically linked to the compression of the Planetary Boundary Layer. In the Indo-Gangetic Plain, a reduced PBL height effectively traps anthropogenic emissions near the surface by preventing vertical dispersion.37,38 This atmospheric stability is exacerbated by the negative correlation between meteorological variablessuch as wind speed and temperatureand pollutant concentrations. Higher temperatures in the pre-monsoon season facilitate thermal turbulence and atmospheric mixing, whereas winter inversions lead to the stagnation of particulate matter.25,36 The HYSPLIT backward trajectory analysis further corroborates that while local traffic at sites like Jind Bypass contributes significantly to primary emissions, the city-wide haze is reinforced by the regional transport of biomass-burning plumes from upwind agricultural activities in Punjab and neighboring districts.39,40
Conclusion
This study confirms that particulate matter (PM2.5 and PM10) is the primary driver of poor air quality in Rohtak, frequently exceeding National Ambient Air Quality Standards, whereas gaseous pollutants like remain largely compliant except at high-traffic intersections. The integration of GIS-based thematic mapping has successfully identified the central-western traffic corridors and the industrial periphery as critical spatial "hotspots" that require targeted intervention. Given the profound influence of regional meteorology and the seasonal shallowing of the boundary layer, urban planning in Rohtak must transition toward air quality management strategies that include "green belt" development around industrial zones and stricter traffic regulations during winter inversion events to mitigate localized health risks.
Acknowledgement
The author gratefully acknowledges the Department of Environmental Science, MDU, Rohtak for providing the necessary instrumentation facilities. I extend my sincere gratitude to all who contributed to this research, including colleagues and friends for their valuable discussions, the study participants for their contributions and everyone who supported me throughout this research journey.
Funding Sources
The author received no financial support for the research, authorship, and/or publication of this article.
Conflict of Interest
The authors do not have any conflict of interest.
Data Availability Statement
This statement does not apply to the present study.
Ethics Statement
This study did not involve human or animal subjects and therefore, did not require ethical approval.
Informed Consent Statement
This study did not involve human participants and therefore, informed consent was not required.
Permission to reproduce material from other sources
Not Applicable
Author Contributions
Meenakshi Nandal: Conceptualization, methodology, Data curation, validation and reviewing.
Jitender Singh Laura: Formal Analysis.
Moni Jakhar: Experiment performing, writing original draft, Software, Statistical modelling, Model interpretation
References
- World Health Organization (WHO). WHO Air Quality Guidelines — Global Update 2021
- Health Effects Institute. 2025. State of Global Air 2025: A Report on Air Pollution and Its Role in the World’s Leading Causes of Death. Boston, MA: Health Effects Institute.
- Seinfeld J. H, Pandis S. N. Wiley.Atmospheric Chemistry and Physics (3rd ed.); 2016.
- SOGA. (2025) State of Global Air, special report. Health effect institute Boston, ISSN: 2578-6873.
- Singh A, Vishnoi A. S, Banday A. H, Bora P, Pandey P. Influence of stubble burning on air quality of Northern India: a case study of Indo-Gangetic plains of India. Environmental Monitoring and Assessment 2023; 195(4):487.
CrossRef - Singh V, Singh S, Biswal A. Exceedances and trends of particulate matter (PM2.5) in five Indian megacities. Science of the Total Environment 2021; 750:141461.
CrossRef - Central Pollution Control Board (CPCB). (2022). National Air Quality Status and Trends in India. Ministry of Environment, Forest and Climate Change, Government of India.
- Pippal P. S, Kumar R, Singh A, Kumar R. Suitability of Machine Learning Models and their Performance for PM2.5 Estimation using high-resolution satellite-driven datasets over Northwest India 2025.
CrossRef - Sharma M, Kumar S. Analysing the spatial patterns and trends of urban growth in Rohtak city, India. Sustainable Environment 2022;8(1):2051268.
CrossRef - Yadav S, Dhankhar R, Chhikara S. K.Significant changes in urban air quality during Covid-19 pandemic lockdown in Rohtak City, India. Asian Journal of Chemistry 2022; 34(12):3189-3196.
CrossRef - Ghude S. D, Jenamani R. K, Kulkarni R, Wagh S, Dhangar N. G, Parde A. N, Rajeevan M. WiFEX: walk into the warm fog over Indo-Gangetic Plain region. Bulletin of the American Meteorological Society2023; 104(5):E980-E1005.
CrossRef - Sharma A, Masiwal R. Rising Extreme Event of Smog in Northern India: Problems and Challenges. In Extremes in Atmospheric Processes and Phenomenon: Assessment, Impacts and Mitigation2022; 205-236.
CrossRef - Jain S, Sharma S. K, Mandal T. K, Saxena M,Sharma A. Seasonal characteristics of aerosols (PM2.5 and PM10) and their source apportionment over urban environments of Haryana, India. Environmental Pollution2020; 263:114420.
- Shakya A, Tripathi G. Spatio-temporal monitoring and assessment of air quality and its impact on public health from geospatial perspective over Haryana, India. The International Archives of the Photogrammetry, Remote Sensing and Spatial Information Sciences2024;48:409-415.
CrossRef - Deswal M, Deswal P, Duhan S. S, Laura J. S. An assessment of anticipated pollution index of some common plants and trees of Rohtak city of Haryana (India). Rasayan Journal of Chemistry2019; 12:1627-1640.
CrossRef - Watson J. G, Tropp R. J, Kohl S. D, Wang X, Chow J. C.Filter processing and gravimetric analysis for suspended particulate matter samples. Aerosol Science and Engineering2017; 1(2):93-105.
CrossRef - Singh D. P, Gadi R, Mandal T. K, Dixit C. K, Singh K, Saud T, Gupta P. K. Study of temporal variation in ambient air quality during Diwali festival in India. Environmental monitoring and assessment2010; 169(1):1-13.
CrossRef - EPA (United States Environmental Protection Agency) 2009. Technical assistance document for reporting of daily air quality-the air quality index (AQI). EPA-454/B-09-001. U.S. Environmental Protection Agency, North Carolina.
- Bian H, Tie X, Cao J, Ying Z, Han S. Xue Y. Analysis of a severe dust storm event over China: application of the WRF-dust model. Aerosol and Air Quality Research(2011);11(4):419-428.
CrossRef - Draxler R.R, Rolph G. D. HYSPLIT (HYbrid Single-Particle Lagrangian Integrated Trajectory) Model access via NOAA ARL READY Website. Silver Spring, MD: NOAA Air Resources Laboratory, 2013
- Chattopadhyay S, Gupta S, Saha R. N.Spatial and temporal variation of urban air quality: a GIS approach. Journal of Environmental Protection2010;1(3):264.
CrossRef - Saharan S, Deswal S,Pal M. Air quality mapping and urban planning for sustainable urban ecology: a case study of Chandigarh, India. Ecological Questions2024;35(2):107-116.
CrossRef - Gurjar B. R, Ravindra K, Nagpure A. S. Air pollution trends over Indian megacities and their local-to-global implications. Atmospheric Environment2016;142:475-495.
CrossRef - Sharma M, Singh K, Gautam A. S, Gautam S. Longitudinal study of air pollutants in Indian metropolises: Seasonal patterns and urban variability. Aerosol Science and Engineering2025;9(3):320-335.
CrossRef - Chhabra P. The effect of different meteorological factors on the concentrations of air pollutants.2024
CrossRef - Ghosh B, Barman H. C, Padhy P. K. Analysis of spatiotemporal distribution of air quality index (AQI) in the state of West Bengal, India from 2016 to 2021. Discover Atmosphere2023;1(1):1.
CrossRef - Kong D, Wang S, Ning G, Cong J, Luo M, Ni X, Ma M. Clustering diurnal cycles of day-to-day temperature change to understand their impacts on air quality forecasting in mountain-basin areas. Atmospheric Chemistry and Physics Discussions2021;1-22.
CrossRef - Sharma D, Mauzerall D. Analysis of air pollution data in India between 2015 and 2019. Aerosol and Air Quality Research2022;22(2):210204.
CrossRef - Kuppili S. K, Nagendra S. M. Air quality in different urban hotspots in a metropolitan city in India and the environmental implication. Environmental Monitoring and Assessment2024;196(11):1-20.
CrossRef - Hooda E, Hooda B. K, Manocha V. Dynamics of inter-district developmental disparities in Haryana. Journal of Applied & Natural Science 2017;9(2).
CrossRef - Nagpal A. A study of development trends in rohtak city (india) with reference to ncr (national capital region) policies for haryana sub-region. Journal of Science and Technology2017;3(1):252-267.
CrossRef - Tiwari D, Mondal A, Balasubramanian S, Anand A, Maji S, Venkataraman C. High risk from coincidence of extremes in particulate matter and heat inIndia. Environmental Research Letters2025.
CrossRef - Shukla V, Dalal P, Chaudhry D. Impact of vehicular exhaust on ambient air quality of Rohtak city, India. Journal of Environmental Biology2010;31(6):929-932.
- Kaushik C. P, Ravindra K, Yadav K, Mehta S, Haritash A. K. Assessment of ambient air quality in urban centres of Haryana (India) in relation to different anthropogenic activities and health risks. Environmental monitoring and assessment 2006;122(1):27-40.
CrossRef - Bhadauria N, Chauhan A, Ranjan R, Jindal T. An assessment of seasonal, monthly and diurnal variations of ambient air quality in the Gurugram city (Haryana). Journal of Applied and Natural Science2023;15(1):306.
CrossRef - Lei X, Zheng Q, Qian Y, Hu J, Li D, Zhang P,Li Y. Feature analysis on air quality in the main urban area of Nanchong City in 2015–2018. Environmental engineering research2022;27(3).
CrossRef - Foskinis R, Gini M. I, Kokkalis P, Diapouli E, Vratolis S, Granakis K, Eleftheriadis K. On the relation between the planetary boundary layer height and in situ surface observations of atmospheric aerosol pollutants during spring in an urban area. Atmospheric Research2024;308:107543.
CrossRef - Jiang Y, Xin J, Wang Y, Tang G, Zhao Y, Jia D,Wu F. The thermodynamic structures of the planetary boundary layer dominated by synoptic circulations and the regular effect on air pollution in Beijing. Atmospheric Chemistry and Physics2021;21(8):6111-6128.
CrossRef - Jeet M, Rag A, Niwas R, Kumar A, Khichar M. L, Shekhar C,Kumar N.Spatial and temporal variation in the seasonal air quality index of Haryana, India. Mausam2023;74(3):787-794.
CrossRef - Mor S, Singh T, Bishnoi N. R, Bhukal S, Ravindra K. Understanding seasonal variation in ambient air quality and its relationship with crop residue burning activities in an agrarian state of India. Environmental Science and Pollution Research2022;29(3):4145-4158.
CrossRef - Du Y, You S, Liu W, Basang T. X,Zhang M. Spatiotemporal evolution characteristics and prediction analysis of urban air quality in China. Scientific Reports2023;13(1):8907.
CrossRef - Vadrevu K. P, Eaturu A, Biswas S, Lasko K, Sahu S, Garg J. K, Justice C. Spatial and temporal variations of air pollution over 41 cities of India during the COVID-19 lockdown period. Scientific reports 2020;10(1):16574.
CrossRef - Georgiou A. M, Kontos T.A Gis Toolkit For Automating Descriptive Statistic Computations For Air Quality Modeling. Geoplanning: Journal of Geomatics and Planning2016;5(1):53-62.
CrossRef
Abbreviations
AQI: Air Quality Index,
GIS- Geographical Information System
RSPM- Respirable Suspended Particulate Matter
PM- Particulate Matter
SOx- Sulphur oxide
NOx- Nitrogen oxide
CPCB- Central Pollution Control Board
WHO- World Health Organization
µg/m³- Micrograms per cubic meter
RH- Relative Humidity
WS- Wind Speed
WD- Wind Direction
AT- Air Temperature
RF- Rainfall


