Impacts of Dyeing Effluent on Surface Water Around Cottage Industrial Areas
Md Zohurul Islam1
 , M Rashidul Hasan2
and M Golam Mostafa1
*
, M Rashidul Hasan2
and M Golam Mostafa1
*
1
Water Research Lab,
Institute of Environmental Science,
University of Rajshahi,
Bangladesh
2
Department of Civil Engineering,
Prime University,
Dhaka,
Bangladesh
http://dx.doi.org/10.12944/CWE.20.1.17
Copy the following to cite this article:
Islam M. Z, Hasan M. R, Mostafa M. G. Impacts of Dyeing Effluent on Surface Water Around Cottage Industrial Areas. Curr World Environ 2025;20(1). DOI:http://dx.doi.org/10.12944/CWE.20.1.17
Copy the following to cite this URL:
Islam M. Z, Hasan M. R, Mostafa M. G. Impacts of Dyeing Effluent on Surface Water Around Cottage Industrial Areas. Curr World Environ 2025;20(1).
Download article (pdf)
Citation Manager
Publish History

Introduction
The cottage industry is one of the sectors of the small textile industry. Various kinds of natural, azo, and toxic dyes are used in the cottage textile industries.1,2 Discharge of untreated effluent, sewage, sludge, and solid waste into open spaces and water bodies causes environmental digression.1-5 The cottage textile dyeing effluents have contained a higher amount of heavy metals, such as Cr, Mn, Fe, Co, Ni, Cu, Zn, As, Cd, and Pb, which are broadly used in the production of color.6-8 Important parameters in effluent from the textile dyeing industry are ammonia (NH3), COD, BOD, pH, TSS, TDS, TOC, EC, DO, Cl-, and NO3-, which exceed the standard permissible limit. As a result, environmental deterioration has become a threat to many villages in the studied areas.9-11 According to the quantity of industries and their effluent discharge rates, the waste management processes of the cottage textile dyeing industries are insufficient.12-14 In this area, there isn't a single treatment plant. The cottage industry areas grow more, and as a result, they discharge untreated effluent into the environment, creating huge pollution.15,16 A proper evaluation is required to explore the pollution levels for keeping a sustainable environment in the areas.17-20 Very few reports were found about the characterization of textile dye effluents on the environment, located at Savar in Dhaka, Tongi in Gazipur, and Narayanganj districts. There is no detailed research on the untreated textile dyeing effluent. The objective of the study was to characterize the cottage textile dyeing effluent and assess the impacts on the surface water around industries of the Sirajganj District.
Materials and Methods
Study Area
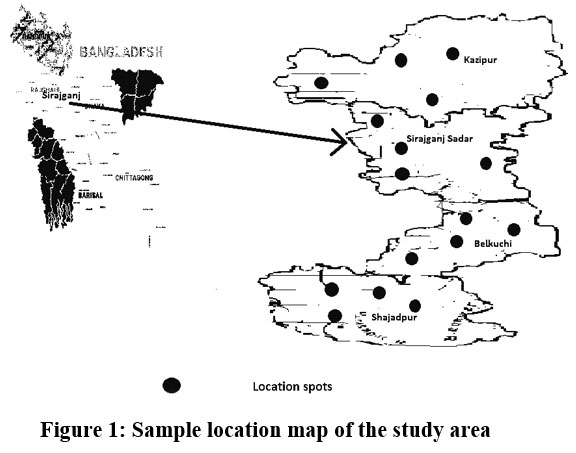
The study area is a district of Rajshahi division in Bangladesh, named Sirajganj. It consisted of four Upazilas, named Kazipur, Belkuchi, Shajadpur, and Sirajganj Sadar (Figure 1).
Sample collection
A total 96 surface water samples were collected from different textile dyeing industries effluent discharged into surface water bodies in three seasons of 2020 and 2021. All the water samples were collected and stored according to standard sampling methods.21-23
 |
|
Sample preparation and analysis
Some physicochemical parameters, including temperature (Model: HANNA instrument Thermometer, 2018), EC (Model: HANNA instrument EC 2014), pH (Model: HANNA instrument pH 2009), and DO (Model: HANNA instrument; YK 22DO) of water samples, were instantaneously measured in the field using a multi-meter. The other physicochemical parameters, such as TSS, TDS, turbidity(Model: TU-2016), TH, BOD, COD, TOC, anionic parameters, including Cl-, HCO3-, SO42-, NO3-, and PO43-, cationic parameters, including Na+, K+, Mg2+, Ca2+, and heavy metals of the samples, were investigated following the standard methods of analysis.24 The empirical data were then analyzed using different computer software.25-26
Results and Discussion
This study was tried to characterize the discharged untreated effluents from cottage industries in Sirajganj District, Bangladesh, and the results are discussed here.
Characterization of surface water
Physicochemical characteristics of surface water
The major parameters of surface water samples and their period-based characteristics for two years of the study (Table 1 and Figure 2), are interpreted below.
Temperature
The maximum and minimum temperatures were found to be 37.74 oC and 17.80 oC in the monsoon period and the post-monsoon periods of 2021, respectively, those were within the standards of the DoE-BD and WHO. The results indicate that the surface water temperature varies with seasonal temperature.
Dissolved Oxygen (DO)
The maximum and minimum dissolved oxygen (DO) were found to be in the post-monsoon and pre-monsoon periods of 2021, which is very logical, as the water volume decreased in these seasons. The biannual mean value of DO was found to be 6.68 mg/L with a standard deviation of 0.47 (Table 1). The dissolved oxygen (DO) of most of the surface water samples was found to be very low from the standard permissible limit recommended by the DoE-BD and WHO.
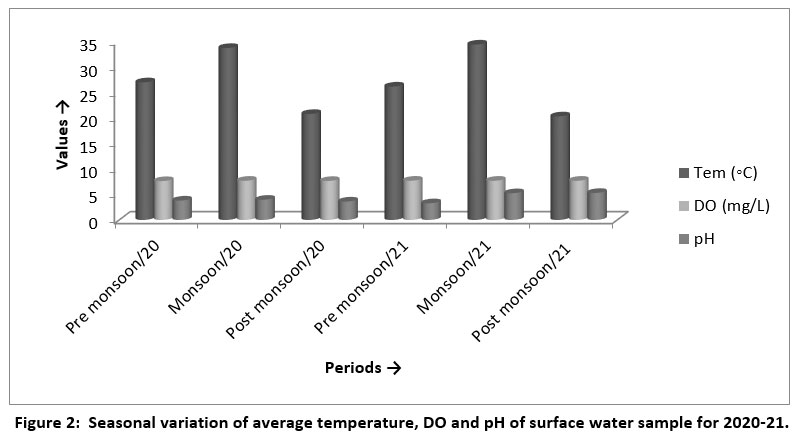 | Figure 2: Seasonal variation of average temperature, DO and pH of surface water sample for 2020-21.
|
The various dissolved oxygen (DO) values of the collected surface water sample showed seasonal variations (Figure 2). The overall dissolved oxygen (DO) concentration of surface water samples was very low, which indicates that the water is unsuitable for drinking purposes as well as unfavorable for fisheries.13,27
Table 1: Biannual descriptive statistics of some parameters during 2020 and 2021.
Parameters | Minimum | Maximum | Mean ± SD | Standard | |
DoE-BD, 2008 | WHO | ||||
DO (mg/L) | 0.28 | 6.27 | 6.68±0.47 | 4.5-8 | 6 |
pH | 6.91 | 10.12 | 8.17±1.44 | 6-9 | 6-9 |
EC (µS/cm) | 824.20 | 1316.97 | 1414.2±484.24 | 1200 | 1200 |
TDS(mg/L) | 439 | 4639 | 2530±35.54 | 2100 | 2100 |
TSS(mg/L) | 91 | 485 | 293±29.84 | 150 | 100-150 |
TH (mg/L) | 178.60 | 808.34 | 168.38±26.44 | 20-50 | 50 |
Turbidity (NTU) | 19.83 | 157.42 | 87.32±18.28 | -- | 5 |
pH
The biannual mean concentration of pH was found to be 8.1705 with a standard deviation of 1.445 (Table 1), indicating that the surface water was basic or alkaline. The pH of most of the surface water samples was found high than the standard of DoE-BD and WHO.
Electrical conductivity
The biannual mean value of EC was 1414.29 with a standard deviation of 484.24 (Table 1). The EC of most of the surface water sample was found to be higher than the standard permissible limits recommended by the DoE-BD and WHO. The EC of surface water samples was increased in pre-monsoon due to a decrease in water volume due to the water volume effects.
Total Dissolved Solids
The biannual mean concentration of TDS was 2530, with a standard deviation of 35.54 (Table 1). The TDS of most of the surface water sample was found to be higher than the standard permissible limits recommended by the DoE-BD and WHO. During the monsoon, the water volume increased and thus decreased in TDS.
Total Suspended Solids (TSS)
The biannual mean concentration of TSS was 293 with a standard deviation of 29.84 (Table 1). The TSS of most of the surface water sample was found to be higher than the standard permissible limit of the DoE-BD and WHO.
BOD, COD, and TOC
The analysis results showed that the BOD, COD, and TOC values of surface water were higher than the standard of DoE-BD, WHO, and BNDWQS. The possible causes behind the higher BOD, COD and TOC of the surface water were the mixing of waste water and the discharge of industrial effluent.
Anionic characteristics of surface water
The anionic perimeters like Cl-, HCO3- , SO42- , NO3--N, NO3-, and PO43- of surface water samples were analyzed. Those concentrations of the effluent found that the samples contained excess that was more than three times higher than the DoE-BD, FAO, and WHO standards.
Table 2: Biannualdescriptive statistics of cation and anion parameters in surface water samples during 2020 and 2021.
Parameter (mg/L) | Pre-monsoon | Monsoon | Post-monsoon | Standards | ||
Mean ± SD | Mean ± SD | Mean ± SD | DoE-BD, 2008 | Mean ± SD | ||
Cl- | 227.3±38.4 | 111.1±53 | 133.9±5.2 | 150-600 | 250 | 1065 |
HCO3- | 107.2±5 | 100.1±11 | 107.1±5.8 | 200-500 | -- | 610 |
SO42- | 35.6±7.3 | 22.8±0.9 | 30.7±0.4 | 400 | 250 | 960 |
NO3- | 25.6±5.3 | 20.3±3.2 | 21.5±3.2 | 10 | 10 | <10 |
PO43- | 1.5±0.3 | 1.2±0.2 | 0.8±0.2 | -- | 0.1-0.05 | 2.0 |
Na+ | 350.1±25.5 | 273.0±14.7 | 287.1±13.4 | 200 | 200 | 920 |
K+ | 19.8±8.8 | 15.6±5.3 | 17.10±6.3 | 12 | -- | 15 |
Mg2+ | 42.17±13.8 | 36.44±9.7 | 40.12±11.4 | 30-35 | -- | 60 |
Ca2+ | 256.8±38.7 | 226.4±29.8 | 244.6±31.2 | 75 | -- | 400 |
Characteristics analysis of trace elements of surface water
In this study, 10 heavy metals, namely Cr, Mn, Fe, Co, Ni, Cu, Zn, As, Cd, and Pb, were analyzed covering two years in 2020 and 2021. The analysis results of the surface water samples are stated in Table 3 and Table 4.
Chromium (Cr)
The minimum concentration of Cr in surface water samples was found to be 0.033 mg/L, and the maximum was found to be 0.256 mg/L. The mean value of Cr was found to be 0.146 mg/L, and the standard deviation was 0.084 (Table 3). The highest mean concentration of Cr in surface water samples was obtained to be 0.158 mg/L in the post-monsoon period of 2021, and the lowest was 0.138 mg/L in the monsoon period of 2020 (Table 4). Suteu et al28 illustrated a similar observation for the surface water samples, where the Cr concentration varied from 0.116 to 0.194 mg/L. Tareque et al29 also did a similar observation on the surface water samples in the BSCIC industrial area of Rajshahi, where the highest mean value was 0.052 mg/L, which was similar to the present study. In the study area, the concentration of Cr was within the permissible limit of DoE-BD (Table 3).
Manganese (Mn)
The minimum concentration of Mn in surface water samples was found to be 0.089 mg/L, and the maximum was 1.65 mg/L. The value of Mn in the surface water samples was found to be 1.01 mg/L, and the standard deviation was 0.02 (Table 3). The highest mean value of Mn in the surface water samples was obtained to be 0.158 mg/L in the post-monsoon period of 2021, and the lowest was 0.864 mg/L in the monsoon period of 2020 (Table 4). In the study area, the concentration of Mn was within the permissible limit.
Iron (Fe)
The minimum value of Fe in the surface water samples was found to be 0.468 mg/L, and the maximum was 4.43 mg/L. The mean value of Fe was found to be 2.11 mg/L, and the standard deviation was 1.01 (Table 3). The highest mean value of Fe was obtained to be 3.11mg/L in the pre-monsoon period of 2021, and the lowest was 1.80 mg/L in the monsoon period of 2021 (Table 4). As the results the concentration of Fe followed the order of pre-monsoon > post-monsoon > monsoon. Islam et al6 conducted research on the surface water samples collected from the BSCIC industrial area of Rajshahi, where the highest mean value was 0.683 mg/L, which was similar to the present study. In the study area, the maximum concentration of Fe was found within the permissible limit recommended by the DoE-BD (Table 3).
Table 3: Descriptive statistics of heavy metal concentrations in surface water during 2020 and 2021.
Parameters, (mg/L) | Minimum | Maximum | Mean±SD | DoE-BD standard (mg/L), 2008 |
Fe | 0.468 | 4.43 | 2.10±1.01 | 2.0 |
Mn | 0.089 | 1.65 | 1.01±0.02 | 5.0 |
Zn | 2.15 | 5.12 | 7.13±0.08 | 5.0 |
Cr | 0.033 | 0.256 | 0.14±0.08 | 0.5 |
Cd | 0.001 | 0.091 | 0.04±0.01 | 0.05 |
Pb | 0.101 | 0.423 | 0.26±0.08 | 0.1 |
Co | 0.112 | 0.316 | 0.21± 0.02 | 0.2 |
Ni | 0.105 | 0.315 | 0.21±0.05 | 0.1 |
Cu | 0.104 | 0.107 | 0.15±0.08 | 0.1 |
As | 0.032 | 0.178 | 0.11±0.03 | 0.2 |
Cobalt (Co)
The highest mean concentration of Co in the surface water samples was obtained to be 0.234 mg/L in the pre-monsoon period of 2021, and the lowest was 0.198 mg/L in the monsoon period of 2020 (Table 4). The results showed that the concentration of Co in the surface water samples followed the order of pre-monsoon > post-monsoon > monsoon, which may be the cause of dilution effects. In the study area, the concentration of Co was found to be a little higher than the standard permissible limit recommended by the DoE-BD (Table 3).
Nickel (Ni)
The mean concentration of Ni in the surface water samples was obtained to be 0.228 mg/L in the pre-monsoon period of 2020, and the lowest was 0.196 mg/L in the monsoon period of 2020 (Table 4). According to the results showed the concentration of Ni in the surface water samples followed the sequences of pre-monsoon > post-monsoon > monsoon, which may be due to the dilution effects. In the study area, the concentration of Ni was found to be 2–3 times higher than the standard o DoE-BD (Table 3).
Copper (Cu)
The mean Cu concentration was found to be 0.155 mg/L, and the standard deviation was 0.081 (Table 3). The highest mean was obtained to be 0.245 mg/L in the post-monsoon period of 2021, and the lowest was 0.140 mg/L in the monsoon period of 2021 (Table 4). In the study area, the concentration of Cu was found to be 1 to 1.5 times higher than the standard of DoE-BD (Table 3), indicating low Cu poisoning in the area. A report showed that the Cu values ranged from 0.109 mg/L to 0.225 mg/L near the Konabari industrial area of Gazipur district in Bangladesh which is similar to the present observation, suggesting Cu pollution of surface water around the industrial areas might be the cause of untreated effluent discharge.
Zinc (Zn)
The minimum concentration of Zn in the surface water samples was found to be 2.15 mg/L, and the maximum was 5.12 mg/L and the standard deviation was 0.087 (Table 3). The value of Zn in the surface water was obtained to be 3.41 mg/L in the pre-monsoon period of 2021, and the lowest was 2.29 mg/L in the monsoon period of 2020 (Table 4). As the results Zn in the surface water samples followed the sequence: pre-monsoon > post-monsoon > monsoon. In the study area, the concentration of Zn found a little higher than the standard permissible limit of DoE-BD (Table 3).
Lead (Pb)
The minimum concentration of Pb was found to be 0.101 mg/L, and the maximum was 0.423 mg/L. The mean Pb was found to be 0.262 mg/L, and the standard deviation was 0.08 (Table 3). The highest mean Pb in the sample was obtained to be 0.268 mg/L in the pre-monsoon period of 2020, and the lowest was 0.236 mg/L in the monsoon period of 2020 (Table 4). As the results Pb in the surface water samples followed the sequence: pre-monsoon > post-monsoon > monsoon. In the study area, the concentration of Pb was 2 to 4 times higher than the standard permissible limit of DoE-BD (Table 3). The study results indicate Pb poisoning in the area.
Table 4: Seasonal variation of average Cr, Mn, Fe, Co, Nice, Zn, As, Cd, and Pb of surface water samples from 2020-2021.
Period | Heavy metals (mg/L) | ||||||||||
Cr | Mn | Fe | Co | Ni | Cu | Zn | Pb | Cd | As | ||
2020 | Pre-monsoon | 0.151 | 1.008 | 2.104 | 0.224 | 0.228 | 0.167 | 7.238 | 0.268 | 0.0446 | 0.104 |
Monsoon | 0.141 | 0.864 | 1.853 | 0.198 | 0.196 | 0.143 | 5.294 | 0.236 | 0.0398 | 0.086 | |
Post-monsoon | 0.154 | 1.026 | 2.171 | 0.212 | 0.211 | 0.158 | 6.316 | 0.254 | 0.0452 | 0.116 | |
2021 | Pre-monsoon | 0.148 | 1.016 | 3.111 | 0.234 | 0.223 | 0.177 | 7.418 | 0.276 | 0.0448 | 0.112 |
Monsoon | 0.138 | 0.902 | 1.804 | 0.206 | 0.208 | 0.140 | 5.993 | 0.241 | 0.0401 | 0.092 | |
Post-monsoon | 0.158 | 1.058 | 2.188 | 0.201 | 0.210 | 0.245 | 6.262 | 0.257 | 0.0464 | 0.129 | |
Cadmium (Cd)
The minimum concentration of Cd was found to be 0.001 mg/L, and the maximum was 0.091 mg/L. The mean concentration of Cd was found to be 0.045 mg/L, and the standard deviation was 0.001 (Table 3). The highest mean value of Cd in the surface water was found to be 0.046 mg/L in the post-monsoon period of 2021, and the lowest was 0.039 mg/L in the monsoon period of 2020 (Table 4). The results showed that the Cd in the surface water samples followed the order of post-monsoon > pre-monsoon > monsoon. In the study area, the concentration of Cd was found within the standard permissible limit (Table 3).
Arsenic (As)
The minimum As concentration of As was found to be 0.032 mg/L, and the maximum was 0.178 mg/L. The mean As concentration was found to be 0.105 mg/L, and the standard deviation was 0.032 (Table 3). The highest mean value of As was obtained to be 0.013 mg/L in the post-monsoon period of 2021, and the lowest was 0.086 mg/L in the monsoon period of 2020 (Table 4). The As concentration followed the order of post-monsoon > pre-monsoon > monsoon. The As was found within the standard permissible limit recommended by the DoE-BD (Table 3).The study results indicate no As poisoning in the area.
Detection of functional groups in surface water samples
The study displayed the presence of some organic functional groups in surface water samples using FTIR. Figure 3 showed the peaks for a large number of functional groups.
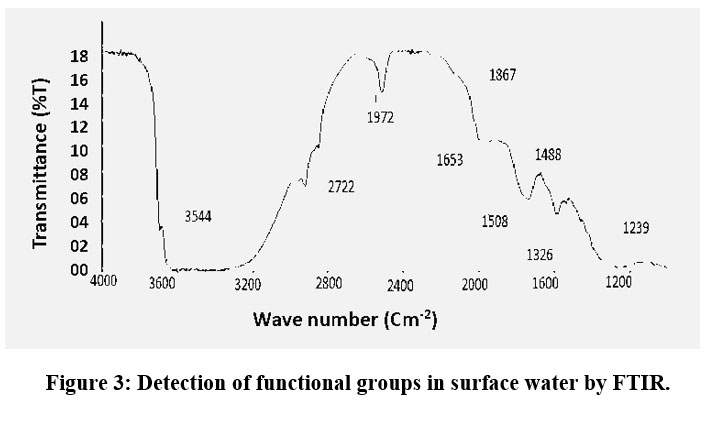 | Figure 3: Detection of functional groups in surface water by FTIR.
|
In the study, a large number of functional groups were found in surface water samples, which were detected by FTIR. The frequency ranges of surface water samples were found to be 484 cm-1 to 3650 cm-1. In the ranges of 2000 to 2640 cm-1 the absorption appearance was found to be strong, in the ranges of 460 to 1980 cm-1 the absorption appearance was found to be medium, and in the range of 2650 cm-1 to 3650 cm-1, the absorption appearance was found to be weak.30 The absorption frequency ranges of 600 to 1610 cm-1 were found for C-I, C-Br, C-Cl, N-H, and C
Pollution Indices
This study analyzed Cif, Cd, mCd, and PLI of heavy metals in surface water in the study area from 16 locations during 2020 and 2021.
Contamination factor (Ci)
The study illustrated that the values of the Cif were found in the order of MnCastro-Gonz´alez et al4 illustrated a similar observation for the Surface water, where the Cr contamination factor varied from 0.22 to 0.09, Mn 0.02 to 1.12, Cd 1.10 to 10.12, Zn 1.43 to 3.09, and Pb 0.42 to 2.90.
Degree of contamination (Cd)
The degree of contamination (Cd) of heavy metals in the surface water of the study area was analyzed between 2020 and 2021. The lowest value was 9.28 in sample no. SW-4 and the highest value was 18.04 in ES-1 (Table 5). The lowest value was indicated as the moderate (8< Cd<16) contamination level and the highest value was indicated as the high (16d<32) contamination level (Table 6). The analysis results showed that among the sixteen samples, one was high; two were low, and the other nine samples had a moderate contamination level. (22) conducted a research on surface water samples where the degree of contamination (Cd) varied from 6.26 to 15.22, and the highest degree of contamination was found in the pre-monsoon period.
The modified contamination degree (mCd)
The heavy metals mCd in the surface water of the study area was analyzed for 2020 and 2021. The lowest value was 1.81 in sample no. ES-4, and the highest value was 4.11 in sample no. ES-1 (Table 5). The lowest value was indicated as the low (1.5< mCd< 2) contamination level, and the highest value was indicated as the high (4< mCd< 8) contamination level (Table 6). The analysis results showed that among sixteen samples, one was high; three were low, and others had a moderate contamination level.
Table 5: Average of contamination factors, degree of contamination (Cd), modified degree of contamination (mCd), and pollution load index (PLI) of heavy metals in surface water for 2020 to 2021.
Sample No. | Cif | Cd | Contamination level | mCd | PLI | ||||
Cr | Mn | Cd | Zn | Pb | |||||
SW-1 | 1.04 | 0.112 | 11.71 | 2.59 | 0.59 | 18.04 | High | 4.11 | 1.67 |
SW-2 | 0.736 | 0.128 | 8.59 | 2.30 | 0.31 | 14.06 | Moderate | 2.81 | 1.30 |
SW-3 | 0.768 | 0.096 | 9.36 | 2.20 | 0.22 | 14.64 | Moderate | 2.92 | 1.35 |
SW-4 | 0.464 | 0.064 | 5.10 | 1.82 | 0.72 | 9.28 | Low | 1.81 | 0.86 |
SW-5 | 0.641 | 0.096 | 11.23 | 2.68 | 0.65 | 17.34 | Moderate | 3.46 | 1.60 |
SW-6 | 0.832 | 0.112 | 8.99 | 2.51 | 0.52 | 14.96 | Moderate | 2.99 | 1.38 |
SW-7 | 0.496 | 0.080 | 11.39 | 1.52 | 0.54 | 15.00 | Moderate | 3.01 | 1.38 |
SW-8 | 0.640 | 0.064 | 9.34 | 2.06 | 0.11 | 14.17 | Moderate | 2.83 | 1.31 |
SW-9 | 0.624 | 0.128 | 9.81 | 2.38 | 0.38 | 15.32 | Moderate | 3.06 | 1.41 |
SW-10 | 0.768 | 0.096 | 6.59 | 1.69 | 0.69 | 10.84 | Moderate | 2.16 | 1.01 |
SW-11 | 0.432 | 0.048 | 4.59 | 2.96 | 0.90 | 9.95 | Low | 1.99 | 0.92 |
SW-12 | 0.736 | 0.096 | 9.37 | 2.16 | 0.16 | 14.52 | Moderate | 2.90 | 1.34 |
SW-13 | 0.464 | 0.064 | 5.10 | 1.82 | 0.72 | 9.28 | Low | 1.85 | 0.85 |
SW-14 | 0.641 | 0.096 | 11.23 | 2.69 | 0.65 | 17.34 | Moderate | 3.46 | 1.60 |
SW-15 | 0.832 | 0.112 | 8.99 | 2.55 | 0.52 | 14.96 | Moderate | 2.99 | 1.38 |
SW-16 | 0.496 | 0.080 | 11.39 | 1.53 | 0.54 | 15.00 | Moderate | 3.01 | 1.38 |
The pollution load index (PLI)
The PLI of heavy metals in the surface water were analyzed for 2020 and 2021. The lowest value was 0.85 in sample no. SW-13, and the highest value was 1.67 in sample no. SW-1 (Table 5). The highest value was found within the range of (>1), which indicated that pollutant was present and contaminated, and the lowest value was found within the range of (<1), which indicated nil to low pollution (Table 7). The results showed that all the samples were lowly polluted. A similar research study was conducted by (2) on effluent samples, where the pollution load indexes (PLI) varied from 0.654 to 1.09, which supported to the present study.
Table 6: The contamination factor (Cif), contamination degree (Cd), modified contamination degree (mCd), and pollution level (Hakanson 1980, Abrahim and Parker 2008).
Cif | Cd | mCd | Pollution level. |
-- | -- | 1.5> mCd | very low or nil |
Cif <1 | Cd< 8 | 1.5< mCd< 2 | Low |
1<Cif<3 | 8< Cd<16 | 2< mCd< 4 | Moderate |
3<Cif<6 | 16<Cd<32 | 4> mCd< 8, | High |
Cif>6 | Cd > 32 | 16> mCd >8 | Very high |
-- | -- | 32> mCd >16 | Extremely high |
32< mCd | Ultra high |
Table 7: Pollution load index (PLI) and contamination level (Tomlinson 1980).
Polution load index (PLI) | Contamination level |
0 | Perfection |
< 1 | Nil to low pollution |
1 | Pollutants present |
>1 | Contaminated |
In the study, the PLI values of three samples were found to be below one, and those of the other samples were found to be higher than one (Table 5). So the study results indicated that the surface water is going to be contaminated by dyeing effluent around the cottage textile zone in Bangladesh.
Potential ecological risk assessment
The Eir and RI of heavy metals in the surface water of the study area were analyzed for 2020 and 2021 and the cottage industrial zone of study area was found to be in the following order: Cd > Pb > Zn >Cr > Mn.
The Eir of Cd were found within the range of 133.81 to 359.70 (Table 8), which belong to higher and higher ecological risk.31 Mn, Cr, Zn, and Pb were all found to be lower than 40, which belong to low ecological risk.31 On the other hand, the risk indexes (RI) were found within the range of 133.81 to 359.70, which belong to low, moderate, and severe ecological risk.31 The results indicated that there was low, moderate, and severe ecological risk for surface water in the study area.
Table 8: Average Eir and RI of heavy metals in surface water samples for 2020 to 2021.
Sample ID | Potential ecological risk factors (Eir) | Risk index | Pollution degree | ||||
Cr | Mn | Cd | Zn | Pb | |||
SW-1 | 2.16 | 0.121 | 351.10 | 2.70 | 3.60 | 359.70 | Severe |
SW-2 | 1.33 | 0.121 | 258.32 | 2.25 | 2.61 | 264.64 | Moderate |
SW-3 | 1.54 | 0.107 | 281.07 | 2.20 | 2.73 | 287.66 | Moderate |
SW-4 | 1.45 | 0.094 | 127.24 | 2.014 | 3.00 | 133.83 | Low |
SW-5 | 1.56 | 0.107 | 336.76 | 2.68 | 2.55 | 343.61 | Severe |
SW-6 | 1.68 | 0.105 | 270.04 | 2.47 | 3.73 | 278.04 | Moderate |
SW-7 | 1.22 | 0.072 | 341.5 | 1.49 | 2.27 | 346.55 | Severe |
SW-8 | 1.36 | 0.060 | 281.21 | 2.06 | 2.69 | 287.39 | Moderate |
SW-9 | 1.11 | 0.126 | 293.69 | 2.32 | 4.17 | 301.44 | Severe |
SW-10 | 1.52 | 0.107 | 196.94 | 2.85 | 2.50 | 203.94 | Moderate |
SW-11 | 1.83 | 0.126 | 136.84 | 2.50 | 4.88 | 146.21 | Low |
SW-12 | 1.57 | 0.104 | 280.72 | 2.33 | 3.17 | 287.91 | Moderate |
SW-13 | 1.45 | 0.094 | 127.24 | 2.014 | 3.00 | 133.81 | Low |
SW-14 | 1.56 | 0.107 | 336.76 | 2.68 | 2.55 | 343.67 | Severe |
SW-15 | 1.68 | 0.105 | 270.04 | 2.47 | 3.73 | 278.04 | Moderate |
SW-16 | 1.22 | 0.072 | 341.5 | 1.49 | 2.27 | 346.59 | Severe |
The RI lowest value of heavy metals indicated a low (RI < 150) pollution level, and the highest value indicated a severe (300 < RI < 600) pollution level. The analysis results showed that three samples had a low pollution level, six samples had moderate pollution, and others had a severe pollution level among the sixteen surface water samples. Confirmative research was done by Chang et al.30 on surface water samples, where the RI of heavy metals in surface water was found in the range of 124.67 to 432.09. The analysis results express that the highest pollution factor (Cif) was found in the range of 1.10 to 10.12, expressing moderate to ultra-high pollution levels of Cd. The degree of contamination was found 6.26 to 15.22, the mCd varied from 0.953 to 5.24, and the pollution load indexes (PLI) varied from 0.654 to 1.09, indicating low to moderate contamination levels. The highest ecological risk factors (Eir ) were found in the range of 124.25 to 357.71, indicating a higher to serious ecological risk for Cd in the study areas. The ecological risk index (RI) varied from 124.67 to 432.09, expressing moderate to serious ecological risk. The study observation showed that the contamination level belonged to a high of 3%, a moderate of 78%, and a low of 19%, of samples, and the pollution degree belonged to a severe of 22%, a moderate of 61%, and a low of 17% of surface water samples (not mention in Table).
Conclusion
The analysis results showed that the EC, pH, TSS, turbidity, TDS, BOD, COD, Cl-, HCO3-, CO32-, SO42-, NO3-, Cr, Cu, Pb, Zn, As, and Cd, in surface water were found to be higher than the DoE-BD standard. The most toxic heavy metals, such as Cr, Mn, Cd, and Pb, were found to be higher than the standard values in all collected samples, which showed that the cottage textile industries are creating pollution in the study areas. The FTIR analysis showed that the surface water samples contained toxic functional groups like azo, cyano, etc. The analysis reports showed that the highest contamination factor (Cif) was found to be moderate to ultra-high contamination levels, and the highest ecological risk factors (Eir) were found to be higher to serious ecological risk in surface water samples for Cd, indicating serious Cd poisoning in the sampling area. The Cd, mCd, and PLI were found to be low to moderate contamination levels, and the risk index (RI) was found to be moderate to serious ecological risk in surface water samples in the sequence of Cd> Zn > Cr > Pb >Mn. The pollution level and degree of all types of samples were followed in the order of post-monsoon > pre-monsoon > monsoon. Overall observation showed that most of the parameters of surface water samples exceeded the DoE-BD, WHO, and BNDWQ standard permissible levels. There is no treatment plant found in any cottage dyeing industry in the area. The pollution load will continue to increase and further reduce the water quality. The study illustrated the discharged untreated effluents into nearby water bodies. The study recommends using a few poisonous Cd less dyes in cottage industries in the study areas. To install an effluent treatment plant (ETP) in the study area to indemnify water quality and the environment. In this discretion, embed an ETP for each industry or a central effluent treatment plant (CETP) for an industrial hub is advice for sustainable wastewater management and environmental sustainability. The people must be aware and take proper steps for a better world to outlive and for the improvement of the future generation.
Acknowledgment
One of the authors would like to thank the Institute of Environmental Science, University of Rajshahi, Bangladesh, for providing him with a fellowship.
Funding Sources
The author(s) received no financial support for the research, authorship, and/or publication of this article.
Conflict of Interest
The author(s) declare no conflict of interest.
Data Availability Statement
This statement does not apply to this article.
Ethics Statement
This research did not involve human participants, animal subjects, or any material that requires ethical approval.
Informed Consent Statement
This study did not involve human participants, and therefore, informed consent was not required.
Author Contributions
Md. Zohurul Islam: Conceptualization, Methodology, Data Collection, Analysis, Writing – Original Draft.
Md. Rashidul Hasan: Conceptualization, Resources, Supervision.
M. G. Mostafa: Conceptualization, Methodology, Supervision, Project Administration, Funding Acquisition, Resources, Supervision, writing-review & editing.
References
- Islam, M.R. and Mostafa, M.G. (2022). “Adsorption kinetics, isotherms and thermodynamic studies of methyl blue in textile dye effluent on natural clay adsorbent”. Sust. Wat. Res.Mgt., 8:52. DOI: 10.1007/s40899-022-00640-1
CrossRef - Suthar, J. Sharma, M. Chabukdhara, and A. K. Nema, (2010). Water quality assessment of river Hindon at Ghaziabad, India: impact of industrial and urban wastewater. Environmental Monitoring and Assessment, vol. 165, no. 1-4, pp. 103–112, 2010.
CrossRef - Verma Pradeep, Chandawat Deepika, Gupta Urvi and Solanki Hitesh. Water Quality Analysis of an Organically Polluted Lake by Investigating Different Physical and Chemical Parameters. International Journal of Research in Chemistry and Environment , Vol. 2 Issue 1 January 2012(105-111) , ISSN 2248-9649.
- Castro-Gonz´alez and M. M´endez-Armenta (2008) “Heavy metals: Implications associated to fish consumption,” Environmental Toxicology and Pharmacology, vol. 26, no. 3, pp. 263–271.
CrossRef - Emongor, E. Nkegbe, B. Kealotswe, I. Koorapetse, S. Sankwasa, and S. Keikanetswe (2005) “Pollution indicators in dyeing effluent,” Journal of Applied Sciences, vol. 5, no. 1, pp. 147–150.
CrossRef - Islam, M.R., and Mostafa, M.G. (2020). Characterization of textile dyeing effluent and its treatment using polyaluminum chloride. Appl Water Sci 10, 119. https://doi.org/10.1007/s13201-020-01204-4
CrossRef - Pvaneswari (2006) Toxicity assessment and microbial degradation of azo dyes. Indian journal of experimental biology 44(8): 618. 12.
- Naveed, S.; Bhatti, I. & Ali, K. (2006). Membrane technology and its suitability for treatment of textile waste water in Pakistan. Journal of Research (Science), Bahauddin Zakariya University, Multan, Pakistan, Vol. 17, No. 3, pp 2315.
- Hasan, R., & Leonas, K. K. (2018). Collaborative approach for water & energy conservation: clothing industry of Bangladesh. Journal of Textile and Apparel, Technology and Management, 10(4), 1-11.
- Haque, H. Yasmin, and M. Rahman (2002). Environmental Pollution in Bangladesh. Earth Community Organization (ECO), pp. 38–47, 2002.
- Sayed, M.A. and Mostafa, M.G. (2023). Characterization of Textile Dyeing Effluent and Removal Efficiency Assessment of Al2(SO4)3 Coagulant. Journal: Asian Journal of Applied Science and Technology (AJAST), 7(3), 195-212.
CrossRef - Khan, S., & Malik, A. (2014). Environmental and health effects of textile industry wastewater. In Environmental Deterioration and Human Health (pp. 55-71). Springer, Dordrecht.
CrossRef - Nusrat, Mohanty, and N. Behera (2010). “Physico-Chemical analysis of surface and ground water of Baragarh District, Orissa, India,” International Journal of Research & Reviews in Applied Sciences, vol. 2, no. 3.
- Sultana, M. S. Islam, R. Saha, and M. Al-Mansur, “Impact of the Effluents of Textile Dyeing Industries on the Surface Water Quality inside D.N.D Embankment, Narayanganj, Bangladesh Journal of Scientific and Industrial Research, vol. 44, no. 1, pp. 65–80, 2009.
CrossRef - Das, Monica; Ahmed, M.K.; Islam, M.S.; Islam, M.M.; Akter, M.S. (2011). “Heavy Metals in Industrial Effluents (Tannery and Textile) and Adjacent Rivers of Dhaka City, Bangladesh”. Terrestrial and Aquatic Environmental Toxicology, 5 (1): 8-13, 2011.
- Nusrat, Mohanty, and N. Behera (2010), Iran. “Physico-Chemical analysis of surface and ground water of Baragarh District, Orissa, India,” International Journal of Research & Reviews in Applied Sciences, vol. 2, no. 3.
- DoE-BD (2008). Guide for assessment of effluent treatment plants in EMP/ EIA reports for textile industries. Department of Environment. Ministry of Environment and Forest, Bangladesh, p A-2
- Ramesh Babu, B.; Parande, A.K.; Raghu, S. & Prem Kumar, T. (2007). Textile technology. Cotton Textile Processing: Waste Generation and Effluent Treatment. The Journal of Cotton Science, Vol.11, pp.141-153 26.
- Islam, M.S. and M. G. Mostafa (2023). Occurrence, Source, and Mobilization of Iron, Manganese, and Arsenic Pollution in Shallow Aquifer. Geofluids, Volume 2023, Article ID 6628095, 19 pages. doi.org/10.1155/2023/6628095.
CrossRef - Neill C, Hawke F, Hawkes D, Lourenco N, Pinheiro H, Delee W (1999) Colour in Textile Effluents-Sources, Measurement, Discharge Consents and Simulation: A Review. J Chem Technol Biotechnol 74: 1009-1018.
CrossRef - Rummi Devi Saini 18. Robinson, T.; McMullan, G.; Marchant, R. & Nigam, P. (2001). Remediation of dyes in textile effluent: a critical review on current treatment technologies with a proposed alternative. Bioresource Technology, vol.77, pp.247-255 19.
CrossRef - Gupta, V., Agarwal, A., Singh, M. K., & Singh, N. B. (2017). Removal of Red RB dye from aqueous solution by belpatra bark charcoal (BBC) adsorbent. Journal of Materials and Environmental Sciences, 810, 3654-3665.
- Khan, S., & Malik, A. (2014). Environmental and health effects of textile industry wastewater. In Environmental Deterioration and Human Health (pp. 55-71). Springer, Dordrecht.
CrossRef - APHA American Public Health Association (2017). Standard Methods for the Examination of Water and Wastewater (23rd ed.). Washington DC.
- Rahman, T., and Mostafa. M.G. (2024). Evaluation of the Irrigation Water Quality of a Canal Contaminated with Textile Dyeing Industry Effluent. Asian Journal of Applied Science and Technology(AJAST), 8(3): 9-25. DOI: not assign.
CrossRef - Venugopal T, Loganathan Giridharan, Muthumanickam Jayaprakash, and Muthumanickam Jayaprakash, A Comprehensive Geochemical Evaluation of the Water Quality of River Adyar, India,October 2008, Bulletin of Environmental Contamination and Toxicology 82(2):211-7.DOI:10.1007/s00128-008-9533-3.
CrossRef - Hasan, R., & Leonas, K. K. (2018). Collaborative approach for water & energy conservation: clothing industry of Bangladesh. Journal of Textile and Apparel, Technology and Management, 10(4), 1-11.
- Suteu, D.; Zaharia, C.; Bilba, D.; Muresan, A.; Muresan, R. & Popescu, A. (2009a). Decolorization wastewaters from the textile industry – physical methods, chemical methods. Industria Textila, Vol.60,No.5, pp.254-263 21.
- Tareque, M.H., Islam, M.A., Mostafa, M.G. (2023). Photocatalytic decomposition of textile dyeing effluents using TiO2, ZnO, and Fe2O3 catalysts, Nepal J Environ Sci, 10(2), 49-58.
CrossRef - Wei-Hsiang Chang, Samuel Herianto, Ching-chang Lee, Hsin Hung, Hsiu-Ling Chen, Science of total environment, volume 786, 10 september, 2021.
- L. Hâkanson (1980). The quantitative impact of pH. bioproduction and Hg-contamination on the Hg-content in fish (pike).
CrossRef


