Estimation of Seasonal Crop Water Requirement Using Support Vector Regression in India's Arid Zone
Satendra Kumar Jain
*
 and Anil Kumar Gupta
1
Department of Computer Science and Applications,
Barkatullah University,
Bhopal,
Madhya Pradesh
India
http://dx.doi.org/10.12944/CWE.20.1.12
Copy the following to cite this article:
Jain S. K. Estimation of Seasonal Crop Water Requirement Using Support Vector Regression in India's Arid Zone. Curr World Environ 2025;20(1). DOI:http://dx.doi.org/10.12944/CWE.20.1.12
Copy the following to cite this URL:
Jain S. K. Estimation of Seasonal Crop Water Requirement Using Support Vector Regression in India's Arid Zone. Curr World Environ 2025;20(1).
Download article (pdf)
Citation Manager
Publish History

Introduction
Efficient use of water is a major global concern. The environment and humans depend on water, which has a limited supply. The world's largest irrigated area, India, is thought to be currently experiencing a shortage of water in many different sectors. One of these is agriculture. This study takes into account the western region of Rajasthan, which experiences water scarcity as a result of lower rainfall and a desert climate. 78% of people living in Rajasthan's rural areas work primarily in agriculture, according to a report titled "Water management for Climate Resilience in Arid Region" that was released by the Central Arid Zone Research Institute in Jodhpur, Rajasthan. Over 85% of the surface and ground water resources are used for agriculture. By 2045, irrigation will only need roughly 49.1 billion cubic meters of water. That amounts to 86% of the total water needed for other uses. India's population is currently increasing at an exponential rate. It is difficult to supply fresh, clean water to both living and non-living things. It is the job of the researchers to provide an optimal approach to water conservation. Evapotranspiration (Plant transpiration and soil evaporation) is the one of the valuable hydrological element and suggested by many researchers to estimate crop water need. FAO PanmanMonteith equation1 is highly well-liked by scientists for this purpose,2utilized this formula to calculate Gujarat's crop water needs for maize and wheat. Apart from it, numerous other equations with low climatic parameters have been proposed by authors and one of them is temperature based3,4, utilised such equations to estimate ETo. Correct crop water requirement prediction can be viewed as a nonlinear problem requiring largescale meteorological data. Therefore, an alternative method of estimating crop water demand could be a machine learning-based model. This field has been the subject of extensive research since the turn of the century.
Geographically, India is a diverse nation. Most of the population live in rural area and their primary profession is agriculture. While some regions have enough water for irrigation (even if through conventional methods that result in significant water loss), others are struggling with a shortage of water. This encourages us to conduct this research and give agriculturalists the best possible irrigation management technique. Utilizing a support vector regression based model, we conduct this study in the arid and dry western region of the country.
Several machine-learning algorithms have been assessed for the purpose of estimating crop evapotranspiration (ETc) and evapotranspiration (ETo). These algorithms include multi-layer perceptron (MLP) and Random Forest,5 Deep Learning,6,7 Gradient Boosting Decision Tree with Bayesian Optimization,8 kNN,9 MLR, RF and Extream Learning Machine (ELM),10 ANN,11-16 MLP with Water Wave Optimization, Particle Swarm Optimization, and Genetic Algorithm,17 Gene Expression Programming(GEP),18,19 SVM, ELM and four tree based ensemble models,20 M5P regression, Bagging, RF, and SVM regression,21 ELM and Adaptive Neuro-fuzzy inference system,22 RF and Generalized regression neural networks,23 kNN, ANN and Adaptive Boosting,24 Geneic Programming, SVM-FFA, ANN and SVM-wavelet,25 Adaptive neuro fuzzy systemsv.26
In the paper, the remaining sections are organized in the following order: the datasets, model development, and support vector regression are discussed in the second section, followed by the study's results in the third, a discussion of the findings in the fourth, and the conclusion in the fifth section.
Materials and Method
Dataset description
Barmer, the western region of Rajasthan, is situated between latitudes 24.58'–26.32'N and longitudes 70.05'– 72.52'E with elevation of 227m. It is located in India's hot, semi-arid region. In this region, summer temperatures can occasionally reach more than 45 oC, and winter temperatures can drop to 0 oC. Due to its proximity to the Thar Desert, this area experiences a water shortage and it receives 277 mm of rain on average annually. Barmer's soil is good for a variety of crops. Wheat is the most important crop during the rabi season among them. The purpose of this research is to use machine learning algorithms to estimate the water need demand for wheat crop in Barmer, Rajasthan, and compare the expected results with the widely used FAO-PM
 56 technique. "Water 2000 AD, the scenario for arid Rajasthan," a research produced by the Central dry Zone Research Institute in Jodhpur, Rajasthan, further validates the expected results. For this purpose, climate statistics from 2000 to 2021 are taken into account and collected from IMD Pune. Studies conducted in this time have not been seen in the literature, particularly in arid regions using machine-learning models. We therefore made the decision to examine how crop evapotranspiration behaved during the first two decades of this century (2000–2021) and how climate change affected it. 8036 samples of daily weather data are included in this span.
Given that wheat is a rabi crop, harvesting typically takes 120 days. This study takes into account the entire period of the winter wheat crop, which runs from November 15 to March 14. There are four growth stages within this 120-day period: 20 days is the first stage, 30 days is the developmental stage, 45 days is the midseason, and 25 days is the late-season. The Table 1 describes the climate data in the specified time frame.
Table 1: Description of climatic data during winter season (Nov-Mar) at Barmer, Rajasthan.
Year (15,Nov14, Mar) | Max_temp (oc) | Min_temp (oc) | Humidity (%) | Wind speed(m/s) at 2m | Net Radiation(MJ/m2/day) |
2000- 2001 | 28.7 | 12.1 | 19.4 | 2.4 | 5.7 |
2001- 2002 | 28.0 | 12.0 | 23.0 | 2.3 | 6.1 |
2002- 2003 | 27.9 | 12.6 | 25.0 | 2.4 | 6.2 |
2003- 2004 | 27.6 | 12.0 | 27.3 | 2.5 | 6.3 |
2004- 2005 | 27.0 | 12.8 | 31.2 | 2.2 | 6.8 |
2005- 2006 | 28.7 | 12.9 | 24.6 | 2.4 | 6.2 |
2006- 2007 | 26.5 | 12.0 | 38.7 | 2.3 | 7.1 |
2007- 2008 | 27.0 | 11.5 | 24.5 | 2.4 | 6.1 |
2008- 2009 | 28.5 | 13.3 | 31.0 | 2.5 | 6.6 |
2009- 2010 | 28.0 | 12.6 | 24.8 | 2.3 | 6.2 |
2010- 2011 | 26.3 | 11.3 | 34.7 | 2.4 | 6.9 |
2011- 2012 | 26.5 | 11.0 | 29.1 | 2.4 | 6.5 |
2012- 2013 | 26.6 | 11.1 | 33.0 | 2.5 | 6.8 |
2013- 2014 | 26.5 | 11.3 | 30.0 | 2.4 | 6.6 |
2014- 2015 | 27.2 | 11.7 | 30.0 | 2.6 | 6.6 |
2015- 2016 | 28.0 | 12.5 | 27.8 | 2.3 | 6.5 |
2016- 2017 | 28.3 | 12.9 | 26.7 | 2.2 | 6.3 |
2017- 2018 | 28.3 | 13.1 | 26.5 | 2.2 | 6.3 |
2018- 2019 | 26.4 | 11.6 | 29.0 | 2.3 | 6.5 |
2019- 2020 | 25.5 | 11.2 | 41.9 | 2.6 | 7.2 |
2020- 2021 | 28.2 | 12.2 | 30.5 | 2.5 | 6.6 |
Evapotranspiration of crops ETc is a significant component that aids in calculating how much water wheat crops require. ETc is computed as
![]()
Kc is the crop coefficient, whereas ETo represents the evapotranspiration.
The process of extracting water from the evaporation and transpiration of well-watered, actively growing, and fully shaded ground is known as evapotranspiration. ETo is computed as
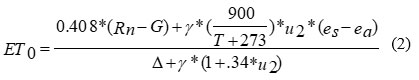
Numerous meteorological factors, including the lowest and highest temperatures, wind speed at 2 meters height, humidity and solar radiations along with geographical data such as elevation, latitudes and longitudes are required to calculate ETo. Summertime values of ETo are found to be high, while wintertime values are found to be low.
Crop coefficient Kc comprises all of a wheat crop's attributes. Depending on the crop's developmental stage, its value changes. The crop height, crop growth duration, and Kc values used in this study are derived from FAOPM56. The local climate can be taken into consideration when adjusting the Kc values. The ETc values used in this study are derived from (1) and are regarded as observed ETc values, or actual values, which are then contrasted with the ETc values predicted by the suggested machine learning-based model.
Correct crop water requirement prediction can be viewed as a nonlinear problem requiring large-scale meteorological data. Therefore, an alternative method of estimating crop water demand could be a machine learning-based model.
Support vector regression
Finding the ideal hyperplane to divide different classes in the feature space is the goal of the supervised machine-learning algorithm known as support vector machine. Regression analysis can be done using the SVM concept. To predict the continuous values, support vector regression is applied. The hyperplane in SVR plays a distinct role as it retains the maximum number of training observations within the tolerance level, or allowable margin of error, denoted by e. The concept of Support vector regression is presented in the Fig 1 The hyperplane line is employed in the SVR to forecast the continuous output. This optimization problem is formulated as

Constrain as
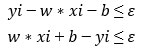
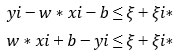
The above optimization problem can be expressed in the following way if certain errors (slack variables) are considered
![]()
Constraints as
Two significant hyper-parameter kernels and the regularization parameter ‘C’ are employed in this work. Grid search is the method used to tune parameter ‘C’ with values {0.1, 1, 10,100}, in order to prevent overfitting. This parameter manages the balance between low training error and low test error. This study finds a hyperplane in higher dimensional space at low computation cost by using the RBF (radial basis function) kernel, which is widely used in SVR.
 | Figure 1: The idea behind support vector regression
|
Model development and performance evaluation
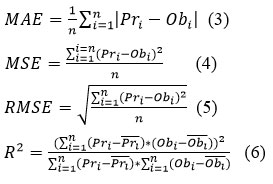
The Fig. 2 illustrates the machine learning-based model that is employed in this investigation. Initially the climatic and geographical data of Barmer Rajasthan is applied to the model. Training and testing are the two disjoint subsets that comprise it. The Grid search-based 5-fold cross-validation approach yields the optimal hyper-parameter. In this work, the regularization parameter ‘C’ of support vector regression is adjusted to produce precise predicted ETc values for wheat crop. The high mean test score among the five-fold iteration is used to determine the superiority of the hyper-parameter. Together with the optimal hyper-parameter value, the entire model is further trained. When the test data set is applied to the trained model, new ETc values for the wheat crop are predicted. The actual values found from (1), on a number of performance evaluation metrics are compared with the predicted values of ETc. To determine the level of expertise of the suggested model, the performance evaluation indicators listed below are employed in this study.
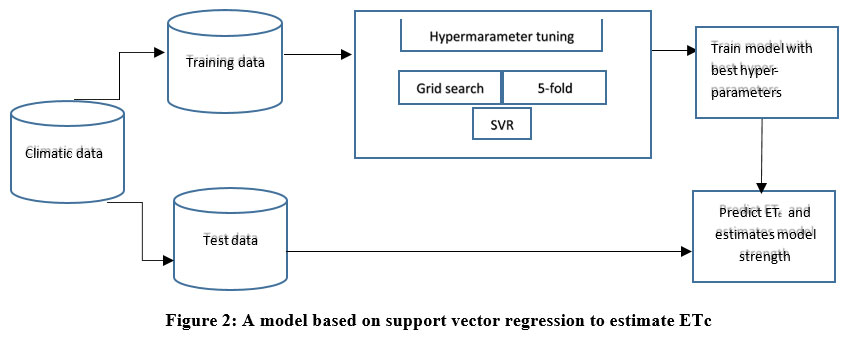 | Figure 2: A model based on support vector regression to estimate ETc
|
Results
Two part of the study's findings are covered in this section. First, the ETc values are derived from the FAOPM56 equation; second, a performance evaluation is conducted for the proposed model.
For the purpose of estimating ETc, both ETo and Kc are crucial. The wheat crop's ETc values for Barmer Rajasthan are estimated in this study. First, using (2), the reference evapotranspiration (ETo) is calculated. Given that the location is in a hot, arid area of the nation, hence summertime values of ETo are found to be high, while wintertime values are found to be low. Considering that, wheat is a rabi crop, it is thought that it will grow for 120 days, from November 15 to March 14. ETo values are computed for the specified time frame and displayed in the Table 2. The ETo value fluctuations for each growth stage from 2000 to 2020 are shown in Fig 3.
Table 2: Mean of ETc and ETo for Wheat crop during winter season (Nov-Mar) at Barmer Rajasthan.
Growing Stage | Initial | Developmental | Mid-season | End-season | Total | |||||
Duration | 20 days (15 Nov to 04 Dec) | 30 days (05 Dec to 03 Jan) | 45 days (04 Jan to 17 Feb) | 25 days (18 Feb to 14 Mar) | 120 days | |||||
Mean ETc /ETo (mm/day) | ||||||||||
Year (15,Nov14, Mar) | ETc | ETo | ETc | ETo | ETc | ETo | ETc | ETo | ETc | ETo |
2000- 2001 | 2.0 | 5.18 | 3.5 | 4.5 | 5.8 | 5.0 | 4.9 | 6.4 | 528.8 | 624.1 |
2001- 2002 | 1.8 | 4.5 | 3.4 | 4.3 | 5.4 | 4.7 | 4.5 | 6.0 | 495.1 | 580.8 |
2002- 2003 | 1.9 | 4.7 | 3.0 | 4.0 | 5.5 | 4.9 | 4.6 | 6.2 | 491.6 | 585.9 |
2003- 2004 | 2.1 | 5.3 | 3.3 | 4.2 | 5.1 | 4.5 | 4.5 | 6.1 | 486.7 | 586.6 |
2004- 2005 | 1.6 | 4.0 | 3.1 | 4.0 | 4.9 | 4.3 | 4.2 | 5.8 | 453.6 | 533.9 |
2005- 2006 | 2.0 | 5.0 | 3.5 | 4.5 | 5.8 | 5.0 | 4.7 | 5.9 | 516.5 | 609.2 |
2006- 2007 | 1.5 | 3.8 | 2.8 | 3.6 | 5.0 | 4.3 | 4.1 | 5.8 | 442.4 | 514.3 |
2007- 2008 | 1.7 | 4.2 | 3.5 | 4.4 | 5.3 | 4.6 | 4.6 | 6.1 | 493.2 | 577.3 |
2008- 2009 | 2.0 | 5.0 | 3.1 | 4.0 | 5.1 | 4.5 | 4.9 | 6.6 | 488.7 | 588.2 |
2009- 2010 | 1.7 | 4.3 | 3.4 | 4.6 | 5.6 | 4.9 | 4.5 | 6.0 | 503.1 | 589.6 |
2010- 2011 | 1.6 | 4.1 | 2.8 | 3.6 | 5.1 | 4.5 | 4.1 | 5.5 | 452.6 | 529.7 |
2011- 2012 | 1.6 | 4.1 | 3.3 | 4.2 | 4.9 | 4.2 | 4.6 | 6.2 | 470.0 | 554.5 |
2012- 2013 | 1.8 | 4.7 | 3.1 | 4.0 | 5.1 | 4.5 | 4.3 | 5.8 | 468.0 | 553.1 |
2013- 2014 | 1.6 | 4.0 | 3.2 | 4.0 | 5.1 | 4.5 | 4.4 | 6.0 | 472.0 | 552.1 |
2014- 2015 | 1.8 | 4.9 | 3.4 | 4.4 | 5.2 | 4.5 | 4.4 | 6.0 | 483.1 | 571.8 |
2015- 2016 | 1.9 | 4.8 | 3.3 | 4.1 | 5.2 | 4.5 | 4.6 | 6.0 | 483.9 | 572.9 |
2016- 2017 | 1.8 | 4.5 | 3.1 | 3.9 | 5.3 | 4.6 | 4.6 | 6.1 | 480.8 | 564.4 |
2017- 2018 | 1.8 | 4.5 | 3.5 | 4.4 | 5.1 | 4.4 | 4.7 | 6.0 | 482.7 | 572.8 |
2018- 2019 | 1.8 | 4.4 | 3.1 | 3.9 | 5.0 | 4.4 | 4.3 | 5.8 | 463.0 | 545.1 |
2019- 2020 | 1.6 | 4.0 | 2.9 | 3.7 | 4.6 | 4.0 | 4.3 | 5.8 | 431.2 | 509.9 |
2020- 2021 | 1.7 | 4.2 | 3.2 | 4.1 | 5.3 | 4.6 | 5.0 | 6.7 | 495.0 | 580.7 |
The four phases of the wheat crop growth stage are the beginning, the developmental, the mid, and the end, or late, stages. Initial stage duration is 20 days, from November 15 to December 4, developmental stage duration is 30 days, from December 5 to January 3, mid-season duration is 45 days, from January 4 to February 17, and late-season duration is 25 days, from February 18 to March 14. The average ETc values derived from (1) for the specified time frame are given in the Table 2.
The Kc values for well-managed and not stressed crops are derived from the FAO-56 for a wheat. The Kc values for the early and mid-seasons are 0.4 and 1.15, respectively, while the following formulas are used to estimate the Kc values for the developmental and late seasons.
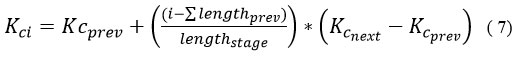
Where Kci is the Kc of ith days under growing stage, Kcprev is the Kc at the end of the previous stage, Kcnext is the Kc at the beginning of the next stage, lengthstage is the length in days of the stage under consideration,Elengthprev is length of all previous stage.
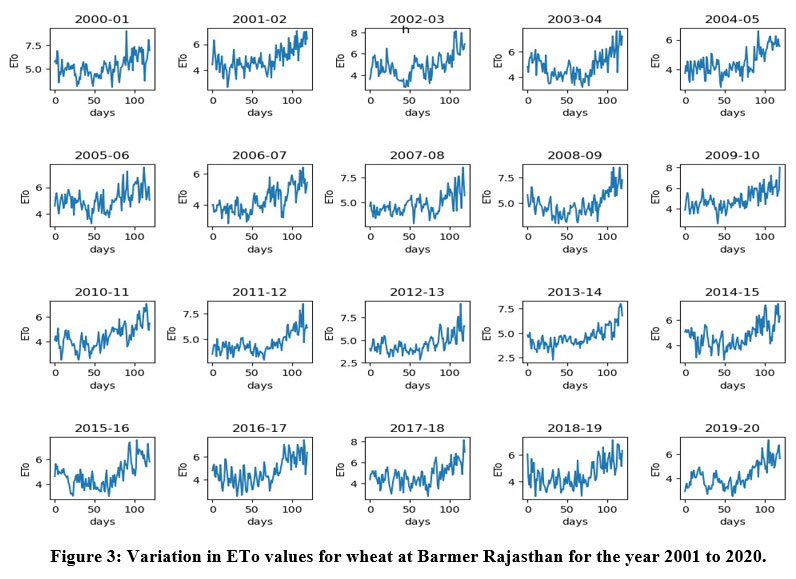 | Figure 3: Variation in ETo values for wheat at Barmer Rajasthan for the year 2001 to 2020.
|
The average estimated Kc values for the wheat crop at various stages from 2000 to 2021 are displayed in the Table 2 and it is evident that the ETc values gradually increase from the beginning to the middle of the season and then decline toward the end of the season, shown in Fig. 4. At the beginning, the ETc values range from 1.5 mm/day to 2.1 mm/day. It fluctuates between 2.8 and 3.5 mm/day during the developmental stage. Peak ETc values are reached in the middle of the season, and they range from 4.6 mm/day to 5.8 mm/day. It slightly decreases in the late season and varies between 4.1 and 5.0 mm/day. The seasonal water requirements for wheat crops from 2001 to 2021 are also shown in the same table and it varies from 431.2 mm to 528.8 mm and presented in the Fig 5. The Fig. 6 shows the daily variation in wheat crop ETc in the specified time frame (15Nov to 14-Mar) for Barmer, Rajasthan, from 2001 to 2020.
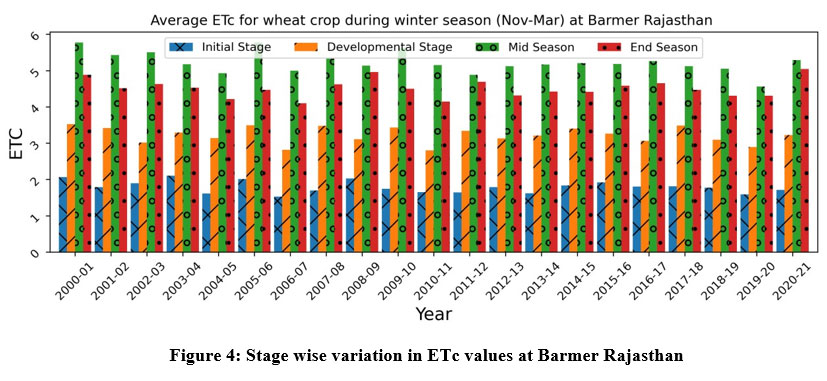 | Figure 4: Stage wise variation in ETc values at Barmer Rajasthan
|
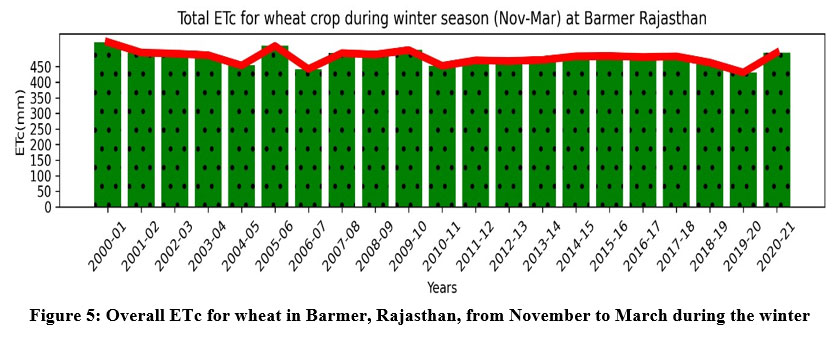 | Figure 5: Overall ETc for wheat in Barmer, Rajasthan, from November to March during the winter
|
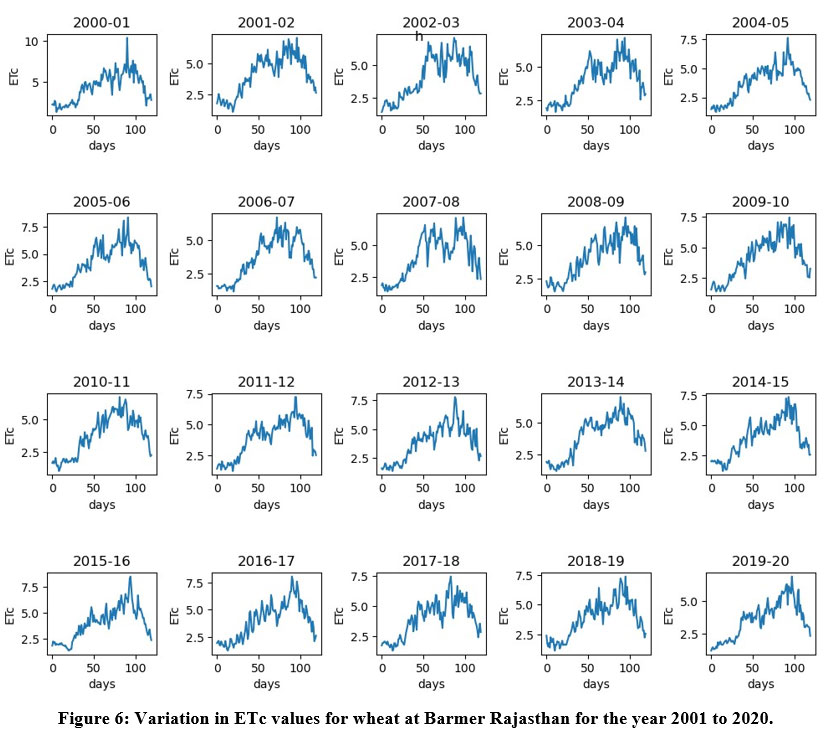 | Figure 6: Variation in ETc values for wheat at Barmer Rajasthan for the year 2001 to 2020.
|
Table 3: Accuracy of Grid search based 5-fold cross validation
Regularisation parameter ‘C’ = {0.1, 1, 10,100} Kernel={‘rbf’} Grid Search based 5-fold cross validation | ||||
Parameters | {'C': 0.1, 'kernel': 'r bf'} | {'C': 1, 'kernel': 'rbf'} | {'C': 10, 'kernel': 'rbf'} | {'C': 100, 'kernel': 'rbf'} |
Accuracy in each Fold | 0.9695 | 0.9924 | 0.9952 | 0.9953 |
Table 4: Accuracy of support vector regression model for test dataset
Model | R-Squared value | Root mean squared error | Mean squared error | Mean absolute error |
Support Vector Regression | 0.9921 | 0.1439 | 0.02 | 0.11 |
Discussion
The well-known supervised machine learning algorithm, support vector regression, on the other hand, can be used to estimate ETc values. This study takes two significant hyper-parameters into account: the kernel and the regularization parameter ’C’. To locate the hyperplane in the high-dimensional data, an RBF (radial basis function) kernel is employed. Using a 5-fold cross-validation approach based on grid search, values for parameter 'C' are adjusted. The Table 3 presents the accuracy during the hyper-parameter tuning. The table shows that using the RBF kernel in conjunction with the C value of 100 results in high accuracy (0.9953).
The Table 4 displays model accuracy for test data sets based on a number of performance metrics, including coefficient of determination, mean absolute error, mean squared error, and root mean square error. These metrics show how well the support vector regression is performing: 0.11 mm/day for mean absolute error, 0.02 mm/day for mean squared error, 0.1439 mm/day for root mean square error, and 0.9921 for coefficient of determination. Regression analysis of this model is shown in the Fig 7. The figure illustrates that the values are located in the vicinity of the regression line (y=0.96*x+0.19) and thereby confirming the model's effectiveness. As the residual is dispersed around the residual = 0 line and does not exhibit any curved pattern, the residual plot displayed in the Fig. 8 further supports the suitability of support vector regression to estimate ETc.
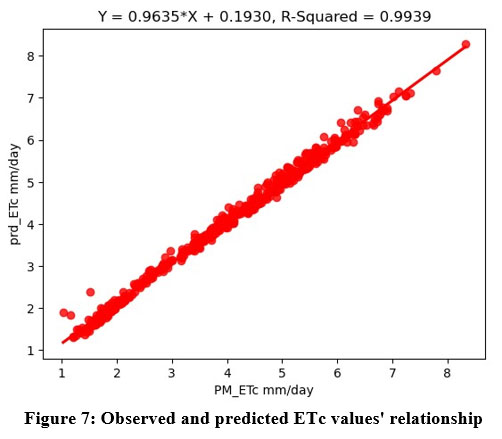 | Figure 7: Observed and predicted ETc values' relationship
|
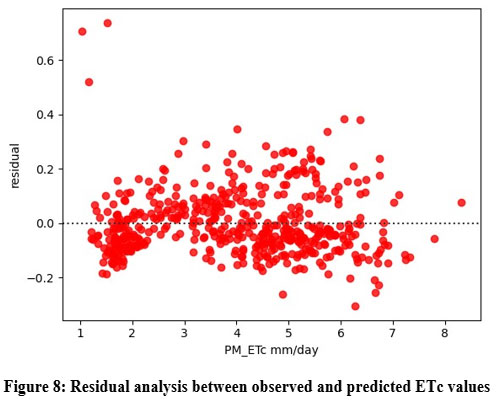 | Figure 8: Residual analysis between observed and predicted ETc values
|
The Central Arid Zone Research Institute in Jodhpur, Rajasthan, published a report titled "Water 2000 AD, the scenario for arid Rajasthan," which contains the results that are used to validate the current findings. A report found that the annual evapotranspiration in Barmer, Rajasthan, is approximately 2376 mm. Similarly, a wheat crop needs about 553 mm of crop water. Global warming affects the evapotranspiration. Evapotranspiration is one of the various climatic parameters that show the consequences of global warming. According to certain research,27 evapotranspiration rises by 17–19% when the temperature rises by up to 4 oC. Similar effects were also observed in this investigation.
Conclusion
Efficient use of water is a major global concern. A large amount of water is needed for agriculture, which is the primary occupation of the western Rajasthan. Finding the most effective irrigation planning and scheduling strategy to prevent water loss is the aim of this study. Given this problem, we proposed a machine learningbased method to calculate the water requirements for wheat crop in Barmer, Rajasthan, at various stages of growth. We observed the ETC value for wheat utilizing FAO-PM56 equation along with its proposed Kc values required at various growth phases. For this purpose, climate statistics from 2000 to 2021 are taken into account. Given that wheat is a rabi crop, harvesting typically takes 120 days from November 15 to March 14. According to our observations, wheat's seasonal crop water requirements range from 431.2 mm to 528.8 mm. Additionally, it is observed that ETc for wheat progressively rises from the early growth stage until the middle of the season before declining in the late season. Apart from it the potential of support vector regression technique with adjusted hyper-parameters to determine crop water requirements is investigated in this work. The performance matrices with values: the mean absolute error is 0.11 mm/day, the mean squared error is 0.02 mm/day, the root mean square error is 0.1439 mm/day, and the coefficient of determination is 0.9921 demonstrates the applicability of the suggested model. The information produced in this study may be helpful for best practices in agriculture. The same model would be used for additional research on diverse crops in different climate zones.
Acknowledgement
The department of computer science and applications at Barkatullah University Bhopal is acknowledged by the authors for helping during their Ph.D. research.x`
Funding Sources
The author(s) received no financial support for the research, authorship, and/or publication of this article.
Conflict of Interest
The author(s) do not have any conflict of interest.
Data Availability Statement
For this study, data was obtained from IMD, Pune.
Ethics Statement
This research did not involve human participants, animal subjects, or any material that requires ethical approval.
Informed Consent Statement
This study did not involve human participants, and therefore, informed consent was not required.
Author Contributions
The research and manuscript writing were equally contributed to by both authors.
References
- Allen RG, Pereira LS, Raes D. Crop Evapotranspiration Guidelines for Computing Crop Water Requirements.Irrigation and drainage paper 56. Food and Agriculture Organization of the Unitide Nations. 1998.
CrossRef - Mehta R, Pandey V. Reference Evapotranspiration (ETo) and Crop Water Requirement (ETc) of Wheat and Maize in Gujarat Geographically Gujarat State. Journal of Agrometeorology 2015;17(1):107-113.
CrossRef - Hargreaves GH, Samani ZA, Abstract A. Reference Crop Evapotranspiration from Temperature. Applied Engineering in Agriculture.1985;1(2):96-99.
CrossRef - Raziei T, Pereira LS. Estimation of ETo with Hargreaves-Samani and FAO-PM temperature methods for a wide range of climates in Iran. Agric Water Manag. 2013;121:1-18. doi:10.1016/j.agwat.2012.12.019
CrossRef - Pagano A, Amato F, Ippolito M, et al. Machine learning models to predict daily actual evapotranspiration of citrus orchards under regulated deficit irrigation. Ecol Inform. 2023;76:102133. doi:10.1016/j.ecoinf.2023.102133
CrossRef - Pino-Vargas E, Taya-Acosta E, Ingol-Blanco E, Torres-Rúa A. Deep Machine Learning for Forecasting Daily Potential Evapotranspiration in Arid Regions, Case: Atacama Desert Header. Agric. 2022;12(12):1971. doi:10.3390/agriculture12121971
CrossRef - Saggi MK, Jain S. Reference evapotranspiration estimation and modeling of the Punjab Northern India using deep learning. Comput Electron Agric. 2019;156:387-398. doi:10.1016/j.compag.2018.11.031
CrossRef - Wang T, Wang X, Jiang Y, et al. Hybrid Machine Learning Approach for Evapotranspiration Estimation of Fruit Tree in Agricultural Cyber-Physical Systems. IEEE Trans Cybern. 2023;53(9):5677-5691. doi:10.1109/TCYB.2022.3164542
CrossRef - Feng K, Tian J. Forecasting reference evapotranspiration using data mining and limited climatic data. Eur J Remote Sens. 2021;54(sup2):363-371. doi:10.1080/22797254.2020.1801355
CrossRef - Hameed MM, Alomar MK, Mohd Razali SF, et al. Application of Artificial Intelligence Models for Evapotranspiration Prediction along the Southern Coast of Turkey. Complexity. 2021;2021:8850243. doi:10.1155/2021/8850243
CrossRef - Singh SK, Lal C, Sharma DK, et al. Comparison of measured and predicted Evapotranspiration using Artificial Neural Network model. J Acad Indus Res. 2013;1(12):816-819.
- Kumar N, Maharshi S, Poddar A, Shankar V. Application of Artificial Neural Networks for Estimating Reference Evapotranspiration in Western Himalayan Region.Roorkee Water Conclave2020;Feb 26-28, 2020;IIT Roorkee; https://www.iitr.ac.in/rwc2020/download.html.Accessed July 01, 2024.
- Nema MK, Khare D, Chandniha SK. Application of artificial intelligence to estimate the reference evapotranspiration in sub-humid Doon valley. Appl Water Sci. 2017;7(7):3903-3910. doi:10.1007/s13201-017-0543-3
CrossRef - Kisi O. Evapotranspiration modelling from climatic data using a neural computing technique. Hydrol Process. 2007;21(14):1925-1934. doi:10.1002/hyp.6403
CrossRef - Hu Z, Bashir RN, Rehman AU, Iqbal SI, Shahid MMA, Xu T. Machine Learning Based Prediction of Reference Evapotranspiration (ET0) Using IoT. IEEE Access. 2022;10:70526-70540. doi:10.1109/ACCESS.2022.3187528
CrossRef - Aghajanloo MB, Sabziparvar AA, Hosseinzadeh Talaee P. Artificial neural network-genetic algorithm for estimation of crop evapotranspiration in a semi-arid region of Iran. Neural Comput Appl. 2013;23(5):1387-1393. doi:10.1007/s00521-012-1087-y
CrossRef - Sayyahi F, Farzin S, Karami H. Forecasting Daily and Monthly Reference Evapotranspiration in the Aidoghmoush Basin Using Multilayer Perceptron Coupled with Water Wave Optimization. Complexity. 2021;2021(1):1-12. doi:10.1155/2021/6683759
CrossRef - Valipour M, Sefidkouhi MAG, Raeini-Sarjaz M, Guzman SM. A hybrid data-driven machine learning technique for evapotranspiration modeling in various climates. Atmosphere (Basel). 2019;10(6):311. doi:10.3390/atmos10060311
CrossRef - Mattar MA. Using gene expression programming in monthly reference evapotranspiration modeling: A case study in Egypt. Agric Water Manag. 2018;198:28-38. doi:10.1016/j.agwat.2017.12.017
CrossRef - Fan J, Yue W, Wu L, et al. Evaluation of SVM, ELM and four tree-based ensemble models for predicting daily reference evapotranspiration using limited meteorological data in different climates of China. Agric For Meteorol. 2018;263:225-241. doi:10.1016/j.agrformet.2018.08.019
CrossRef - Granata F. Evapotranspiration evaluation models based on machine learning algorithms—A comparative study. Agric Water Manag. 2019;217:303-315. doi:10.1016/j.agwat.2019.03.015
CrossRef - Dou X, Yang Y. Evapotranspiration estimation using four different machine learning approaches in different terrestrial ecosystems. Comput Electron Agric. 2018;148:95-106. doi:10.1016/j.compag.2018.03.010
CrossRef - Feng Y, Cui N, Gong D, Zhang Q, Zhao L. Evaluation of random forests and generalized regression neural networks for daily reference evapotranspiration modelling. Agric Water Manag. 2017;193:163-173. doi:10.1016/j.agwat.2017.08.003
CrossRef - Yamaç SS, Todorovic M. Estimation of daily potato crop evapotranspiration using three different machine learning algorithms and four scenarios of available meteorological data. Agric Water Manag. 2020;228:105875. doi:10.1016/j.agwat.2019.105875
CrossRef - Gocie M, Motamedi S, Shamshirband S, et al. Soft computing approaches for forecasting reference evapotranspiration. Comput Electron Agric. 2015;113:164-173. doi:10.1016/j.compag.2015.02.010
CrossRef - Tabari H, Martinez C, Ezani A, Hosseinzadeh Talaee P. Applicability of support vector machines and adaptive neurofuzzy inference system for modeling potato crop evapotranspiration. Irrig Sci. 2013;31(4):575-588. doi:10.1007/s00271-012-0332-6
CrossRef - Rao AS, Poonia S. Sensitivity of Crop Water Requirements to Elevated Temperatures in Arid Rajasthan. Annals of Arid Zone. 2011;50(2):131-138
CrossRef


