The Plight of Wetlands in India: A case study of Ansupa Lake in Cuttack, Orissa.
Suranjana Banerji1
*
 and Deblina Mitra2
1
Department of Geography,
Presidency University,
Kolkata,
India
2
Department of Geography,
Vidyasagar College,
Kolkata,
India
http://dx.doi.org/10.12944/CWE.20.1.33
Copy the following to cite this article:
Banerji S, Mitra D. The Plight of Wetlands in India: A case study of Ansupa Lake in Cuttack, Orissa. Curr World Environ 2025;20(1). DOI:http://dx.doi.org/10.12944/CWE.20.1.33
Copy the following to cite this URL:
Banerji S, Mitra D. The Plight of Wetlands in India: A case study of Ansupa Lake in Cuttack, Orissa. Curr World Environ 2025;20(1).
Download article (pdf)
Citation Manager
Publish History

Introduction
Wetlands harbour some of the most biodiversity rich ecosystems within the world, providing a myriad of socio-economical and ecological services to human beings.1,2 Ironically, these unique combinations of aquatic and terrestrial conditions are greatly disregarded- often pushed to the point of coercion to degrade, paving the path for reclamation and land conversion. Ramsar Convention has defined wetlands as those temporary or permanent expanses of water, marshes, peats, bogs existing naturally or otherwise, which can have fresh/brackish water that is stagnant or flowing; even in marine water regions where its depth at low tide is less than or equal to 6 metres.3 Often called ecotones, these wetlands may exist as natural or artificial lakes, marshes or ponds4 functioning like the ‘kidneys of the earth’. Occupying a total global area of more than 12.8 million km2,5 they harbour a rich diversity of biotic species while also being available as water storage units, groundwater recharge reservoirs, havens for wildlife habitat, zones for nutrient retention and pollution prevention; which simultaneously provide food and natural products for human use.6,7 But these wetlands are under stress globally. Across the world, maximum losses of wetlands have happened in places like Asia, followed by Europe, United States, China and Australia, while degradation of the same continues till date due to various anthropogenic activities of different intensities.8-11. In India, rampant wetland loss is observed as a result of agriculture and land conversion.12 Harike wetland in Punjab13 as well as Chatra wetland in Eastern India14 are the foremost examples of adverse effects of land conversion on wetlands. Similar wetland decline examples are seen in Birbhum district of West Bengal,15 Merbil wetland in the Brahmaputra valley16 as well as in Mount Abu, Rajasthan, India17 where land conversion pressures have affected the water body dynamics. Anthropogenic activities have a significant impact on lake ecosystems as populations rise and industries and agriculture flourish.18 The aforementioned man-made activities include excessive use of fisheries, use for leisure trips, redevelopment of previously present marshes or lakes, wastewater or sewage discharge pools or building of water conservancies.18 One such lake facing diverse problems due to anthropogenic activities is Ansupa Lake of Odisha (Orissa).
Odisha is home to 3 large lakes namely Chilika, Ansupa and Sara. The Chilika Lake exists as a lagoon whereas the two inland freshwater lakes primarily, are Ansupa and Sara. In literature, Ansupa, stated as a lake, is one of Odisha’s (Orissa) largest freshwater reserves and is thus termed, since it is by definition a large body of water which is stagnant or slowly moving, localised in a basin of significant size.19 The Ansupa Lake has drawn the attention of visitors and tourists of different corners of the world owing to rich floral diversity and some resident and migratory bird species.20 A rich diversity of insects such as honey bees, butterflies, damselflies and more are also seen here.20 But in recent times Ansupa's freshwater habitat is one of the most threatened in spite of harbouring a valuable ecosystem.21 Kabula Nallah connects the lake to the river Mahanadi, serving simultaneously inward and outward flow, allowing water from floods to enter the lake's waters and subsequently aiding the exit of the surplus water after the flood. Presently, the water coverage of the lake has reduced from 3.17sq. km in 1973 to 1.76 sq.km in 2004, while the depth has reduced to almost half by 2008, owing to siltation, encroachment by weeds and reclamation of wetlands into new agricultural fields. The Ansupa lake has received a large quantity of clay and silts via runoff or floods, carrying debris from the hills during monsoon period over the years. After the construction of embankments in Mahanadi for the control of flood, the inflow and outflow system of the lake were interrupted and the flow circulation had been stopped. The lake is degrading gradually on account of siltation, weed infestation, eutrophication, water quality deterioration, decrease in fisheries resources, decrease in avi-fauna and decrease in socio-economic status of the villagers of the fringes.22 Due to its highly eutrophic condition and weed infestation, the lake’s quality is degrading very fast which is threatening the intricate fabric of life within and around the waterbody. Presently, the fish quantity has greatly reduced which is a massive blow not only to the economy of fishermen, but also the migratory birds, who are being forced to move away due to inhabitable conditions. Moreover, rampant pollution and intense land use change has robbed the lake of its tourist attraction potential. Freshwater weeds proliferate rapidly in the lake as a result of substantial nutrient loading from surrounding rice fields and the over utilisation of detergents by the resident population, leading to high eutrophication of the lake's waters. There is an immediate need to take significant conservation measures and long term monitoring of the lake to conserve the glorified diversity of the Ansupa Lake. Till date, wetland degradation and decline has been analysed over time to find out the trend of change using land use and land cover(LULC) classifications from satellite imageries, which has been utilised to study wetlands of Kashmir,23 Birbhum in West Bengal,15 Sultanpur wetland24 of Haryana, as well as Harike wetland of Punjab.13 In the case of Ansupa, although the change in weed free water coverage has been studied by researchers, it does not trace the change over a long span of time. Very few studies, in the context of Ansupa and similar wetlands, have depicted wetland change to be a product of LULC conversion. Additionally, growth of aquatic weeds have led to a decline in water quality which reduces fish catch.25 This has been true in the case of the Harike wetland,13 wetlands of the lower Ganges floodplain26 and Srinagar city,27 although the same has not been adequately analysed for Ansupa Lake. Depression wetlands have the capacity to recharge groundwater as has been seen in the case of Sukhna Lake in North-West India.28 Decline or deterioration of these wetlands would reduce the recharge of groundwater but this fact has not been analysed for Ansupa Lake in previous literature, in spite of it having similarities with depression wetlands. While such varied parameters are adversely affecting the proficiency of Ansupa, its deterioration is subsequently reducing groundwater recharge as well as fish stock, creating distressed socio-economic conditions. Therefore, an attempt has been made here to analyse these various threats by considering goals such as:
To evaluate the impact of change in surrounding land use and land cover on the Ansupa Lake.
To assess the growth of weeds in the Ansupa Lake and its consequent effect on water quality and fish production.
To determine the significance of Ansupa Lake in recharging the surrounding groundwater level.
To suggest sustainable measures for better management of this freshwater lake of Orissa/Odisha
Study Area
Ansupa Lake is located in the Banki Subdivision of Cuttack district, Orissa, under the Athagarh Forest Division - between 85° 34? 52.697? E to 85° 37’ 19.271? E latitude and 20° 26? 37.864? N to 20° 29? 59.228? N longitude.29 It evolved originally as an oxbow lake of the Mahanadi River and exists today as one of the two freshwater lakes found in Orissa, marked as a ‘Wetland of National Importance’.30,31 Lying in the lap of Saranda and Bishnupur hills to its western and north-eastern side, and fringed by mango orchards in Cuttack district, this pictorial lake, once known as the sister of the famous Chilika Lake, has become important worldwide, as it is a home to a diverse variety of macrophytes and several migratory as well as domiciled birds.32 The wetland is a biodiversity hotspot of 194 birds, 61 aquatic species, multitude of macrophytes, insects and acts as a secure habitat for other threatened terrestrial animals.33 It has a length of around 3.4km in the north-south direction with a maximum width of less than 1km and covers an area of about 317 ha. It is surrounded by Malabiharipur, Ostia, Subarnapur and Anandpur villages, sustaining the water requirements of the neighbouring areas while also supporting the occupations of the residents which include fishing and farming nearby. There is one sluice gate, which regulates the flow of water. Although it is connected with Mahanadi River on the southern part - filling it by flood waters via the Kabula Nala, and by a small channel called the Haluhala Nala to the south-west, the latter is currently dysfunctional, inducing drying of the water reserve during drought times. In recent years, anthropogenic pressures have created an ecological imbalance to a great extent. Heavy exploitation of vegetation around Ansupa accompanied by soil erosion, siltation, creation of embankments, unscientific fisheries, invasion of water hyacinth (Pontederia crassipes), weedy vegetation (Ipomoea carnea, Hydrilla verticillata, Typha angustata, Pistia stratiotes etc.) and algae is converting the water reserve into a swamp.30, 31,34
Therefore, it is necessary to reclaim and develop this wetland ecosystem for its optimum potential use. In the present study, an attempt has been made to know how the changes in the surrounding landscape has affected the lake area over the period of 1998-2020. Further an assessment of whether fish production has been adversely affected by the invasion of weeds and deterioration of water quality has been conducted. Lakes like Ansupa have the capacity to recharge the groundwater level, so unless sustainable conservation measures are undertaken the health of the ecosystem will be greatly hampered.
Materials and Methods
The present research methodology of this study was done by using secondary data such as the cloud free Landsat 5 and 8 (TM,OLI/TIRS) imageries, which have been retrieved for the month of May for all the selected years as well as official water quality and fish production reports have been retrieved from the Annual Report of State Pollution Control Board of Odisha and National Water Informatics Centre for the years 2012-13, 2015-16, 2019-20, 2020-21 for four stations such as Bishnupur, Kadalibari, Subarnapur and Sarandagarh in Orissa.
Table 1: Satellite data used for the study of weed infestation as well as land use land cover classification:
Sensor | Acquisition Date | Source | Resolution(m) | Path/Row |
TM | 02-01-1998 | USGS Earth Explorer | 30 | 140/46 |
TM | 16-01-2012 | USGS Earth Explorer | 30 | 140/46 |
OLI/TRS | 04-01-2016 | USGS Earth Explorer | 30 | 140/46 |
OLI/TRS | 12-01-2020 | USGS Earth Explorer | 30 | 140/46 |
Along with this the piezometric level data of the surrounding region has been retrieved from the reports available from the India Water Resources Information System (IWRS) website - so as to evaluate whether the lake’s diminishing water content has an effect on the groundwater table.
Analyse the impact of surrounding land use and land cover (LULC) changes on Ansupa Lake between 1998-2020
Ansupa Lake has been directly affected by surrounding LULC, as literature suggests. This ‘wetland of national importance’, as mentioned before, is a unique hotspot due to its rich biodiversity of flora and fauna, migratory birds and various types of fish. But the quality of Ansupa Lake’s waters has been deteriorating over the last 10 years due to eutrophication from agricultural fields and consequent weed invasion, commercial fishing as well as unsustainable tourism as a source of income. Presently the algae and weed coverage has limited the photic depth and also reduced the dissolved oxygen content, while turbidity has increased due to changing anthropogenic activity in the surrounding region. So, to assess the LULC changes around the lake - a supervised classification of the study area has been conducted using the cloud free, pre-processed Landsat 5 and 8 (TM,OLI/TIRS) imageries of 1998, 2016 and 2020 has been accessed and processed using the Google Earth Engine platform. Identification of 7 classes vis-a-vis waterbody, sand bar, vegetation, agriculture, settlement, weeds and fallow land, has been developed using the supervised classification algorithm and the maximum likelihood technique in Google Earth Engine, wherein 40 training samples have been chosen for each category. Following this, the producer, consumer, overall and Kappa accuracy assessment was further performed to verify the quality of the obtained results for the classified map.
Following this ARC GIS’ TerrSet Plugin has been used to find out which of the aforementioned categories have transformed into its neighbouring classes over time, which classes have gained or lost surface area and the cubic trend of the pattern of LULC conversion has also been computed and visualised using the Land Change Modeler (LCM) using the Change Analysis and Transition potentials technique.
Evaluation of the weed invasion in Ansupa Lake and its consequent effect on water quality and fish production
Maintaining the water quality of the Ansupa Lake is essential for sustaining the health of the freshwater ecosystem existing in and around the lake. Weeds and algae as mentioned previously have greatly affected the water quality. So two band ratios have been used on the retrieved landsat images such as the Normalised Difference Turbidity Index(NDTI)35 and the Adjusted Floating Algae Index (AFAI)36 (Fang et al.) which are given as:
NDTI = RED-GREEN/RED+GREEN
AFAI= NIR- RED +(SWIR-RED)*0.5
The Normalised Difference Turbidity Index (NDTI) depicts whether the waters are clear or not, indirectly explaining the photic depth, as clearer the water, more would be the light penetration level at greater depths while turbid waters would have lower photic depths. This ratio has a scale of -1 to +1, where the former shows clear and the latter shows turbid waters. This has been shown using red, orange, yellow green and navy blue shades - where red represents highest turbidity and navy blue represents clear water. On the other hand, the Adjusted Floating Algae Index (AFAI) band ratio helps to extract the algae free and algae replete areas along surface water bodies. Higher the values worse is the algal content and vice-versa. Here the shades of red to blue depict the highest to lowest algal coverage, respectively.
Other than these, several physico-chemical parameters such as pH, TDS (total dissolved solids), BOD, DO, EC, TH, Iron, Nitrate, Fluoride and Total Coliform have been considered to evaluate the degree of water contamination. These values were then subjected to Horton’s Water Quality Index . Water Quality Index (WQI) is the computed aggregate value which helps to describe the overall water quality of collected water samples.37 The formula for WQI is:
![]()
in which, qtn = is the rating of quality assigned to the nth water quality parameter, Wn = Unit weight of the nth water quality parameter37.
Quality Rating (qtn)
For calculating the qtn or the quality rating, the equation implemented is:
![]()
where, Van = Estimated value of net water quality parameter of a given sample location; Vaid = Ideal value for nth parameter in pure water (Vaid for pH = 7, and 0 for all other parameters); Stn = established Standard permissible value of nth water quality parameter.37
Unit Weight (Wn)
For assessing the Unit Weight (Wn) the utilised formula is37:
![]()
where, Stn is the same value used above while k = constant of proportionality, which has been equated using the formula37:
![]()
The WQI values in the study area of four stations (Bishnupur, Kadalibari, Subarnapur and Sarandagarh) for four different years (2012-13,2015-16,2019-20 and 2020-21) were then compared with an established categorisation of WQI. The first category considers water samples within 10 to 25 WQI values to be of excellent quality, fit to be used for drinking, watering crops as well as Industrial purposes.37 Secondly, if the WQI values range from 26 to 50, it is regarded as Good - usable to meet domestic, agricultural and industrial requirements37. Thirdly, when the WQI values range from 51 to 75, it is considered to be of Fair quality - only usable for irrigating crop fields and fulfilling requirements of industries. If the WQI values exist between 76 to 100, water samples are marked poor, something which can only be used for watering crops. For WQI values between 101 and 150, the samples are regarded as Very Poor, which cannot be safely used for irrigation. Values above 150 are completely unfit for drinking and cannot be used without treatment.37 Using the agglomerated WQI values a map has been created using ArcGIS 10.5. platform.
Determination of the role of Ansupa Lake in recharging the groundwater level
Piezometric level data has been collected here to assess the level of groundwater within the confined aquifer. Often surface water bodies tend to recharge the groundwater table. Here this data has been used to find out whether Ansupa lake and its decrease in water content is affecting the water table or not. Piezometric level data of the study area as well as the rainfall data has been collected from India Water Resources Information system(IWRS) following which the future trend of change has been developed using the SPSS software.
Results and Discussion
Assessment of the effect of surrounding land use and land cover (LULC) changes on Ansupa Lake between 1998-2020
Land cover and land use studies help to evaluate both the distribution of physical characteristics on the Earth’s surface, as well as their dynamicity due to human-environment interaction as a result of human-use via agriculture, settlements, industry etc. This makes the study of these spatio-temporal changes essential. In the context of Ansupa Lake, 3 images for the years 1998, 2016 and 2020 have been taken where the greatest changes to the lake and its surroundings have taken place (Figure 1 below).
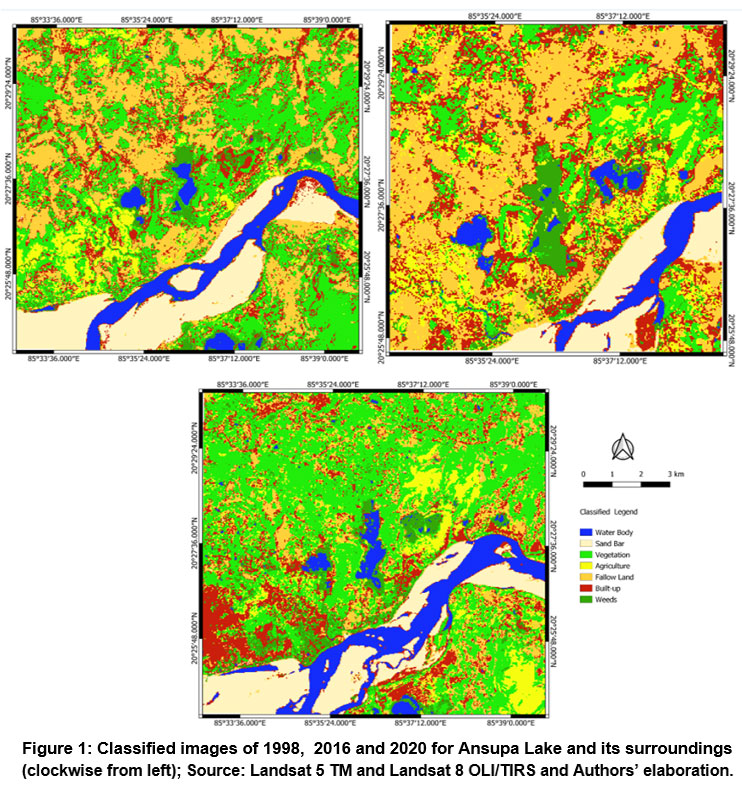 | Figure 1: Classified images of 1998, 2016 and 2020 for Ansupa Lake and its surroundings (clockwise from left); Source: Landsat 5 TM and Landsat 8 OLI/TIRS and Authors’ elaboration.
|
According to the classified image of 1998, the category of water bodies is made up of Ansupa Lake and its associated surface water bodies such as the Mahanadi River, which is found to the south east corner of the map. These are denoted in blue colour. It is evident from the image that the river here is very sluggish in nature as a result of which a large area is occupied by sand bars, which is denoted by a light beige colour. Following the route of the river there are some settlements marked in red where the people have repurposed the original river course for creating residences so that closest access to water is possible. Some of the ruralites here are agriculturists and live in and around their cultivational areas which are marked in yellow. There exists fallow lands too, as can be seen in the ochre colour, where the ground has recently been readied for agricultural purposes. Vegetation is present all around the region as can be seen via the green colour, some of which exists along the rugged terrain along the hillsides. Another important part of the study area are the weeds which can be seen not only in the Ansupa Lake but also in the neighbouring water bodies, suggesting the fact that weed infestation is a largely spreading problem. In 1998 itself a major part of Ansupa was covered by rapidly growing weeds like water hyacinths, which is highly detrimental for the sustainability of the lake ecosystem. By 2016 this scenario undergoes a complete change, wherein most of the area is dominated by fallow lands. Water bodies like the Mahanadi River have faced a reduction in the volume of water flowing through it, primarily due to the siltation problem. Additionally, its course also changed, becoming less winding within the region while shifting away from it. Weed activity indeed progressed during this year in the Ansupa Lake and it has been completely covered by weeds except for a few patches of water area. Agriculture has continued along the banks of the river and intensified in some cases, mainly to the middle and lower reaches of the river, i.e., towards the south-west and north-eastern part of the map. These agricultural activities have significantly deteriorated the health of the river as well as those of the enclosed water bodies like Ansupa and its neighbours. Vegetal cover has reduced a lot mostly due to clearing of land for residences and agricultural purposes, while the number of settlements have increased slightly due to better agricultural opportunities. Sand bars have mostly been reclaimed by this time for creating space for more residential, agricultural or soon-to-be agricultural areas. Again in 2020, a complete upheaval is seen in all the LULC categories. With increase in the rainfall amounts, better desiltation activities taken up by the government and the local people, the Mahanadi River regained its original flow in its channel, while substantial clearing of weeds allowed Ansupa Lake to regain its lost water coverage. But this has not been true for its neighbouring lakes where detrimental weed growth and reclamation for anthropogenic purposes still continue. Towards the southern end of the map a new waterbody has begun to develop as an off-shoot of the river, similar to the origin of the Ansupa and its neighbours. Depositional activities of the river, via sand bar increase, seem fairly reduced when compared with 1998, mainly due to the renewed flow and desiltation of the river. Few agricultural regions and major fallow land have been lost as people have changed occupations, while simultaneously migrating to other districts or states for work. This migration has become a trend recently in some of the villages located in and around the Ansupa Lake. As a result, some of the previously unused fallow lands have become occupied by original vegetation around the lake areas. With better access to water bodies in lakes and rivers fishing settlements have clustered around these regions as can be seen along the river stretch both on the northern and southern sides when compared with the 1998 characteristics. To better explain these changes, gains, persistence and losses for the aforementioned categories have been devised in the figure below (Figure 2).
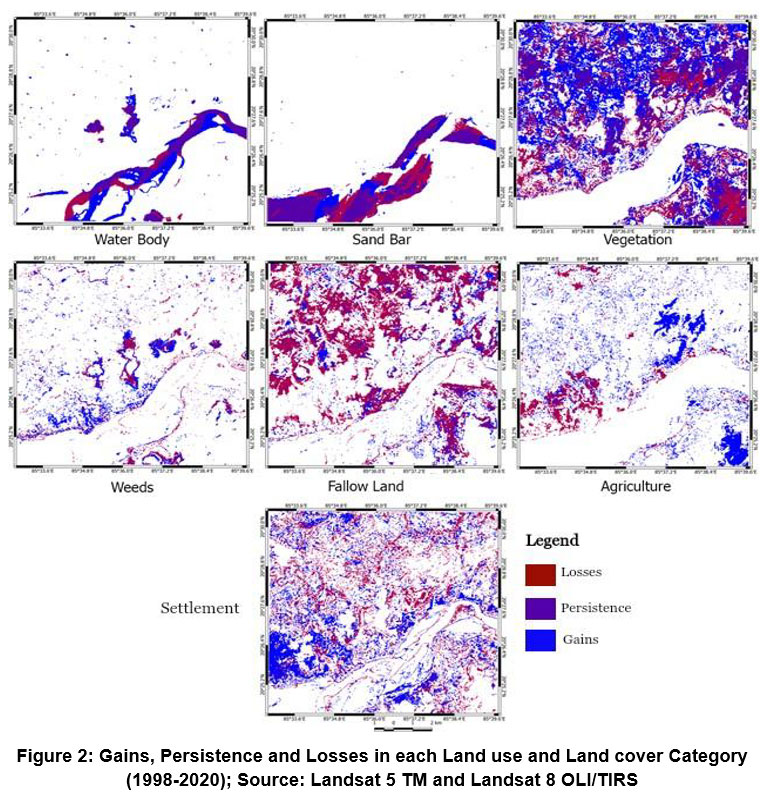 | Figure 2 : Gains, Persistence and Losses in each Land use and Land cover Category (1998-2020); Source: Landsat 5 TM and Landsat 8 OLI/TIRS
|
According to figure 2, the shades of red, purple and blue have been used to depict losses, persistence and gains in areas, respectively, within the LULC categories from 1998 to 2020. Considering the water bodies, it is evident that the Mahanadi River has shifted from its original course and lost a few stretches. Persistence of the main river course still dominates while a few new stretches have been gained as a result of government initiatives. The same activities have allowed Ansupa Lake to witness persistence of its waterspace which existed during 1998, while gains have happened in its northern and southern sections, although a few losses are seen towards its western side. Sand bars have suffered a loss since its 1998 levels due to the changes in the river course. Some sand bar portions still persist whereas negligible gains have happened here. Vegetation on the other hand, has seen major gains while some vegetal spaces still persist towards the eastern, extreme west and southern sides. Losses in this category are seen scattered around the region mainly due to clearance of land for settlement or agriculture. In the context of weeds, it is evident that the source is the Mahanadi River and its off-shoots, from where the weeds stagnated within the lakes. Weeds along the river’s southern banks have apparently disappeared while along the western off-shoot there has been a gain as it is gradually losing its vitality, owing to river course changes. Ansupa Lake has witnessed loss in weeds in the northern and southern sections while gains and persistence still do exist for its neighbouring lakes. Fallow lands have lost more areas than it has gained, within the given time period. Minor persistence still exists and is scattered in the western and southern parts of the region. In the context of the agricultural regions, gains apparently dominate the region. There has been both a loss and a minor persistence in this category, as is evident towards the west; which is explained by the gains in the settlements which have mostly replaced the agricultural fields there. Gains in the rural residences are seen in compact forms, mainly along the river and the North western part of the region. Settlement areas have seen a trend of gain in areas towards the west than the eastern halves. Persisting settlements exist in the extreme northern and south-eastern side, while losses are seen in the central North and eastern sides. Such diverse changes around the Ansupa Lake, ranging from losses to gains have greatly impacted it. Even the river course has also had a significant impact on the lake. Sometimes the lake areas have been occupied by weeds, sometimes by agriculture or even by the local vegetation. So to find out the type of transition the lake areas have undergone since 1998-2020, a transition map of waterbodies to all other categories has been conducted as can be seen in the following figure (Figure 3 below).
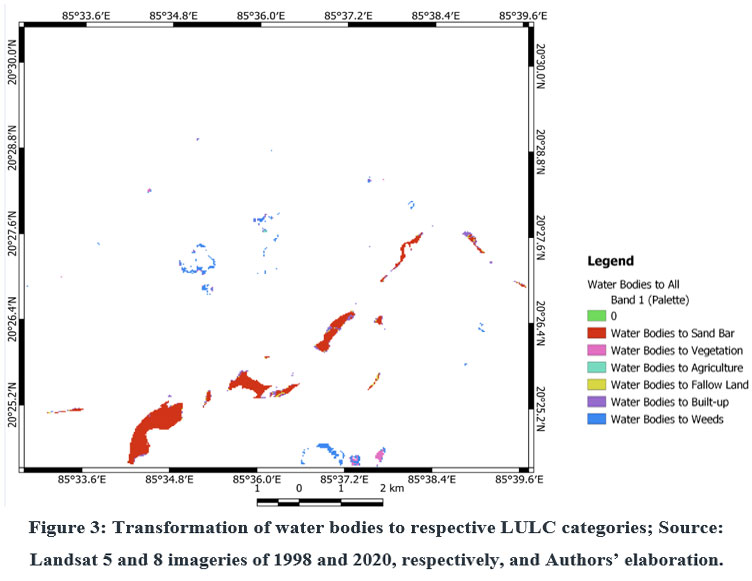 | Figure 3 : Transformation of water bodies to respective LULC categories; Source: Landsat 5 and 8 imageries of 1998 and 2020, respectively, and Authors’ elaboration.
|
From the given transitional patterns, it is evident that portions of the river have changed into sand bars primarily, followed by some regions morphing into weed occupied regions, vegetal space and minorly into settlements or fallow lands. On the other hand, in case of the enclosed water bodies, the Ansupa Lake has seen a major conversion to weed areas, native vegetal areas, settlement spaces and agricultural regions mainly. Some of its neighbours have also experienced a similar pattern of change from waterspace to weeds, settlements and agriculture. As a result of such transitions, Ansupa is always vulnerable to a decline in water quality and quantity like its neighbours, which in turn affect not only the vitality of the fishes but also the avian migratory species who depend on them for food. Moreover, this lake is used for commercial fishing as well as recreational activities like boating. This not only affects the lake's physico-chemical properties but also allows more reclamation of the surroundings of the water bodies to fulfil human needs. Thus, there exists a need to assess the trend of transformations potentials of water bodies to other LULC categories, which has been conducted using the cubic trend analysis and has been shown in the following figure (Figure 4).
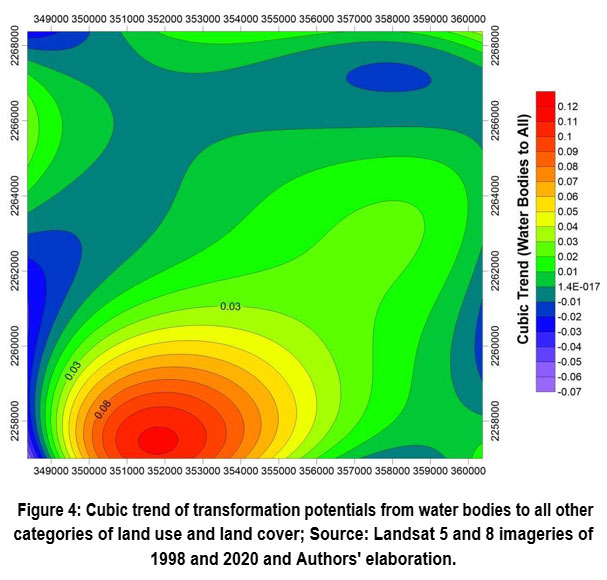 | Figure 4: Cubic trend of transformation potentials from water bodies to all other categories of land use and land cover; Source: Landsat 5 and 8 imageries of 1998 and 2020 and Authors' elaboration.
|
Figure 4, (above) depicts that the south-west section has the potential for highest positive transformation to every other category. This trend reduces towards the west, the north and the north-eastern sections where transformation of the water bodies can happen into 2 or 3 categories at large. That is why Ansupa, located in the centre of the study area, has the potential to be greatly affected by too many LULC transformations in its surroundings, making it extremely dynamic and vulnerable to deterioration in health at the same time.
Analysis of weed invasion in Ansupa Lake and its consequent effect on water quality and fish production
Evidently, since 1998 till 2020 weeds and turbid waters have become a major cause for concern in the Ansupa Lake. Therefore to assess the changes the AFAI and NDTI band ratios have been used, as mentioned before and the following figures have been created (Figures 5 and 6):
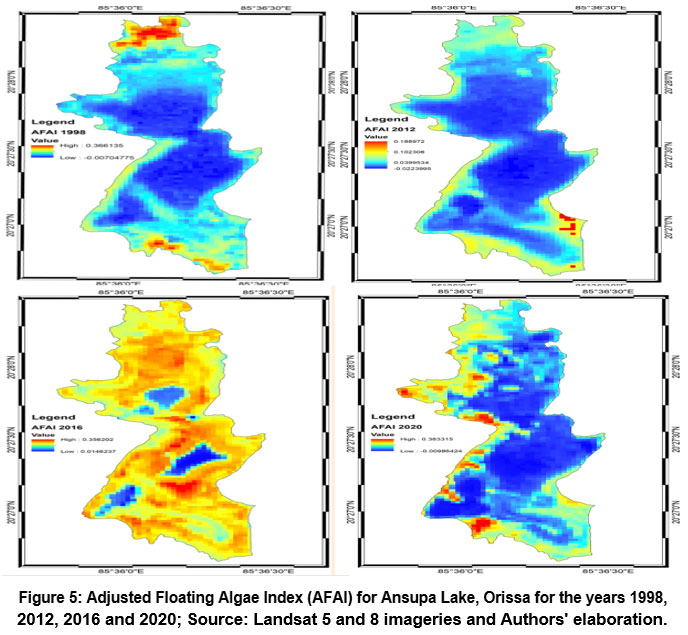 | Figure 5: Adjusted Floating Algae Index (AFAI) for Ansupa Lake, Orissa for the years 1998, 2012, 2016 and 2020; Source: Landsat 5 and 8 imageries and Authors' elaboration.
|
The Adjusted Floating Algae Index (AFAI) in figure 6 explains that in 1998, the floating algal and weed content was much higher in the extreme northern and southern part of the lake. This gradually reduced towards the centre where clear water expanse is noticed, marked in blue. This algae/weed borders the lake even on the left and right sides thereby reducing clear water extents. This changes in 2012 where high density of weed-algal cover is less intensely found than the previous image. Water areas have increased suggesting partial cleaning activities towards the southern sides mainly. Here greater weed-algal density is found towards the south-eastern corner (on the lower right) suggesting piling of vegetal mass along the banks of the lake. In 2016, there was a sudden weed invasion where floating algae and weed cover strangely increased by volumes. As is evident only around 10-15% of the water bodies remained clear while floating masses dominated the rest of the lake. This may be attributed to the increase in agricultural dynamicity of lake's surroundings and eutrophication by agricultural effluents. Following this situation a complete lake clean-up was attempted by the government and the locals so as to rejuvenate the lake, due to which in 2020 water area of the Ansupa Lake has increased manifold. Inspite of this it can be clearly seen that the left banks of Ansupa still has a dense cover of floating algal and weed content, suggesting the fact that a thorough clean-up was not possible considering the rate of proliferation of weeds and algal masses.
In case of the Normalised Difference Turbidity Index (NDTI) which has been shown with the help of Figure 6, the picture turns out to be completely different.
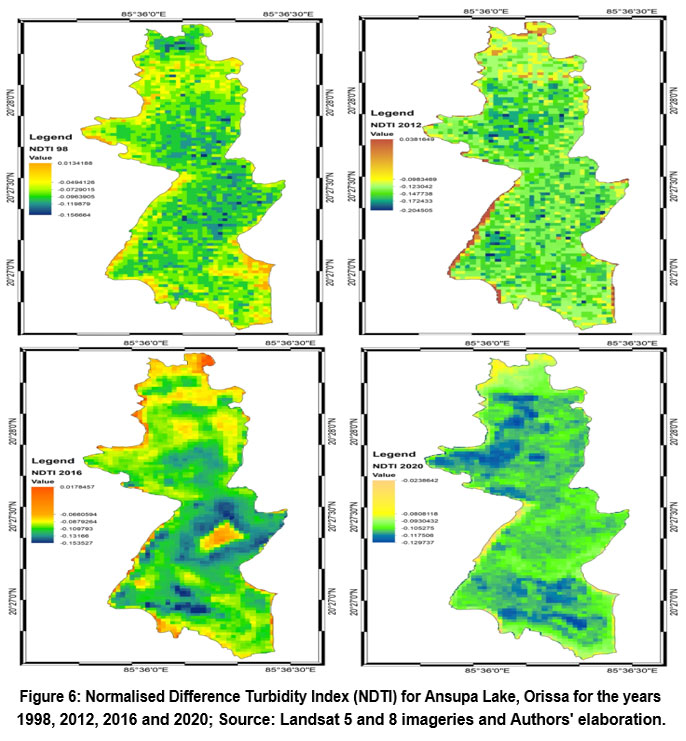 | Figure 6: Normalised Difference Turbidity Index (NDTI) for Ansupa Lake, Orissa for the years 1998, 2012, 2016 and 2020; Source: Landsat 5 and 8 imageries and Authors' elaboration.
|
In 1998, there exists a direct relationship between waters replete in weeds and algae and turbid water regions. Consequently, Ansupa’s northern portions, its left bank and its south-eastern periphery have highly turbid waters. Contrary to this aspect, the central most part of the lake which was free of any floating masses, was comparatively more turbid than expected. This may be due to the effluent and silt being discharged in the lake which even renders unrestricted water areas turbid. Following this in 2012, mixed turbid conditions are noticed although the intensity of turbidity along the banks have increased than before. Very few clear patches of water area interspersed with turbid patches are seen in the central most sections, which are devoid of floating masses, suggesting the existence of dissolved impurities. Then again in 2016, turbidity increases rapidly all over the lake. Surprisingly, the 10-15% of clearest portion of water seen in figure 6 turns out to be a moderate and highly turbid zone along with those regions where floating algal masses were seen. This suggests that in this year the lake suffered from public and authoritarian ignorance as well as negative anthropogenic interfence. The lake's boundaries, its northern and southern sections remain highly turbid as is evident in the colour shades here. In 2020, turbidity is significantly lower than before as the values suggest, and is found almost throughout the major parts of the lake. Except the extreme northern corner and some of the southern lake peripheries, turbidity is considerably low. Even then, it is evident that the left banks have a greater concentration of clear waters as agriculture has significantly reduced there, while it exists largely along the lake's right banks. Further, the images explain the high effectiveness of clearing of waters by the locals and the government which has helped to drastically improve the quality of the lake waters.
Additionally, to understand the percentage of change within the Ansupa Lake was traced for the years 1998, 2012, 2016 and 2020, using the aforementioned Landsat images, so as to classify it into 3 tiers - the weeds, marshes and water body clear of any obstruction. The resultant images, as seen in Figure 8, have depicted that marshes and weeds used to occupy a major part of the lake in the first chosen year (17.35% weeds, 45.30% water and 37.35% by marshes). By 2012, clearance of weeds helped the lake waters to occupy a larger area and provide better ecosystem services to the inhabitants. In this year, 20.63% of area was found to be occupied by weeds, 26.59% by water bodies while 22.19% was occupied by marsh. But sediment addition, algal bloom due to agricultural nutrients, increased wastewater flow and low fresh water supply from the Mahanadi, coupled with people’s neglect led to the ‘almost’ extinction of the wetland by 2016. Here 48.02% of the area was under weeds, 4.51% was water and 47.46% were marshes.
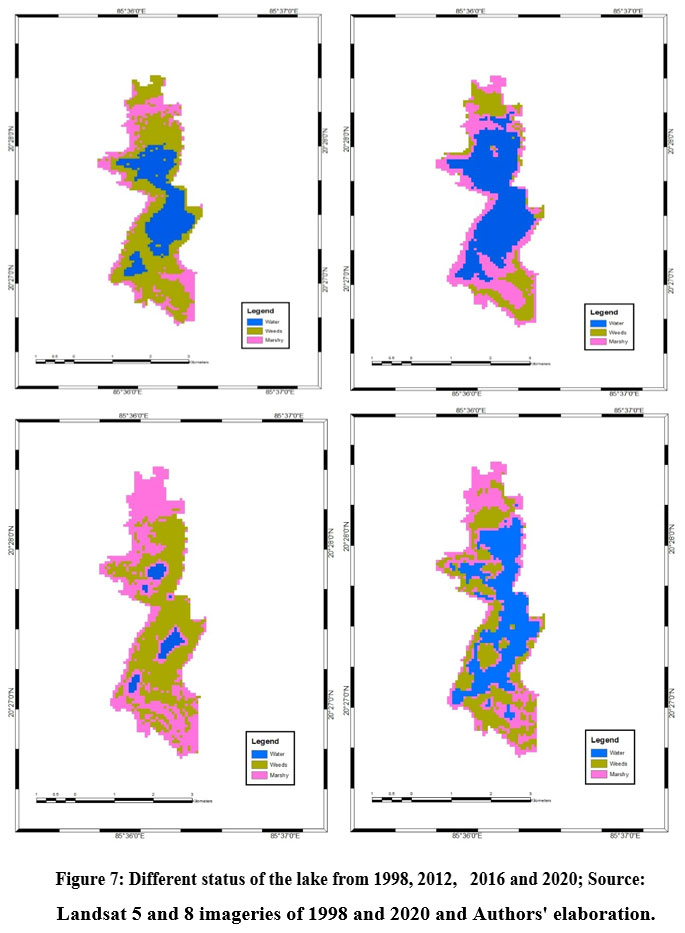 | Figure 7: Different status of the lake from 1998, 2012, 2016 and 2020; Source: Landsat 5 and 8 imageries of 1998 and 2020 and Authors' elaboration.
|
The values of Weed, Water and Marshy coverage has been further depicted here:
Table 2: Weed coverage in 1998, 2012, 2016 and 2019
1998 | 2016 | ||||
Area (Hectare) | Percentage | Area (Hectare) | Percentage | ||
Weeds | 35.91 | 17.35 | Weeds | 99.63 | 48.02 |
Water | 94.05 | 45.30 | Water | 9.36 | 4.51 |
Marshy | 77.49 | 37.35 | Marshy | 98.46 | 47.46 |
2012 | 2020 | ||||
Area (Hectare) | Percentage | Area (Hectare) | Percentage | ||
Weeds | 105.03 | 20.63 | Weeds | 71.55 | 34.49 |
Water | 55.17 | 26.59 | Water | 66.78 | 32.19 |
Marshy | 47.25 | 22.19 | Marshy | 69.12 | 33.31 |
By 2020, people’s participation, primarily women’s participation, along with other organisations, the lake water area has been recovered as 32.19% of area was occupied by water, 34.49% by weeds, and 33.31% by marshes.
Considering such a scenario of changing nutrient load, algal content and weed growth, the water quality of the lake has deteriorated rapidly over the years. As the data suggests, in the year 2012-13 Stations Bishnupur and Kadalibari have recorded excellent WQI making it fit for both human ingestion and aquatic life simultaneously. This corresponds to the cleaning of the lake of weeds and the increase of water body expanse which resulted in such a good water quality. In stations Subarnapur and Sarandagarh the WQI value states that the water cannot be ingested without purification but can be put to use for domestic, irrigation or industrial purposes. These stations being closer to the marshy regions has had a worse quality when compared to the other stations.
Table 3: Water Quality Index (WQI) of different stations in and around Ansupa Lake
YEAR:2012-13 | Year:2019-20 | ||
Station Name | WQI | Station Name | WQI |
Bishnupur | 25.37712789 | Bishnupur | 49.33029416 |
Kadalibari | 24.73757534 | Kadalibari | 87.38131596 |
Subarnapur | 40.55351896 | Subarnapur | 53.08605481 |
Sarandagarh | 32.55157379 | Sarandagarh | 64.56179475 |
Year:2015-16 | Year:2020-21 | ||
Station Name | WQI | Station Name | WQI |
Bishnupur | 93.28328428 | Bishnupur | 19.82751415 |
Kadalibari | 126.0148982 | Kadalibari | 19.23028868 |
Subarnapur | 141.8768017 | Subarnapur | 44.9981921 |
Sarandagarh | 121.4416293 | Sarandagarh | 16.66093531 |
Source: Annual Report of State Pollution Control Board of Odisha and National Water Informatics Centre, 2012-2021
Similarly, in 2015-16 the same stations, Bishnupur and Kadalibari, which had excellent WQI were reduced to Poor and Very poor quality making the former waters fit for Irrigation and the latter being deemed suitable for restricted irrigation use only (Table 3). The station of Subarnapur has recorded a worse WQI than before, making it completely unfit for drinking or aquatic life. Sarandagarh has a relatively better quality than Subarnapur, although the water qualifies as very poor - fit for restricted use in irrigation in both cases. This scenario changes considerably in 2019-20, where it is evident that the lake's water quality has improved than before. In Bishnupur the water quality status is Good, i.e., it can be used for domestic irrigation and industrial purposes whereas in Kadalibari it is of poor quality - only suitable for irrigation purposes. In Subarnapur and Sarandagarh the quality is fair and can be used in irrigation or industrial purposes. This situation further improves by 2020-21, where the quality is found to be much better than 2019-20. As the table depicts, Bishnupur, Kadalibari and Sarandagarh stations are excellent in status which means these waters can be used in drinking,irrigation and industrial purposes. Only in Subarnapur station, the water is good in status which indicates these waters can be used in any kind of irrigation, domestic or industrial purpose.
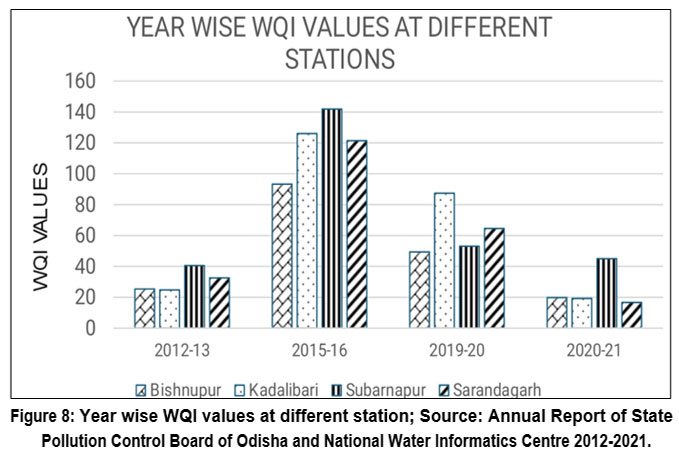 | Figure 8: Year wise WQI values at different station; Source: Annual Report of State Pollution Control Board of Odisha and National Water Informatics Centre 2012-2021.
|
For a better representation, a Bar diagram has been used to represent the change in quality over the years in Figure 8. It shows that WQI values of all stations begin with lower and more acceptable water quality in 2012-23, which suddenly deteriorate by 2015-16 due to negligence, extreme nutrient loads and rampant growth of weeds. In the following year of 2019-20, the WQI values begin improving due to clearing activities taken up by the locals along the stations and this continues in 2020-21, where the stations other than Subarnapur have recorded lower WQI values than even the year 2012-13. in the year of 2020-21. If the stations are compared, the WQI value is highest at Subarnapur station for the 3 of the selected years.It means water is highly polluted at Subarnapur station. The reason behind this is the increased amounts of silt which was deposited into the lake from Sarandagarh and Bishnupur hill. In 2015-2016, its quality drastically degraded due to large-scale runoff from the paddy field - primarily, nitrogen and phosphate that washed off during the rainy season, making it responsible for increased weed infestation. De-weeding used to occur naturally within the lake, during the inflow and outflow of water in times of floods.But with decrease in rainfall and the consequent decrease in water content within the Mahanadi River, the occurrence of flood has significantly reduced, thereby disrupting the de-weeding process.
Due to such continuous changes in water quality and weed growth, the fish community has been greatly affected. This is evident in the following table (Table 4):
Table 4: Year wise fish production of Ansupa Lake
Year | Year-wise Fish production (in tonnes) |
1998 | 2.1 |
1999 | 2.3 |
2000 | 2.8 |
2001 | 3.1 |
2002 | 2.9 |
2003 | 3.8 |
2004 | 4 |
2005 | 4.2 |
2006 | 3.5 |
2007 | 4.5 |
2012 | 2.5 |
2016 | 0.36 |
2019 | 1.8 |
The table shows that fish production since 1998 has gradually increased, albeit with drops in a few years. Suddenly a substantial drop in production (2.5 tonnes) was seen in 2012 which is a contrast to the trend of 2000-2007. The worst fish production year was 2016 (0.36 tonnes), which corresponds well with the worse WQI values of 2015-16. As mentioned before, chemical run-off from the agricultural fields during the rains, intense algal growth and weed infestation led to increased turbidity, lesser phytoplankton and decrease in the dissolved oxygen content in the waters - which in turn lead to diminished fish production. This has gradually improved in 2019 to about 1.8 tonnes, following the de-weeding activities by the locals and the authority of CDA, but it is still nowhere near the previous fish production rates of the 2000s. Therefore, attention needs to be given to more clearing of weeds, better dredging and control of eutrophication from nearby fields which is making the waters toxic for aquatic life.
Assessment of the role of Ansupa Lake in recharging the surrounding groundwater level
Groundwater levels are often dependent on the available rainfall and the natural water reserves such as lakes, rivers etc., as well as the type of anthropogenic activities utilising the water content- such as agriculture/domestic use in rural or urban settings. In the case of Ansupa Lake and its surroundings, which are a part of the Banki Subdivision of Cuttack, the main ways by which groundwater recharge can happen is via infiltration of the rainfall, river water of Mahanadi and by the lake waters itself.
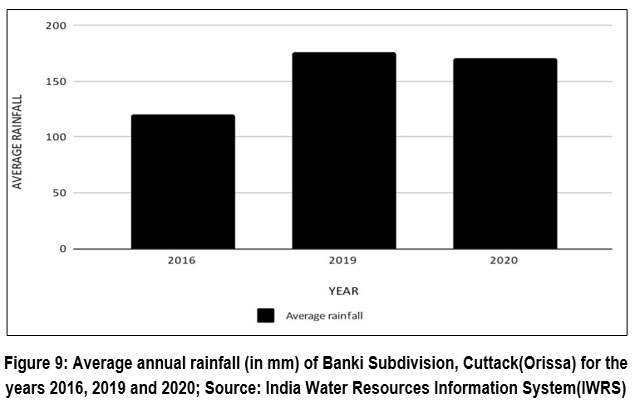 | Figure 9: Average annual rainfall (in mm) of Banki Subdivision, Cuttack(Orissa) for the years 2016, 2019 and 2020; Source: India Water Resources Information System(IWRS)
|
In the context of rainfall, the data portrays that the region has recorded a considerable increase in rainfall since the year 2016 (Figure 9), i.e., from 120 mm to 170mm. Yet the groundwater has not simultaneously increased as can be seen in Figure 10. The Piezometric level shows that from 2010 the groundwater level was around 3.3 mbgl, and has dropped slightly but steadily till 2012 by the next year to about 4.95 mbgl. This begins to rise from 2012 through 2014 when the piezometric level improves to 3.8 mbgl. This fall and consequent rise in the groundwater levels corresponds well with the water content decrease and increase of the Ansupa Lake, respectively. When siltation in the lake has increased the groundwater has fallen and vice versa. In 2015-16 when the lake was sitting up, filling up with weeds and algae and literally vanishing, the piezometric level saw the worst drop in the groundwater levels, i.e., 7.32 mbgl (Figure 10).
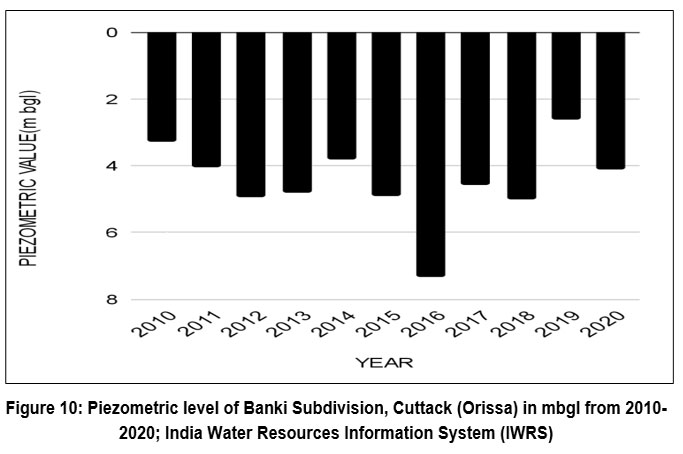 | Figure 10: Piezometric level of Banki Subdivision, Cuttack (Orissa) in mbgl from 2010-2020; India Water Resources Information System (IWRS)
|
The reason behind this is the reduced rainfall amounts, extreme groundwater extraction for agriculture due to lack of water availability from the Ansupa Lake. This makes it evident that the lake does play a significant role in groundwater recharge for Banki Subdivision. Figure 10 further shows that, as soon as the lake begins to clear via government and local help, the recharge of groundwater increases and the piezometric levels start to rise to 4.12 mbgl, right after 2017 till 2020; albeit with minor variations following reduction in rainfall amounts and lesser lake waters.
Suggestion of sustainable measures for better management of Ansupa lake of Orissa/Odisha
The Ansupa Lake has seen various magnitudes of sufferance in all its years of existence. Some has been inflicted by the Mahanadi River - its reduced water content, its siltation activities and weed invasion, while the rest has been largely anthropogenic, such as eutrophication, algal growth and increase of weeds indirectly. But Ansupa has a very unique role to play in the ecosystem as well as the economy of the region providing a great number of benefits. Not only does it support aquatic life, but also supports avian life as migratory birds prefer to nest here and depend on the fish for food. Furthermore, the local residents many of whom are fishermen rely on the available fishing stock for their daily income and would face socio-economic hardships if this lake were to vanish. Hence, conservation and preservation of the lake is essential. A prime problem is the constant flow of soil from the hills due to erosion and consequent deposition into the Ansupa Lake's catchment area. This is decreasing the depth of the lake. To correct this, foliage cover via plantation should be made in the Saranda hill and Bishnupur hills to prevent erosion. Ring embankment should be constructed to prevent the flood water influx and entering of the silt during the rainy season. In this context, the Government of India has undertaken plans to construct a ring dam of 1500m to make Ansupa an international tourist centre supporting eco-tourism such that the economy can be boosted further. This is well possible following the Wetlands (Conservation and Management) Rules 2017 as laid by the Ministry of Environment and Forest and Climate Change, wherein the National Wetland Committee has been made responsible to advise state governments regarding the wise use of wetlands while still maintaining their ecological character.38 This can be implemented to Ansupa by recognising it as a wetland of importance and conservation efforts taken here can be replicated to all lakes like Ansupa in different parts of the nation. Additionally, since the fisherfolk here are poor and any dip in fish production can affect their livelihood, they can be made stakeholders for the lake so that the de-weeding activities can be carried out and the weeds may be used to make organic manure for the agricultural fields. This can increase their income substantially.
Conclusion
The largest freshwater lake of Odisha (Orissa), the Ansupa Lake, once a biodiversity rich region is today in a completely vulnerable state. There are several interconnected issues, including dynamic land use and land cover changes, eutrophication caused by agricultural runoff, excessive siltation, weed and algal infestations, a decline in fish production and migratory bird populations, as well as a decrease in tourism, all of which contribute to deteriorating socio-economic conditions for the villagers living in the area. These threats together have induced the increase in neglect of the lake. As evident in the preceding discussions, dynamic LULC changes have taken place, where gains and losses have occurred to agricultural, settlements and native vegetation, which have affected the quality of Ansupa lake's waters. This has been indicated in the AFAI maps which have shown how fast weed-algal growth, density and pattern can happen if LULC conversion continues at the present rate. Greater the increase in floating masses-lesser is the dissolved oxygen content, which again affects fish productivity. Similarly, NDTI has shown how agricultural effluent and silt inflow in the lake has further deteriorated the transparency of the waters of the Ansupa Lake, suggesting the fact that surrounding changes are the primary controllers of the water quality. But the lake is an important part of the environment here providing a plethora of ecosystem benefits to animal and human life equally. Hence, to rejuvenate the lake and restore its original biotic characteristics, proper de-weeding strategies, desiltation/dredging and better implementation of organic farming is essential if the fish productivity and migratory bird habitat needs to be regained. Further, this has the potential to attract tourists and turn out to be a substantial currency earner, whereby the economy of the locals may be boosted. So, sustainable tourism activities need to be implemented by making the locals - stakeholders of the lake, responsible for both maintaining and profiting from the lake at the same time. Once these strategies are implemented along with conservational laws, such freshwater lakes of the world will never be lost due to adverse human activities in the future.
Acknowledgment
The authors would like to thank Presidency University for granting resources for conducting the research work. The Department of Geography, Presidency University, is highly appreciated for allowing the use of its GIS laboratory work. The authors are also profoundly grateful to the India Water Resources Information system(IWRS) for providing piezometric level data, State Pollution Control Board of Odisha for providing water quality information of the study area and the U.S. Geological Survey (USGS) for allowing free procurement of the Satellite data.
Funding sources
There was no funding. Hence the authors would like to mention the following statement, “The author(s) received no financial support for the research, authorship, and/or publication of this article.”
Conflict of Interest
The author(s) do not have any conflict of interest
Data Availability Statement
The manuscript incorporates all datasets produced or examined throughout this research study
Ethics Statement
This research did not involve human participants, animal subjects, or any material that requires ethical approval.
Informed Consent Statement
This study did not involve human participants, and therefore, informed consent was not required.
Author Contributions
Dr. Deblina Mitra: Methodology, Resources, Visualisation, Writing, Editing, original draft.
References
- Halls AJE. Wetlands, biodiversity and the Ramsar convention: the role of the convention on wetlands in the conservation and wise use of biodiversity. In: Ramsar Convention Bureau. Vol 13. 1997.
- U.S. Department of the Interior. Why are wetlands important? National Parks Service. 2016. Retrieved January 7, 2023, from https://www.nps.gov/subjects/wetlands/why.htm#:~:text=Wetlands%20are%20highly%20productive%20and%20biologically%20diverse%20systems,water%20quality%20provide%20wildlife%20habitat%20maintain%20ecosystem%20productivity
- Ministry of Environment, Forest and Climate Change, Government of India. Wetlands: Introduction. May 2022. Retrieved January 7, 2023, from https://moef.gov.in/en/division/ environment-divisions/wetland/introduction/
- Xu E, Chen Y. Modeling Intersecting Processes of Wetland Shrinkage and Urban Expansion by a Time-Varying Methodology. Sustainability. 2019;11(18):4953. doi:10.3390/SU11184953
CrossRef - Catallo W. Ecotoxicology and wetland ecosystems: Current understanding and future needs. Environmental Toxicology and Chemistry. 1993;12:2209-2224. doi:https://doi.org/10.1002/ETC.5620121205
CrossRef - Burton TM, Tiner RW. Ecology of Wetlands. In: Encyclopedia of Inland Waters. ; 2009:507-515. doi:https://doi.org/10.1016/B978-012370626-3.00056-9.
CrossRef - Pandey G. Wetlands and their Role in Water Conservation: A Review. International Journal of Advance Research and Innovation. Published online 2016. doi:https://doi.org/10.51976/ijari.411612
CrossRef - Junk WJ. Long-term environmental trends and the future of tropical wetlands. Environmental Conservation. 2002;29(4):414-435. doi:10.1017/S03768922902000310
CrossRef - Gopal B. Perspectives on wetland science, application and policy. Hydrobiologia. 2003;490(1):1-10. doi:10.1023/A:1023418911648
CrossRef - Hu S, Niu Z, Chen Y, Li L, Zhang H. Global wetlands: Potential distribution, wetland loss, and status. Science of The Total Environment. 2017;586:319-327. doi:10.1016/J.SCITOTENV.2017.02.001
CrossRef - Fluet-Chouinard E, Stocker BD, Zhang Z, et al. Extensive global wetland loss over the past three centuries. Nature. 2023;614(7947):281-286.
CrossRef - Foote AL, Pandey S, Krogman N. Processes of wetland loss in India. Environmental Conservation. 1996;23(1):45-54. doi:10.1017/S0376892900038248
CrossRef - Singh S, Bhardwaj A, Verma VK. Remote sensing and GIS based analysis of temporal land use/land cover and water quality changes in Harike wetland ecosystem, Punjab, India. Journal of Environmental Management. 2020;262:110355. doi:10.1016/J.JENVMAN.2020.110355
CrossRef - Basu T, Das A, Pham QB, Al-Ansari N, Linh NTT, Lagerwall G. Development of an integrated peri-urban wetland degradation assessment approach for the Chatra Wetland in eastern India. Scientific Reports. 2021;11(1):4470. doi:10.1038/S41598-021-83512-6
CrossRef - Sarif MN, Ali MI, Karikar BA, Siddiqui L. Assessing Land Use/Land Cover Transformation and Wetland Decline in Birbhum District, West Bengal: A Time-Series Analysis. Published online January 1, 2024:265-281. doi:10.1007/978-3-031-61121-6_16
CrossRef - Lahon D, Sahariah D, Debnath J, et al. Assessment of Ecosystem Service Value in Response to LULC Changes Using Geospatial Techniques: A Case Study in the Merbil Wetland of the Brahmaputra Valley, Assam, India. 2023;12(4):165. doi:10.3390/ijgi12040165
CrossRef - Imdad K, Rihan M, Sahana M, et al. Wetland health, water quality, and resident perceptions of declining ecosystem services: a case study of Mount Abu, Rajasthan, India. Environmental Science and Pollution Research. Published online July 19, 2022:1-27. doi:10.1007/s11356-022-21902-7
CrossRef - Zhang ZS, Mei ZP. Effects of human activities on the ecological changes of lakes in China. GeoJournal. 1996;40(1):17-24. doi:10.1007/BF00222526
CrossRef - Lane R. Lake: physical feature. Encyclopædia Britannica. August 2024. Retrieved from: https://www.britannica.com/topic/water-purification/Other-purification-steps
- Mohanty, P. K. ANSUPA: A WETLAND. ODISHA REVIEW, 2015: 108.
- De Meester L, Declerck S, Stoks R, et al. Ponds and pools as model systems in conservation biology, ecology and evolutionary biology. Aquatic Conservation-marine and Freshwater Ecosystems. 2005;15(6):715-725. doi:10.1002/AQC.748
CrossRef - Das CR, Mohanty S. Integrated sustainable environmental conservation of Ansupa lake: A famous water resource of Orissa, India. Water and Energy International. 2008;65(4):62-66. https://www.indianjournals.com/ijor.aspx?target=ijor:wei&volume=65&issue=4&article=010.
- Jamal S, Ahmad WS. Assessing land use land cover dynamics of wetland ecosystems using Landsat satellite data. 2020;2(11):1-24. doi:10.1007/S42452-020-03685-Z
CrossRef - Singh P, Javed S, Shashtri S, Singh RP, Vishwakarma CA, Mukherjee S. Influence of changes in watershed landuse pattern on the wetland of Sultanpur National Park, Haryana using remote sensing techniques and hydrochemical analysis. Remote Sensing Applications: Society and Environment. 2017;7:84-92. doi:10.1016/J.RSASE.2017.07.002
CrossRef - Howard GW, Harley KLS. How do floating aquatic weeds affect wetland conservation and development? How can these effects be minimised? Wetlands Ecology and Management. 1997;5(3):215-225. doi:10.1023/A:1008209207736
CrossRef - Adhya T, Banerjee S. Impact of Wetland Development and Degradation on the Livelihoods of Wetland-dependent Communities: a Case Study from the Lower Gangetic Floodplains. Wetlands. 2022;42(7). doi:10.1007/s13157-022-01588-w
CrossRef - Dar SA, Bhat SU, Rashid I, Dar SA. Current Status of Wetlands in Srinagar City: Threats, Management Strategies, and Future Perspectives. Frontiers in Environmental Science. 2020;7. doi:10.3389/FENVS.2019.00199
CrossRef - Semwal P, Khobragarde S, Joshi SK, Kumar S. Variation in ? 18 O and ? 2 H values of rainfall, surface water, and groundwater in the Sukhna Lake basin in northwest India. Environmental Earth Sciences. 2020;79(24):1-14. doi:10.1007/S12665-020-09285-9
CrossRef - Ojha A, Pattnaik AK, Rout J. Climate change impacts on natural resources and communities: A geospatial approach for management. Lakes and Reservoirs: Research and Management. 2018;23(1):34-42. doi:10.1111/LRE.12209
CrossRef - Rout J, Ojha A. Geospatial Technology Application on Sustainable Wetland Management & Monitoring: A Case of Ansupa Lake, Odisha. Journal of Remote Sensing & GIS. 2019b;10:13-18.
- Rout J, Ojha A. Morphometric Analysis of Ansupa Lake, Odisha using GIS Technique. Journal of Remote Sensing & GIS. 2019;5:15-22.
- Panda M, Samal RN, Bhatta KS, Lenka S, Patra HK, Nanda S. Diversity and distribution of vascular macrophytes in Ansupa Lake, Odisha, India. 2018;8(1):1-12. doi:10.13057/BONOROWO/W080101.
CrossRef - Ramsar Sites Service(RSS 2.0). Ansupa Lake | Ramsar Sites Information Service. Ramsar.org. Published 2021. Accessed January 7, 2025. https://rsis.ramsar.org/ris/2487
- Pattanaik C, Reddy CS. Need for the conservation of wetland ecosystems?: A case study of Ansupa Lake (Orissa, India) using remote sensing based data. National Academy Science Letters-india. 2007;30:161-164.
CrossRef - Bid S, Siddique G. Identification of seasonal variation of water turbidity using NDTI method in Panchet Hill Dam, India. Modeling Earth Systems and Environment. 2019;5(4):1179-1200. doi:10.1007/S40808-019-00609-8
CrossRef - Fang C, Song K, Shang YX, Ma JH, Wen ZD, Du J. Remote Sensing of Harmful Algal Blooms Variability for Lake Hulun Using Adjusted FAI (AFAI) Algorithm. Journal of Environmental Informatics. 2018;34(2):108-122. doi:10.3808/JEI.201700385
CrossRef - Banerji S, Chakraborty N, Mitra D. Water woes and vulnerabilities: a case study of Bally-Jagachha block of Howrah District in West Bengal, India. Local Environment. 2023;28(12):1590-1607. doi:10.1080/13549839.2023.2248609
CrossRef - Regulatory Framework - Wetlands of India Portal. Wetlands of India Portal. Published 2017. Accessed February 2, 2025. https://indianwetlands.in/our-work/regulatory-framework/CrossRef


