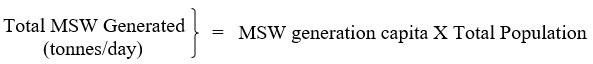
Seasonal Characterization and Estimation of Per Capita Solid Waste Generation in Tumakuru City, Karnataka, India
Kariyanna Harisha
*
 and Jambhava Samavedamuni Chandrashekar
1
Department of Studies and Research in Environmental Science,
Karnataka State Open University,
Mysuru,
Karnataka
India
http://dx.doi.org/10.12944/CWE.20.1.25
Copy the following to cite this article:
Harisha K, Chandrashekar J. S. Seasonal Characterization and Estimation of Per Capita Solid Waste Generation in Tumakuru City, Karnataka, India. Curr World Environ 2025;20(1). DOI:http://dx.doi.org/10.12944/CWE.20.1.25
Copy the following to cite this URL:
Harisha K, Chandrashekar J. S. Seasonal Characterization and Estimation of Per Capita Solid Waste Generation in Tumakuru City, Karnataka, India. Curr World Environ 2025;20(1).
Download article (pdf)
Citation Manager
Publish History

Introduction
Waste is an important raw material that is in the wrong place. and it is a by-product of living. Waste is being generated at a faster rate than urbanization.1 Solid waste, which is typically thrown away as unwanted or useless and is frequently referred as the third form of pollution after air and water pollution. It is made up of incredibly diverse mass of urban waste-related materials.2 For developing nations like India, which has a large population density after China, there are industries, townships and urban settlements for the growth of the country. Due to the unemployment problem for various reasons, there is a huge migration of residents from rural areas to urban areas leading to urban sprawl. Which in turn leads to a high quantity of Municipal solid waste (MSW) generation in major cities in India.3
MSW generation in cities of India is on the rise as a result of industrialization, urbanization, population growth, and the most significant environmental challenges facing the world today. As noted, improper handling of MSW can result in problems with the environment, public health, and the economy, making efficient waste management techniques imperative.4 and how urban area’s rising per capita waste generation rates are caused by increased industrial development, fast population growth, and rising living standards. It draws attention to how different geographical areas have different compositions of solid waste due to influences from social behaviour, economic status, weather, and industrial output.4,5
Waste from multiple sources varies in their physical characteristics because they are highly heterogeneous. The composition of wastes like food waste, yard waste, wood, plastic, glass, metal, Batteries, paints, rubber, textiles, biomedical waste, and construction & demolishing waste would be difficult to segregate & classify as mixed waste hence it is a major drawback in the utilization of raw materials in further treatment process. Hence, source waste sorting & segregation is one of the traditional fractionation methods to provide potential data on waste generation, quality & quantity of the fractions.6,13-15,17,22,23
The primary components of urban waste are the same everywhere in the world, but the weight, density, and percentage of constituents vary greatly between nations and between towns within a nation based on factors like social conditions, geographic location, economic development, and weather.7,11-17 Inadequate waste collection, segregation, transport, treatment, and disposal have severe impacts on the environment.8,25 Sustainable technology includes earthworm farming a bio-technique for converting solid waste such as sewage sludge, domestic waste or agricultural products waste into compost.1 In the majority of developing nations collection efficiency is about 60-70% but the same in developed nations it’s 100%. Even today in many cities there is no proper SWM and waste is dumped along roadsides, and open areas which contributes to an increase in Air pollution, and percolation of Leachate leads to groundwater contamination respectively.3,25
Integrative solid waste management highlights the significance of MSW characterization for the design and execution of efficient waste management programs. Waste prevention, reduction, reuse, recycling (including Composting), incineration, and disposal at current landfills are emphasized as essential elements of ISWM. sustainable management of biodegradable waste and biodegradable Municipal Waste products has been made possible by the waste characterization.9,13 As reported by Central Pollution Control Board, MSW generation in the year 2019-20 was about 152076 tons per day and about 127486 tons per day in 2010-2011 in India. Total MSW generation in Karnataka was 11958 tons per day and of which 10011 tons per day is collected and 4515 tons per day is treated. Mostly, all Urban local bodies gather mixed waste and transport to the processing plants or Landfill sites. Wherever processing plants are established, segregation is done at the processing plants, otherwise, mixed solid waste is dumped in the landfill sites without processing.7,8
Problem statement
In Karnataka, solid waste management is a concerningly big problem in fast-growing cities like Tumakuru, which is close to the state capital. The Tumakuru City Corporation (TCC) main project is MSW Management. This procedure comprises the collection of waste from all homes, businesses, and other sources. Next, the waste is taken to the transfer stations, and lastly, to the disposal locations. Over time, Tumakuru's infrastructure, business, and population have all expanded steadily, and waste production has also increased along with consumption and production. Prior to 2011, the city of Tumakuru was dealing with a serious shortage of infrastructure for the processing and disposal of MSW, as well as the absence of a standard dump site. In late 2014, a 42-acre dumpsite was established at Ajjagondanahalli. All of the waste was taken to the private agency-managed Doddabalapur dump yard and disposed of along the city's NH-4 road and roadside. According to the records of the City Corporation, an estimated 131 TPD of MSW is generated, of which 118 TPD are collected with an efficiency of 90%. Increased waste generation raises the problem of efficient waste collection and transportation, which urban local bodies are responsible for handling. Out of 35 wards, only 15 practice door-to-door collection, based on our preliminary data and research. By analyzing the various waste types produced in the city, this study aids in the creation of appropriate technologies for the scientific treatment of waste. The study's primary goals are to ascertain the factors influencing waste management, describe and explain the current waste management system and practices, and offer suggestions for the efficient and long-term growth of Tumakuru City's solid waste management system.
Materials and Methods
Study area
Tumakuru is the head quarter town of the district. Tumakuru is a land –locked district, has no natural features like rivers or mountain dividing it from other districts of the state. It is one of the thirty districts in the state of Karnataka, bounded by Chitradurga and Anantapur districts in the north, Mandya district in the South, Kolar and Bangalore districts in the East and Hassan district in the West. Tumakuru spanning a geographical area of 10598 km2 and the district stretched between the latitudinal parallels of 12° 45' to 14° 20' N and the longitudinal meridians of 76° 20' to 77° 31' E.
With the exception of the northernmost portion, the district's climate is generally pleasant and comparable to Bangalore's district. However, the climate in the north of Sira and the Pavagada region is similar to that of Chitradurga district, with somewhat hotter summers. Annual Rainfall in the district amounts to 687.9 mm per year. Temperatures range from 35°C to 41°C at their highest, and during the cold season, they can drop as low as 9°C to 10°C.9
The standard sampling and methods were adopted in the study. Totally 35 wards are there in Tumakuru city, out of which, 3 wards were selected for the study. The study was carried out based on preliminary survey, socio-economic category, population density, schools, colleges, and hospitals are considered to get representative results in the study. In all three wards, 10 households were selected randomly from each socioeconomic category. A total of 420 samples were collected during both the seasons (winter and summer) from the three sampling areas. The households selected were informed and provided with carry bags for a week and weighed separately on a calibrated digital scale and recorded in datasheets.
There are 35 wards in Tumakuru City Corporation, out of which, 3 wards were selected for the study. The study was carried out based on preliminary questionnaire survey, the representative three wards were selected to carry out the sampling in Tumakuru City. Solid waste generation in different socio-economic category based on their average monthly income, three income groups (HIG,MIG,LIG) were separated before collection of solid waste samples in each household for one week to get representative results in the study.10,13 A total of 420 samples were collected during both the seasons (winter and summer) from the three sampling areas. The households selected were informed and provided with carry bags for a week and weighed separately on a calibrated digital scale and recorded in datasheets.
.jpg)
Results and Discussions
Table 1: Total MSW and TPCD generated by each Household in High income wards during Winter and Summer seasons
No. of Households | No of household Members | Total MSW (kg) | TPCD (kg) | ||
Winter ( Mean ±SD) | Summer ( Mean ±SD) | Winter ( Mean ±SD) | Summer ( Mean ±SD) | ||
HH1 | 4 | 8.824 ± 0.095 | 9.445±0.104 | 0.315 ±0.023 | 0.337±0.026 |
HH2 | 5 | 9.106 ± 0.097 | 12.175±0.060 | 0.260 ±0.019 | 0.347±0.012 |
HH3 | 6 | 14.089 ± 0.090 | 15.416±0.087 | 0.335 ±0.014 | 0.367±0.014 |
HH4 | 5 | 9.411 ± 0.120 | 12.24±0.103 | 0.268 ± 0.023 | 0.349±0.020 |
HH5 | 6 | 14.202 ± 0.132 | 15.321±0.098 | 0.338 ±0.021 | 0.364±0.016 |
HH6 | 6 | 14.463 ± 0.095 | 15.487±0.062 | 0.344 ±0.015 | 0.368±0.010 |
HH7 | 4 | 8.853 ± 0.137 | 9.416±0.036 | 0.316 ±0.034 | 0.336±0.009 |
HH8 | 5 | 10.172 ± 0.073 | 12.03±0.121 | 0.290 ±0.014 | 0.343±0.024 |
HH9 | 5 | 9.316 ± 0.082 | 12.13±0.131 | 0.266 ±0.016 | 0.346±0.026 |
HH10 | 5 | 10.032 ± 0.143 | 12.28±0.078 | 0.286 ±0.028 | 0.350±0.015 |
Total | 51 | 108.468 | 125.94 | 0.303 | 0.351 |
Total No. of Samples | 70 | 70 | 70 | 70 | |
Table 2: Total MSW and TPCD generated by each Household in Medium income wards during Winter and Summer seasons
No. of Households | No of household Members | Total MSW (kg) | TPCD (kg) | ||
Winter (Mean ±SD) | Summer (Mean ±SD) | Winter (Mean ±SD) | Summer (Mean ±SD) | ||
HH1 | 5 | 7.611 ±0.109 | 7.828±0.089 | 0.217 ±0.021 | 0.223±0.017 |
HH2 | 4 | 8.727 ±0.134 | 9.131±0.045 | 0.311 ±0.033 | 0.326±0.011 |
HH3 | 3 | 7.684 ±0.123 | 8.299±0.167 | 0.365 ±0.041 | 0.395±0.055 |
HH4 | 6 | 11.302 ±0.085 | 15.361±0.279 | 0.269 ±0.014 | 0.365±0.046 |
HH5 | 4 | 8.612 ±0.132 | 9.026±0.087 | 0.307 ±0.033 | 0.322±0.021 |
HH6 | 7 | 14.527 ±0.282 | 19.66±0.318 | 0.296 ±0.040 | 0.401±0.045 |
HH7 | 4 | 8.207 ±0.155 | 9.23±0.095 | 0.293 ±0.038 | 0.329±0.023 |
HH8 | 3 | 7.095 ±0.083 | 8.276±0.093 | 0.337 ±0.027 | 0.394±0.031 |
HH9 | 3 | 3.555 ±0.028 | 8.2±0.080 | 0.169 ±0.009 | 0.390±0.026 |
HH10 | 5 | 9.264 ±0.163 | 9.76±0.178 | 0.264 ±0.032 | 0.278±0.035 |
Total | 44 | 86.584 | 104.771 | 0.283 | 0.342 |
Total No. of Samples | 70 | 70 | 70 | 70 | |
Table 3: Total MSW and TPCD generated by each Household in low income wards during Winter and Summer Seasons
No. of Households | No of household Members | Total MSW (kg) | TPCD (kg) | ||
Winter ( Mean ±SD) | Summer (Mean ±SD) | Winter ( Mean ±SD) | Summer ( Mean ±SD) | ||
HH1 | 6 | 12.582 ± 0.085 | 14.654±0.123 | 0.299 ±0.014 | 0.348±0.020 |
HH2 | 5 | 11.427 ±0.111 | 13.749±0.096 | 0.326 ±0.022 | 0.392±0.019 |
HH3 | 7 | 12.7 ±0.078 | 15.885±0.106 | 0.259 ±0.011 | 0.324±0.015 |
HH4 | 6 | 12.855 ±0.086 | 15.524±0.136 | 0.306 ±0.014 | 0.369±0.022 |
HH5 | 5 | 11.503 ±0.105 | 13.775±0.052 | 0.328 ±0.021 | 0.393±0.010 |
HH6 | 8 | 13.068 ±0.179 | 16.39±0.105 | 0.233 ±0.022 | 0.292±0.013 |
HH7 | 6 | 12.892 ±0.109 | 15.43±0.144 | 0.306 ±0.018 | 0.367±0.024 |
HH8 | 7 | 11.727 ±0.099 | 15.06±0.058 | 0.239 ±0.014 | 0.307±0.008 |
HH9 | 5 | 11.868 ±0.125 | 14.16±0.122 | 0.339 ±0.025 | 0.404±0.024 |
HH10 | 6 | 13.054 ±0.140 | 15.02± 0.165 | 0.310 ±0.023 | 0.357±0.027 |
Total | 61 | 123.676 | 149.647 | 0.294 | 0.360 |
Total No. of Samples | 70 | 70 | 70 | 70 | |
MSW generation amounts in each household across all three different income groups (HIG,MIG,LIG) during the winter and summer seasons (Table 1, 2 and 3). Seven days solid waste was gathered for each income group and quantified in both the seasons every day for a week, which comes to 210 samples for each season. Tumakuru city generated 700 kg of solid waste from all the three different income groups(HIG,MIG,LIG) during winter and summer seasons.11,12
MSW generation amounts in each household across all three different income groups during the winter and summer seasons (Table 1, 2 and 3). Seven days solid waste was gathered for each income group and quantified in both the seasons every day for a week, which comes to 210 samples for each season. Tumakuru city generated 699.086 kg of solid waste from all the three different income groups (HIG,MIG,LIG) during winter and summer seasons.11,12,18-20,24,25,27 By taking into account the mean of the total weight of the winter and summer seasons for each of the three different income groups (HIG,MIG,LIG), the average household composition value for MSW per capita was calculated for both the seasons.
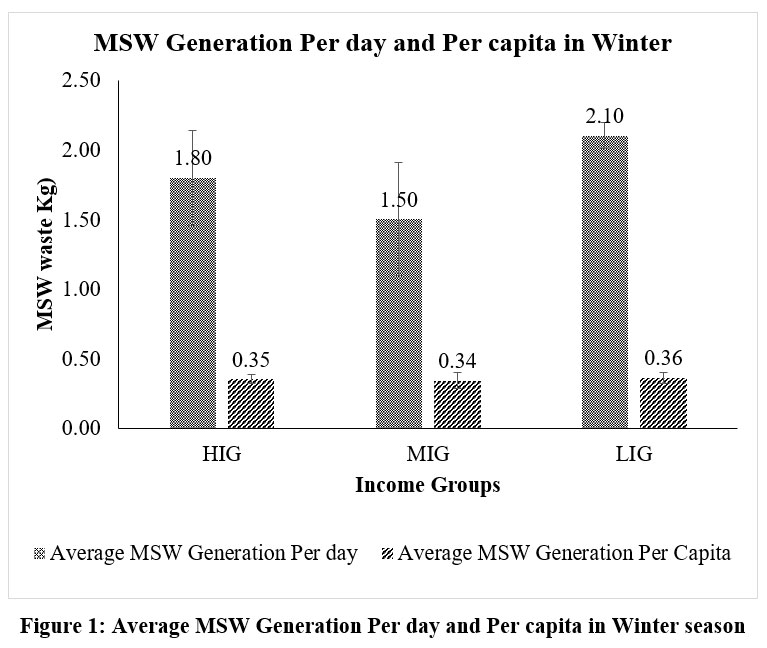 | Figure 1: Average MSW Generation Per day and Per capita in Winter season
|
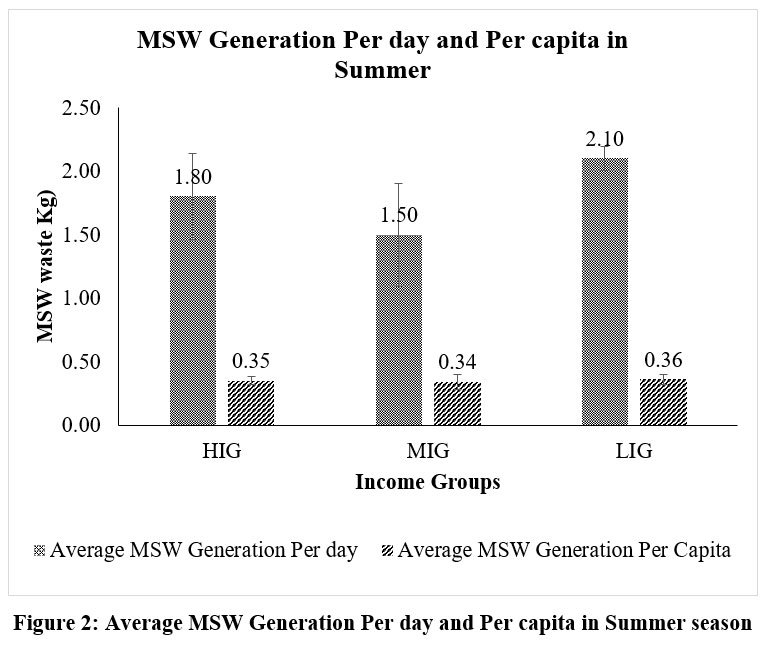 | Figure 2: Average MSW Generation Per day and Per capita in Summer season
|
The average amount of MSW produced daily for an individual person was 1.66 kg/capita/day. The study highlighted that, high income group generated approximately 1.55 and 1.8 kg of waste/capita/day during winter and summer respectively. And the middle income group generated 1.24 and 1.5 kg/capita/day, while the low income group generated 1.77 and 2.12 kg/capita/day of solid waste during winter and summer respectively (Figure 1 and 2). In both the seasons, however, there was no significant variation in the MSW generation rate per person per day across the three income groups day.8 The MSW generation was highest in summer compared to the winter season. This could be because highest consumption of fresh juice, drinks, fruits and vegetables, which in turn produces more MSW in summer. A tier II city, Tumakuru generates roughly about 141 TPD. Tumakuru's MSW generation was lower than that of tier II cities like Davangere and Shivamogga.11,12 Further, it is evidenced that all capital cities in India generated more MSW than tier II cities4. The city may produce more MSW because of its proximity to the capital city and placed in National Highway-4 result in faster growth in terms of population and urbanization and industrialization.
The study is graphically depicted in Figures 1 and 2. The average amount of MSW produced daily for an individual person was 1.66 kg/capita/day. According to the study, during the winter and summer, the high income group (HIG) generated approximately 1.55 and 1.8 kg/capita/day and the middle income group (MIG) generated 1.24 and 1.5 kg/capita/day respectively, while the low income group (LIG) generated 1.77 and 2.12 kg/capita/day of waste.( Fig. 1 and 2 ).this information can be utilized to determine the best methods to treat the MSW. In both the seasons, however, there was no significant variation in the MSW generation rate per person per day across the three income groups.8 The MSW generation was highest in the summer compared to the winter season. This could be because more fresh juice, drinks, fruits and vegetables are consumed, which in turn produces more MSW. A tier II city, Tumakuru generates roughly 141 TPD. Similar MSW generation studies performed in Davangere, Shivamogga, Guwahati, Visakhapatnam,Ujjain,Varanasi and the results reported were lower when compared to Davangere, Shivamogga, Guwahati, Visakhapatnam, Ujjain, indore, Kochi and Varanasi.11,12,18-20-28 Further evidence that all capital cities Like Bangalore, Mumbai, Jaipur etc generated more MSW than tier II cities.4,18,19 The city may produce more MSW because of its proximity to the capital city as well as the speed at which it is becoming industrialized and urbanized.
Conclusions and Recommendations
The Tier–II city like Tumakuru generating MSW was highest in LIG which is nearly 1.77 to 2.1 kg/capita/day compared to other income groups. The least amount of MSW was generated in MIG is about 1.2 to 1.5 kg/capita/day in Tier-II city like Tumakuru. This will cause poor management I tier-II cities, due to shortage of suitable infrastructure for MSW collection, transportation, processing and disposal of waste scientifically. Based on the study about 65% of the Total MSW was generated from household. Waste can be managed through composting and other process in Tumakuru city. It was also suggested that total quantity of waste generated in the Tumakuru city can be managed by having a landfilling and also by setting up a zero waste management plant. Segregation of waste at source with twin bins having segregated waste transportation vehicles to increase the processing efficiency. It is also noteworthy for creating awareness among the public.
Acknowledgement
We are very grateful to the department of studies and research in Environmental science, Karnataka state open university, Mysuru. we also acknowledge Tumakuru city corporation, Tumakuru, regional office of the Karnataka state pollution control board, Tumakuru and Tumakuru smart city Ltd. for providing the required secondary data for conducting the study.
Funding Sources
The author(s) received no financial support for the research, authorship, and/or publication of this article.
Conflict of Interest
The authors do not have any conflict of interest.
Data Availability Statement
This statement does not apply to this article.
Ethics Statement
This research did not involve human participants, animal subjects, or any material that requires ethical approval.
Informed Consent Statement
This study did not involve human participants, and therefore, informed consent was not required.
Author Contributions
Kariyanna Harisha: Research Scholar worked for the study in Conceptualization, Sampling, Experiment design, Laboratory experiments, Data analysis and original drafting of paper. Jambhava Samavedamuni Chandrashekar: Research Guide and reviewed the study.
References
- Environmental Chemistry. Krishna Prakashan Media.
- Rana SVS. Essentials of Ecology and Environmental Science. Phi Learning Private Ltd; 2013.
- Nandan A, Yadav BP, Baksi S, Bose D. Recent Scenario of Solid Waste Management in India. World Scientific News. 2017;66:56-74.
- D P Angadi. A Review On Current Status Of MSW Management In Karnataka State: A Geographical Study. International Journal of Advances in Engineering and Management (IJAEM). 2022;4(217). doi:https://doi.org/10.35629/5252-0402217225.
- Ilyas H, Ilyas S, Rashid Ahmad S, Nawaz Ch M. Waste Generation Rate and Composition Analysis of Solid Waste in Gujranwala City Pakistan. International Journal of Waste Resources. 2017;07(03). doi:https://doi.org/10.4172/2252-5211.1000297.
CrossRef - Nadeem K, Farhan K. Waste Amount Survey and Physio-Chemical Analysis of MSW Generated in Gujranwala-Pakistan. International Journal of Waste Resources. 2016;06(01). doi:https://doi.org/10.4172/2252-5211.1000196.
CrossRef - Implementation of Solid Waste Management Rules. CPCB Annual Report ; 2019.
- Alam P, Mazhar MohdA, Khan AH, Khan NA, Mahmoud AED. Seasonal characterization of MSW in the city of Jammu, India. IOP Conference Series: Materials Science and Engineering. 2021;1058(1):012061. doi:https://doi.org/10.1088/1757-899x/1058/1/012061.
CrossRef - Karnataka State Gazetteer: Tumkur.; 1969.
- ASTM (2008) Standard test method for determination of the composition of unprocessed MSW. D5231- 92, ASTM International, West Conshohocken.
- Nagarajappa D. Solid Waste Management in Davangere. International Research Journal of Engineering and Technology . Published online 2018.
- Kiran D, SV Pushkara, R Jitvan, S Darshan. Characterization, quantification and management of MSW in Shivamogga city, Karnataka, India. Waste Management Bulletin. 2023;1(3):18-26. doi:https://doi.org/10.1016/j.wmb.2023.06.006.
CrossRef - SWACHH BHARAT MISSION MSW MANAGEMENT MANUAL.www.swachhbharaturban.gov.in.
- Bowan PA, Tierobaar MT. Characteristics and Management of Solid Waste in Ghanaian Markets - a Study of WA Municipality. Published January 1, 2014. https://www.researchgate.net/publication/326671025.
- Dahal Y, Adhikari B. Characterization and Quantification of MSW in Jeetpur Simara Sub- Metropolitan City, Nepal. Hydro Nepal: Journal of Water,EnergyandEnvironment.2018;22:45-47. doi:https://doi.org /10.3126/hn .v2 2i0.18996.
CrossRef - Mohamed Elzaki AA, Elhassan BM. Quantification and Characterization of Solid Waste in Alkalakla Administrative Unit, Khartoum State-Sudan. International Journal of Waste Resources. 2019;09(01). doi:https://doi.org/10.35248/2252-5211.19.9.364.
CrossRef - Robert Ekwule O, Emmanuel Nwafor O, Isaac Ufedo M. Per Capita Solid Waste Generation and Characterization in Makurdi Metropolis, Nigeria . KUJES. 2020;6(1).
- Singhal A, Gupta AK, Dubey B, Ghangrekar MM. Seasonal characterization of MSW for selecting feasible waste treatment technology for Guwahati city, India. Journal of the Air & Waste Management Association. 2021;72(2):147-160. doi:https://doi.org/10.1080/10962247.2021.1980450.
CrossRef - Dasgupta B, Yadav VL, Mondal MK. Seasonal characterization and present status of MSW (MSW) management in Varanasi, India. Advances in environmental research. 2013;2(1):51-60. doi:https://doi.org/10.12989/aer.2013.2.1.051.
CrossRef - Agrawal A, Pandey R, Agrawal ML. Seasonal variation in composition and characteristics of Indian MSW –A case study. Recent Research in Science and Technology. 2013;5(5):40-43.
- AK H. Waste characterization in Istanbul and a proposal for biodegradable solid waste management. Environmental Research and Technology. Published online April 2, 2020. doi:https://doi.org/10.35208/ert.690825.
CrossRef - Kumar S, Smith SR, Fowler G, et al. Challenges and opportunities associated with waste management in India. Royal Society Open Science. 2017;4(3):160764. doi:https://doi.org/10.1098/rsos.160764.
CrossRef - Miezah K, Obiri-Danso K, Kádár Z, Fei-Baffoe B, Mensah MY. MSW characterization and quantification as a measure towards effective waste management in Ghana.WasteManagement.2015;46:15-27. doi: https://doi.org/ 10.1016/j.wasman. 2015 .0 9.009.
CrossRef - Sharma DrN. Management of Solid Waste from Jaipur City;Seasonal Variation of City Waste Corporation and Features. MET Management Review. 2021;08(02):29-35. doi:https://doi.org/10.34047/mmr.2020.8204.
CrossRef - Cheela VRS, Goel S, John M, Dubey B. Characterization of MSW based on seasonal variations, source and socio-economic aspects. Waste Disposal & Sustainable Energy. 2021;3(4):275-288. doi:https://doi.org/10.1007/s42768-021-00084-x.
CrossRef - Kalyanasundaram M, Krishnan K, Singh S, et al. Composition analysis (pick analysis) of waste generated from household: A pilot study in Ujjain city, India. Heliyon. 2023;9(9):e19902. doi:https://doi.org/10.1016/j.heliyon.2023.e19902.
CrossRef - Agrawal A, Pandey R, Agrawal ML. Seasonal variation in composition and characteristics of indian MSW –A case study. Recent Research in Science and Technology. 2013;5(5):40-43.
- Paul B, Paul D. Comparative Analysis of MSW Management in Kochi and Indore. Nature Environment and Pollution Technology. 2021;20(3). doi:https://doi.org/10.46488/nept.2021.v20i03.047.
CrossRef


