Impact of Land Use Land Cover Change on Land Surface Temperature of Paschim Bardhaman District, India
Moumita Hati
 , Yamanur Venkata Krishnaiah
*
, Debasis Das
, Manika Mallick
, Vajana Mondal
, Kausik Panja
, Deepa Rai
and Atoshi Chakma
, Yamanur Venkata Krishnaiah
*
, Debasis Das
, Manika Mallick
, Vajana Mondal
, Kausik Panja
, Deepa Rai
and Atoshi Chakma
1
Department of Geography and Disaster Management,
Tripura University,
Suryamaninagar,
Tripura
India
http://dx.doi.org/10.12944/CWE.20.1.24
Copy the following to cite this article:
Hati M, Krishnaiah Y. V, Das D, Mallick M, Mondal V, Panja K, Rai D, Chakma A. Impact of Land Use Land Cover Change on Land Surface Temperature of Paschim Bardhaman District, India. Curr World Environ 2025;20(1). DOI:http://dx.doi.org/10.12944/CWE.20.1.24
Copy the following to cite this URL:
Hati M, Krishnaiah Y. V, Das D, Mallick M, Mondal V, Panja K, Rai D, Chakma A. Impact of Land Use Land Cover Change on Land Surface Temperature of Paschim Bardhaman District, India. Curr World Environ 2025;20(1).
Download article (pdf)
Citation Manager
Publish History

Introduction
Over the years, anthropogenic activities have significantly altered the earth's surface, particularly through intensive urban growth, industrialisation, agricultural practices, deforestation, etc. One of most significant changes on the earth's surface is the shift in LULC.1-3 Sudden and drastic changes of land cover put people in social and economic disadvantages. The proportion of vegetation cover is the key indicator to maintain micro-level climate, surrounding ecosystem and the urban ecological quality, which is directly associated with temperature.4,5 Urban built-up and barren lands have the highest surface temperature fluctuation while the rural area temperature decreases. Land cover, as well as the thermal behaviour of the urban land surface, are all important for managing the ecological condition.6-9
In general Land Surface Temperature is higher in core city areas rather than surrounding suburban and rural areas. Higher LST leads to Urban Heat Island (UHI) phenomena as a serious environmental problem caused by urban-industrial expansion, unique characteristics of cities10,11, poor evaporation, increasing anthropogenic heat release, pollution, impermeable surfaces, construction of high-rise buildings which reduced air circulation and potentially disrupt the weather patterns.12-15 Increasing terrestrial heat and UHI are a critical issue for urban environmental planning16,17 Along with the compact built-up, mining and industrial operations were projected to have a significant influence on local climate 18 19. Mining and industrial regions were the most common canopy-layer with heat island hotspots throughout the night due to anthropogenic heat.20
A comprehensive understanding of dynamic changes of land use is necessary to monitor its environmental effect in Paschim Bardhaman district. Major urban centres of the district were developed beside Grand Trunk Road. The establishment of Railway lines, the availability of mineral ore, and the abundance of minerals in the surrounding areas have all contributed significantly to the expansion of IISCO at Burnpur, making Asansol a significant urban hub in the Paschim Bardhaman district. The southwest portion of the study area has seen development of yet another major urban sprawl. Additionally, because of the lower land prices and the desire to avoid the extreme land pressure in the core region, individuals are more inclined to choose the periphery.21,22 Asansol-Durgapur industrial region primarily focuses on these two growth centres.23 Expansions of both cities led towards formation of second metropolis within the West Bengal. Both the centres have already influenced their immediate sub-urban hinterland towards urban transformation.24 According to Census of India report (1971-2011), the urban population increased by 115.15%, and in 2001-2011 increased by about 30%, and the rural population declined by 8.12%. Due to the availability of huge mineral resources, this district emerged as a major industrial hub in eastern India. In a single district, 10378 registered industries are recorded which occupied near about 36 km2 of land.25 After 2001, approximately 70% of new opencast mines are opened, it has enormous impact on air quality, temperature, and agriculture.26,27
Unplanned urban growth, rapid increase of opencast mining, and industries are influenced on climate change. The average surface temperature increases by about 3°C from 1993-2018.28 The forest and agricultural regions are gradually replaced by built-up areas because of exploring new mines, industries, expansion of settlements between 1993 and 2015, built-up area increased significantly from 9.01% to 19.94%, industries 2.01% to 4.52%, and coal mining area 0.89% to 1.43%. Between 1993 and 2015, there was a notable decline in both dense vegetation (from 6.90% to 4.74%) and dispersed vegetation (from 43.23% to 28.37%). In the Asansol Durgapur region, 42.32% of the total land area under various land use categories remains unchanged, while 57% of the land area is transferred from one land use category to another. The majority of land use conversions across different land use categories include dispersed vegetation. The conversion of dispersed vegetation to agricultural land has occurred in around 13.18% of the region, with settlement accounting of 8.26%, industry area of 1.77%, and coal mining areas of 0.39%.29 Agricultural production has been declining due to unfavourable weather conditions are forcing people to alter their line of work.30 Over the past two decades, the performance of the industrial and service sectors has outperformed that the agricultural sector. However, the percentage of the workforce employed in agriculture does not decrease in pace with its share of the gross domestic product. Past studies stated that India still 52% of the workforce depends on agriculture while compared to the year 1990-91 (61%).31 Therefore, this study will help to show the relationship between LULC and Surface Temperature, as well as it examined the growth of mining, industrial and urban concentration of the Paschim Bardhaman district. This study aims to identify the main reasons behind the extreme change of land surface temperature over the past three decades and landuse changes within the study area. The dynamic characteristics of the land use, particularly the gradual increase of coal mines and heavy industries are augmenting the temperature of the region. Previously, only compressed built-up areas experienced high LST and temperature, but in this study observed that agricultural land, barren land, and mining dominated areas experienced high LST.
The study area
Paschim Bardhaman district is a mainly urbanised and industrialised area in West Bengal. In 2016, it was formed as a 23rd district of West Bengal State before it was part of Bardhaman district. The district lies between 23°25´ to 23°40´N and 86°40´ to 87° 30´E, which comprises an about 1610.17 km2 (Figure 1). Paschim Bardhaman is situated in western part of West Bengal which is popularly known as ‘Rarh Banga’. The district shares boundaries with Birbhum in north, Bankura and Purulia in south, Purba Bardhaman in east and Jharkhand state in west. Paschim Bardhaman district is naturally bounded by Ajay and Damodar Rivers in the north and southern parts and Barakar river and Maithan dams are located in the western parts. Currently, Paschim Bardhaman has a population of 2,882,031 (as per the 2011 census). The Paschim Bardhaman district consists of two subdivisions, Asansol and Durgapur. Asansol and Durgapur Municipal Corporations have excellent job opportunities since foster growing industrial areas in India. Durgapur is 2nd planned city in India after Chandigarh. Therefore, there is an immense opportunity to grow the city faster with urban infrastructure. The municipal corporation has two potential markets: Hutton Road in Asansol and Benachiti in Durgapur. The Central Business District (CBD) has a well-developed transportation network, connecting north to southern India with Railway lines, GT roads and NHs. The linear settlements are situated along Railway lines and National Highway-2. The climate of Paschim Bardhaman district is recorded as extreme temperature in summer, moderate to heavy rainfall in monsoon and dry weather in winter. The mean temp. of Paschim Bardhaman district is 32.5°C. The day-time temperature reached its maximum in May (37.4°C), but night temperature was recorded as high from June to September (25.6°C).32 Geologically, the Chota Nagpur plateau dominates in the west, and an eastern boundary is made up of young and older alluvium plains and it was located in a transition zone between the western plateau and the eastern alluvial plains.
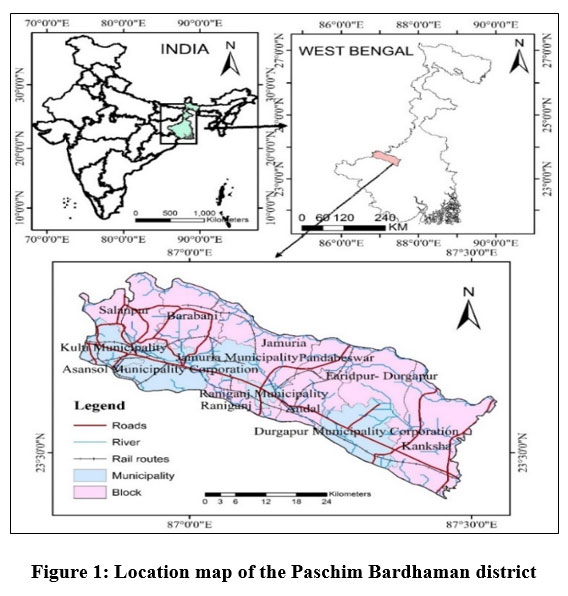 | Figure 1: Location map of the Paschim Bardhaman district
|
Dataset
Base map of the area was prepared from topographical sheets (1975) was downloaded from Survey of India. Landsat 4-5 (TM), 8-9 OLI-TIRS (Resolution- 30 M) images of 1991 to 2011 and 2021 are downloaded from USGS Earth Explorer and Google Earth to assess LULC and LST.
Table 1: Sources of Topographic Sheets and Satellite Images
Data | Image | Date | Spatial Resolution | Source |
Topographic Sheets | Sheet No. | 1975 | 1: 50000 | Survey of India |
Satellite Images | Landsat 4-5 (TM) | 11.04.1991 08.11.1991 28.03.2001 20.11.2001 20.04.2011 12.11.2011 | 30 M | USGS Earth Explorer |
Landsat- 8 (OLI) | 31.03.2021 23.11.2021 | 30 M | ||
Google Earth Images | Landsat and Copernicus Satellite | 1991, 2001, 2011, 2021 | 1: 1000000 | Google Earth Pro |
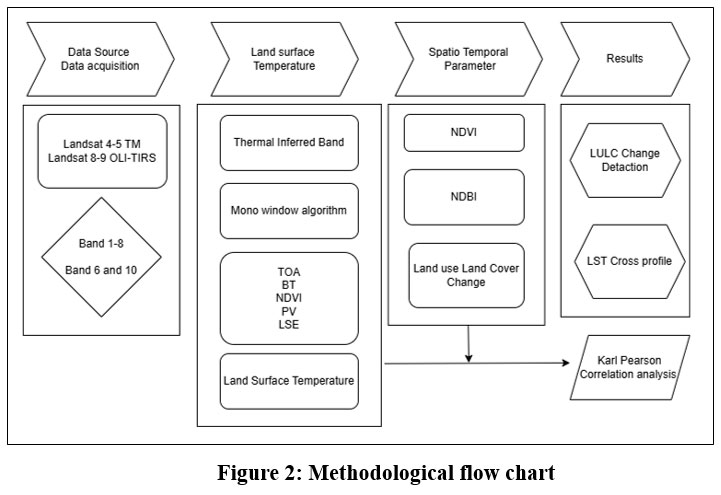 | Figure 2: Methodological flow chart
|
Methods
The methods are (i) LST, (ii) Normalised Difference Built-up Index (NDBI), and (iii) LULC.
The LST data were extracted from Landsat images from 1991 to 2021 for summer and winter season followed these steps are Top of Atmosphere (ToA), Brightness Temperature (BT), Normalized Difference Vegetation Index (NDVI), Proportion of vegetation (Pv), and Land Surface Emissivity (LSE).
Step 1. Top of Atmosphere (ToA)
Capture solar energy utilizing Landsat 4-5 (TM), 8 OLI/TIRS of years 1991, 2001, 2011 and 2021 are converted to ToA.33,34
![]()
Lh= Spectral Radiance, QCAL= Quantized cali. pixel (DN value), LMAXh= Radi. Max Band to QCALMAX, LMINh= Radi. Min Band to QCALMIN, QCALMAX= Maximum quantized calibrated, QCALMIN= Min. Maxi. quantized calibration.
![]()
Where, Lh= Spectral radiance (TOA), ML= Radiance multiplicative Band, AL= Radiance Add band, Qcal= Quantized and calibrated standard product pixel values (DN) of thermal band.
Step 2. Brightness Temperature (BT)
The band radiance generated from the equations was converted to BT from the top of the atmosphere (ToA).
The conversion equation is written below.7
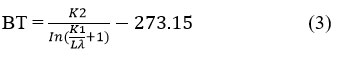
Where, BT = Brightness Temp. (°C), Lh= ToA Spectral Radiance, K1 and K2= constant.
Step 3. NDVI
The reflectance of red and near-infrared bands is helped to generate NDVI. It was used to distinguish between vegetation and non-vegetation.35,36

Where, In OLI/ TIRS NIR= band 5, RED= band 4, and NIR= band 4, RED= band 3 in TM.
esults of NDVI equation vary between -1 and +1. Where a positive number represents a patch of vegetation and a negative value represents a water body or a barren land.
Step 4. Vegetation proportion (Pv)
Vegetation covers to estimate from maximum and minimum NDVI values.23
![]()
Where, Pv= Vegetation, NDVI= DN value from NDVI, NDVI min = Minimum NDVI, NDVI max = Maximum NDVI.
Step 5: LSE
The mean emissivity of the earth’s surface is known as land surface emissivity (LSE). It is gathered using an algorithm from the proportion of vegetation and related adjustment variables.29
![]()
Where E= Emissivity, Pv= Vegetation proportion, 0.004 and 0.986 corresponds to a correction value of the equation.
Step 6: LST
LST is an important for estimating climate change and global warming. It has an impact on the environment.33 After completion above steps, LST can be retrieved following steps using the formula
![]()
Here, BT = Brightness temp. (°C), h = Wavelength emitted radiance, E = Emissivity.
NDBI
NDBI is a prominent tool for quantifying built-up land in urban areas. The Short Wave Infrared (SWIR) is reflected by built-up regions and bare soil, and SWIR and NIR have been utilized to calculate NDBI.37
![]()
Where in Landsat 4-5 TM SWIR represents band 5 and NIR represents band 4, in Landsat 8 OLI/TIRS SWIR and NIR represent band 6 & 5 respectively.
The results of the NDBI equation vary between -1 and +1, where a positive value shows a patch of built-up area, and barren land and a negative value represents a water body or dense vegetation areas.
Land use land cover
Atmospherically and geometrically corrected bands for the Thematic Mapper (Landsat-5), Enhanced Thematic Mapper + (ETM) & Operational Land Image (Landsat-8) are retrieved for the years 1991, 2001, 2011 & 2021. The detection of spatio-temporal variation of LULC changes worked out based on Landsat- 4, 5, & 8 with applications of supervised and unsupervised classification using Maximum Likelihood Algorithm and k- means method using the software QGIS 3.6.18 and ArcGIS 10.8 for the years. A maximum of 200 training samples were taken to identify the built-up areas.
Results
Seasonal Variation of LST (1991 to 2021)
Thermal bands of Landsat 4 & 5 TM and 8 OLI images of 1991, 2001, 2011 and 2021 used to extract the max. and min. temperature data to find the difference between summer and winter LST values.38,39 The highest and lowest summer LST of 1991, 2001, 2011 & 2021 were 38.34°C, 39.15°C, 45.72°C, and 45.91°C, and 21.65°C, 20.74°C, 25.69°C, & 26.01°C respectively showing in Figure 3(a). The maximum and minimum summer LST rises to 5.57°C and 4.36°C from 1991 to 2021. In summer, LST values are shown higher in barren lands, current fallow agricultural land, and coal mines region than in the core area of the city. In winter maximum LST values were 33.15°C, 35.34°C, 37.01°C, and 40.11°C, and minimum 21.65°C, 22.11°C, 24.36°C, and 23.71°C in the years 1991, 2001, 2011, and 2021 (Figure 3(b)). In 2021, the maximum LST increased by 6.96°C with compared to 1991. A significant difference found in the minimum LST in between 1991 and 2021, indicating that overall temperature was raised. The summer temperatures quickly rise in 1991, the highest summer temperature was noticed that 38.34°C, it has climbed by 7.57°C by 2021. In winter, maximum temperature was recorded at 33.15°C in 1991, which climbed by 6.96°C in 2021 and in winter lowest temperature also increased by 2.06°C. Finally, it is alarming extremely increases of lowest and highest temperatures. The LST is greater in densely populated urban areas with low levels of greenery and a high concentration of commercial and residential buildings. LST is also exacerbated by the heavy traffic and specific emissions in the railway stations (Asansol, Andal, Raniganj, Durgapur) and bus stands (BNR more, Asansol bus stand, Durgapur city centre). Additionally, urban surfaces emit less long-wave radiation at night, heat is trapped inside urban clusters, raising the temperature of the urban areas relatively the surrounding rural areas.9
Figure 3: (a) LST (Summer), (b) LST (Winter) of Paschim Bardhaman district
|
NDVI (1991 to 2021)
The results of the NDVI equation vary between -1 and +1, where a positive number represents vegetation and a negative value represents a water body or a barren land. The eastern side shows highest concentration of vegetation appeared since the NDVI value positive (0.6417) was recorded in 1991. In the year 2001, a low NDVI score of (0 -0.4509) was recorded in Sonpur-Bazari, Churulia since these areas occurred coal mining, Asansol, Durgapur, and Andal are urban centres and barren land mainly exposed along with river bed, and open old mining cast showing in Figure 4(a). The northeastern part of the study area had the highest NDVI value throughout the duration due to the existence of healthy vegetation.52
NDBI (1991 to 2021)
Maximum NDBI value steadily rising from 1991 to 2021. In 1991-2021, the mining area, built-up area, and barren terrain had shown high NDBI values of 0.48, 0.58, 0.64, and 0.71, respectively. The NDBI value was low in the vegetated and water body areas. The NDBI value of Maithan dam is expected to be high in 2021 because of owing sedimentation. The central part of the region has the highest NDBI value over time due to presence of largest coal mines in the area which are Sonpur-Bazari and Jambad coal mines while the eastern part has the lowest shown in Figure 4(b).
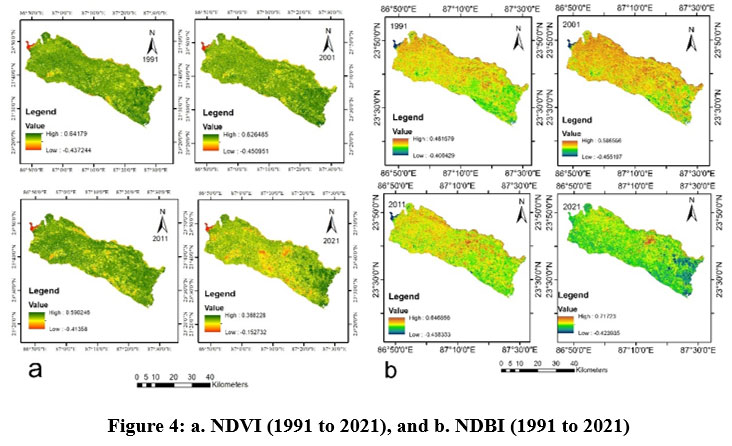 | Figure 4: a. NDVI (1991 to 2021), & b. NDBI (1991 to 2021)
|
Correlation between LST to NDBI & NDVI
A basic linear regression model has been used to calculate a substantial association between LST to NDVI and NDBI. The model justifies that LULC, NDBI, and NDVI had an impact on the LST. LST has been chosen as the dependent variable in the regression model whereas NDBI and NDVI functions as independent variables. There is a significant relationship between LST and NDBI based on R2 values of 0.36, 0.59, 0.53, and 0.44 of 1991, 2001, 2011, & 2021 (Figure 5 a-d). It is evident from the relationship that a densely populated area has a significant impact on LST. The main reason to increase LST trend is that the district has coal mining open and underground, the presence of iron and steel plants, thermal power plants, and heavy engineering machinery manufacture like railway wagons and engines. A downward trend line indicates that vegetation cover decreased and consequently temperature increased. The LST and NDVI have a negative correlation, R2 value for the years 1991 to 2021 are 0.10, 0.05, 0.2, 0.08 (Figure 5 e-g).
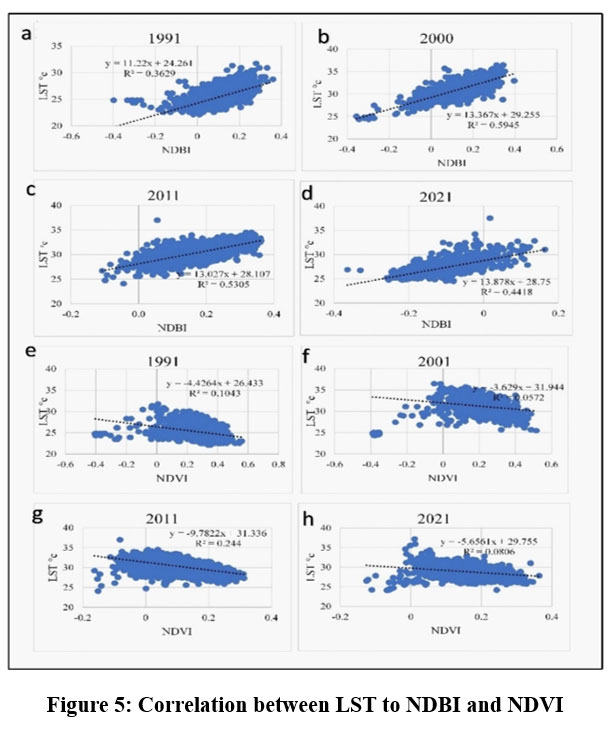 | Figure 5: Correlation between LST to NDBI and NDVI
|
LULC (1991 to 2021)
The LULC map has been categorized into 7 classes, namely vegetation cover, built-up area, agricultural field, mining area, industries, water body and barren land. The vegetation cover has significantly decreased from 477.43 Km2 (29.6%) in 1991 to 136.98 Km2 in 2021, and settlement areas have continuously increased, reaching 527.18 Km2 (32.7%) in 2021. This suggests that urbanization and population growth are on the rise. Between 2001 and 2021, the amount of agricultural land decreased steadily from 752.75 Km2 to 676.80 km2 (42.0%). In 2021, the total area used for mining operations had grown to 66.12 km². It has a potential impact on the natural landscape. Due to mining dumping and landfill the water bodies area has fluctuated, with a noticeable decrease from 43.1 Km2 in 1991 to 31.51 Km2 in 2021. Industrial areas have shown a general upward trend, reaching 93.98 Km2 in 2021, reflecting an expansion of industrial activities over the years. Barren land has experienced fluctuations, with a notable decrease from 106.84 Km2 in 2011 to 78.10 Km2 in 2021 (Table 2). The disparities in vegetation and settlement patterns underscore the trade-off between urban expansion and environmental preservation. The shrinking waterbodies, along with a rise in mining regions shows that there may be an environmental impact on water bodies.40,53 On the opposite side, a previous open-cast mining pit was covered with water, however, those water bodies are not fit for human consumption. Despite agricultural changes, the reduction in barren land may reflect successful land management or reclamation activities. Barren terrain, including river sand bars, is likewise changing over time. The initiation taken by ECL, SAIL, and IISCO plants are also taking steps to plant trees along roadsides and at old mining dumps.24
Table 2: Temporal variation of LULC (1991 to 2021)
LULC class | 1991 | 2001 | 2011 | 2021 | |||||
Area (sq.km) | Area (%) | Area (sq.km) | Area (%) | Area (sq.km) | Area (%) | Area (sq. km) | Area (%) | ||
Vegetation | 477.43 | 29.6 | 355.12 | 22 | 320.16 | 19.8 | 136.98 | 8.5 | |
Built-up area | 232.94 | 14.4 | 291.89 | 18.1 | 323.73 | 20 | 527.18 | 32.7 | |
Agricultural land | 700.77 | 43.5 | 752.75 | 46.7 | 728.07 | 45.2 | 676.801 | 42 | |
Mining area | 35.65 | 2.2 | 40.59 | 2.5 | 45.1 | 2.7 | 66.12 | 4.1 | |
Industrial area | 32.62 | 2.02 | 35.32 | 2.1 | 55.07 | 3.4 | 93.98 | 5.8 | |
Water bodies | 43.1 | 2.6 | 34.54 | 2.1 | 31.73 | 1.9 | 31.51 | 1.9 | |
Barren land | 88.21 | 5.4 | 100.49 | 6.2 | 106.84 | 6.6 | 78.1 | 4.8 | |
Table 3: Decadal Variation of LULC changes (1991 to 2021)
Decade | Vegetation | Built-up | Agricultural | Mining | Industrial area (%) | Water bodies (%) | Barren land (%) |
1991-2001 | -25.62 | 25.31 | 7.42 | 13.86 | 8.28 | -19.86 | 13.92 |
2001-2011 | -9.84 | 10.91 | -3.28 | 11.11 | 55.92 | -8.14 | 6.32 |
2011-2021 | -57.21 | 62.85 | -7.04 | 46.62 | 70.66 | -0.69 | -26.89 |
Between 1991 and 2001, there was a considerable decline of vegetation of 25.62%, indicating a large loss of natural green cover; water bodies also decreased by 19.86%. Built-up, mining areas, barren land, and industrial areas increased by 25.31%, 13.92%, 13.86% and 8.28%, respectively (Table 3). In 2001-2011, maximum growth was observed in an industrial area, which was 55.92%, followed by mines at 11.11% and the built-up area at 10.91%. Vegetation, water bodies, and agricultural land decreased by 9.84%, 8.14% and 3.28%, respectively. A significant decline of 57.21% in vegetation occurred from 2011 to 2021, showing a faster loss of vegetation in the recent decade. A rise of 62.85% implies that urban areas have increased rapidly in the recent decade. Industrial area expanded from 8.28% to 70.66% in 1991 to 2021. The decline trend of 19.86% between 1991 and 2001 indicates a considerable loss of water bodies over the period. Between 2001 and 2011, there was an additional 8.14% loss, showing that water bodies are continuing to shrink. A reduction of 0.69% from 2011 to 2021 suggests persistent issues in water resource management. Maithan Dam occupies a huge, steady volume of water in this region, whereas small ponds from ancient mining casts alter with period. The rivers Ajay and Damodar play an important role in providing fresh water to industrial areas. The river channel is primarily influenced by its ever-changing course, sand deposition, and illegal sand mining operations. During 1991 to 2001, 13.92% increase indicates that land has been transformed into barren land (Figure 6). A smaller increase of 6.32% from 2001 to 2011, showing a slower pace of land becoming barren. From 2011 to 2021, agricultural land decreased significantly by 51.27 km2 (Table 3, Figure 6), showing the possibility of land reclamation activities or changes in land usage. The substantial loss of plant cover and water bodies suggests that environmental issues, such as deforestation and water resource depletion are on the horizon.
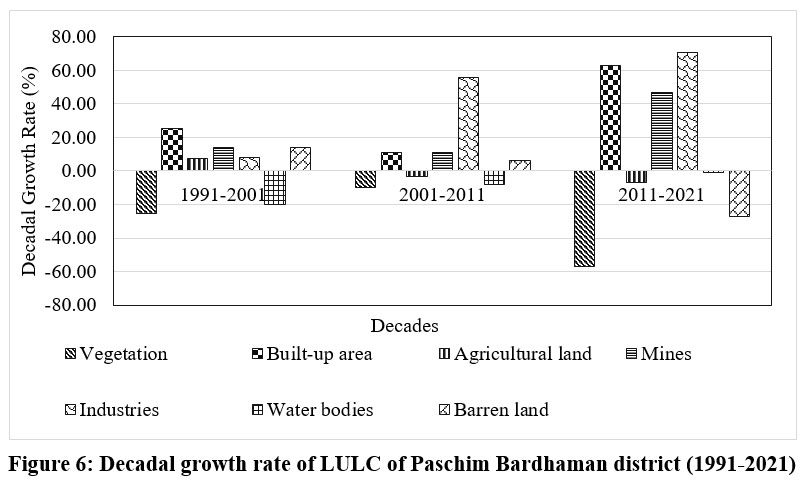 | Figure 6: Decadal growth rate of LULC of Paschim Bardhaman district (1991-2021)
|
Detection of LULC (1991-2021)
Rapid urbanization is cause of significant rise in built-up and industrial areas, emphasising the importance of sustainable urban strategy. Agricultural land use changes have an impact on production and land sustainability.41,42 Mining expansion implies increasing exploitation of natural resources, which may trigger many environmental effects. The dynamic changes in land cover over three decades, with major patterns in urbanization, industrialization, and natural ecosystem disturbances.43 These changes have serious consequences for environmental sustainability and land management, highlighting the importance of balanced and sustainable development strategies.44
LULC detection has been workedout by conversion matrix45 using QGIS software from 1991 to 2021. Between 1991 and 2021, the 800 km2 area remained constant. The most amount of land changed from vegetation to built-up area is 214 km2, accounting for 13.3% of total land, followed by agricultural land converted into built-up area at 7.4%. From 1991 to 2021, more than 20% of land was turned into built-up areas from vegetation and agricultural areas. Another notable land transition was from vegetation to agricultural land (6.9%) and barren land to agricultural land (2.2%). From 1991 to 2021 2.2% of land was shifted from vegetative cover to industrial area, whereas 1.7% of agricultural land was heavily utilized for mining operations (Table 4, Figure 7-8).
Table 4: Detection of LULC as per conversion matrix (1991 to 2021)
LULC classes | Vegetation cover (Km2) | Built-up (Km2) | Agricultural land (Km2) | Mining area (Km2) | Industrial area (Km2) | Water bodies (Km2) | Barren land (Km2) | Total area (Km2) 1991 |
Vegetation (Km2) | 96.94 | 214.20 | 110.68 | 11.67 | 34.68 | 0.92 | 8.35 | 477.43 |
Built-up (Km2) | 4.42 | 160.53 | 23.38 | 10.59 | 15.65 | 0.26 | 18.12 | 232.95 |
Agricultural land (Km2) | 14.33 | 118.81 | 490.76 | 27.28 | 24.74 | 0.98 | 23.90 | 700.78 |
Mining area (Km2) | 3.92 | 8.09 | 3.62 | 5.39 | 0.03 | 3.96 | 10.68 | 35.69 |
Industrial area (Km2) | 4.09 | 7.58 | 3.56 | 1.35 | 13.97 | 0.64 | 1.43 | 32.63 |
Water bodies | 0.19 | 4.63 | 10.13 | 1.68 | 2.48 | 20.42 | 3.49 | 43.02 |
Barren land (Km2) | 13.11 | 13.35 | 34.68 | 8.16 | 2.43 | 4.35 | 12.14 | 88.21 |
Total area (Km2) 2021 | 136.99 | 527.19 | 676.80 | 66.13 | 93.98 | 31.51 | 78.11 | 1610.71 |
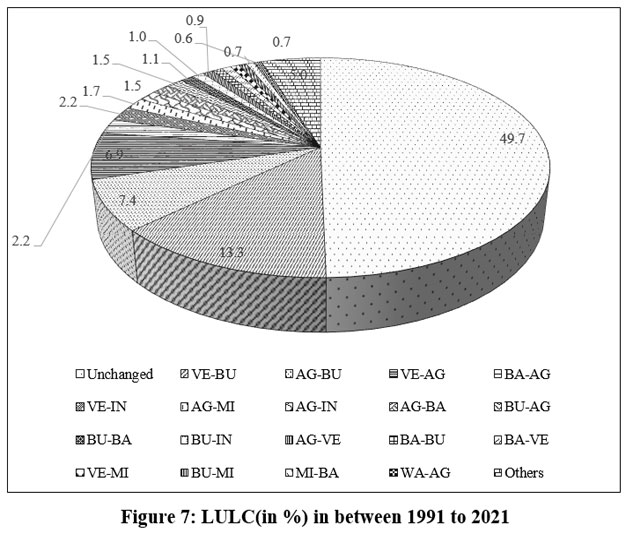 | Figure 7: LULC(in %) in between 1991 to 2021
|
VE- Vegetation cover, BU- Built-up, AG- Agricultural land, MI- Mines,
IN- Industries, WA- Water Body, BA- Barren land
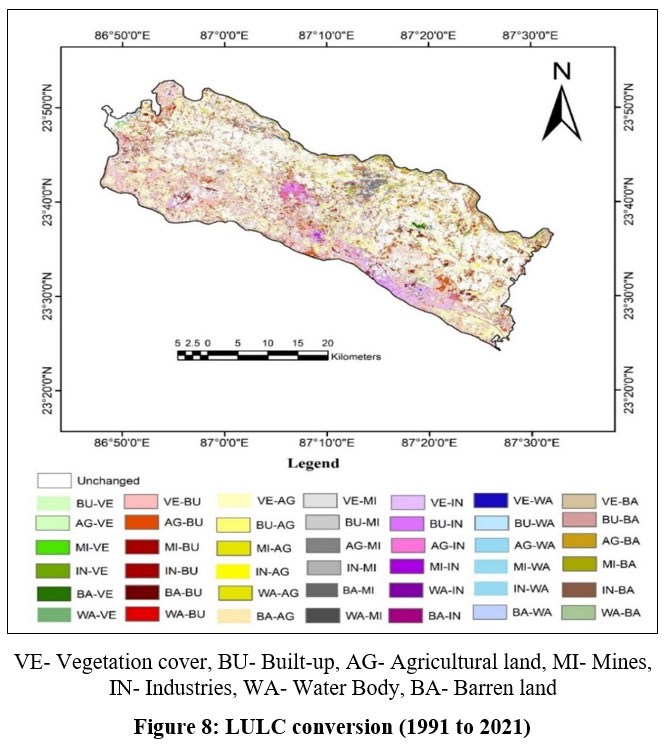 | Figure 8: LULC conversion (1991 to 2021)
|
Impact of LULC on LST (1991-2021)
Statistical approaches and graphical composition are used to demonstrate an association between LULC and LST, which were retrieved for the years 1991, 2001, 2011, and 2021. The results reveal that the regional distribution of land surface temperature has altered between 1991 to 2021. The high temperature was consistent with the urbanization and spread of mining and industrial areas depicted in the picture. It is possible that growth in mining, industrial, and urban areas corresponds to an increase in LST. Similarly, the vegetated region has low levels of LST. At the micro level, the climate has altered, with LULC units having changed.7,46 The correlation between LULC and LST.47,48, three vertical cross-section lines and one horizontal line were created (Figure 9). The horizontal line (A-B) connected the western and eastern halves of the area. The vertical lines C-D, E-F, and G-H depict the western, central, and eastern regions respectively. The study region has its distinct features. The C-D cross section is characterized by mines, barren land, agricultural land, industry, and urban areas. The E-F line runs through the region's main open-cast coal mines and industrial settlement area. The G-H cross-section line passes through a forested land region and an urban industrial sector. It was discovered that areas with densely vegetated areas and water bodies had lower LST (26°C), whereas high LST is found in mines in the northern half of the area (37°C). The cross-sectional line E-F of the LST was substantially higher in the centre part, overall temperature was high in mines and built-up areas, while the highest temperature was recorded in the industrial region.
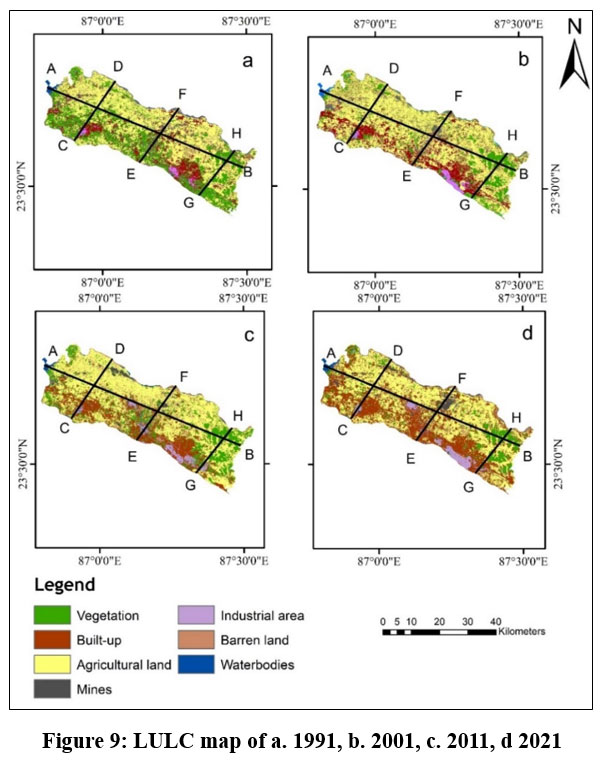 | Figure 9: LULC map of a. 1991, b. 2001, c. 2011, d 2021
|
Discussion
In 1991, there was a large portion of vegetation cover and agricultural land, but by 2021, the region was covered by mining operations, and the southern portion of the territory was transformed into a densely built-up and industrial area. Over 70% of the territory has been changed from vegetation and agricultural land to built-up, industrial, and mining areas. In 1991, the easternmost cross-sectional line (G-H) study was conducted through densely vegetated areas and agricultural land, and temperatures ranged from 26.96°C to 28.72°C (Figure 10). Vegetation coverage was decreased in the northern part, and increased settlement and industrial areas, but temperatures increased throughout the years. According to the A-B horizontal cross-section, the middle portion shows a high surface temperature. Higher soil moisture has higher heat capacity than the dry soil. The low temperature was recorded near the water surface (Maithan Dam), whereas the greatest temperature was found in industrial areas and their surroundings. Temperatures gradually decrease towards the eastern part due to the presence of dense vegetation (Figure 9 & 10).
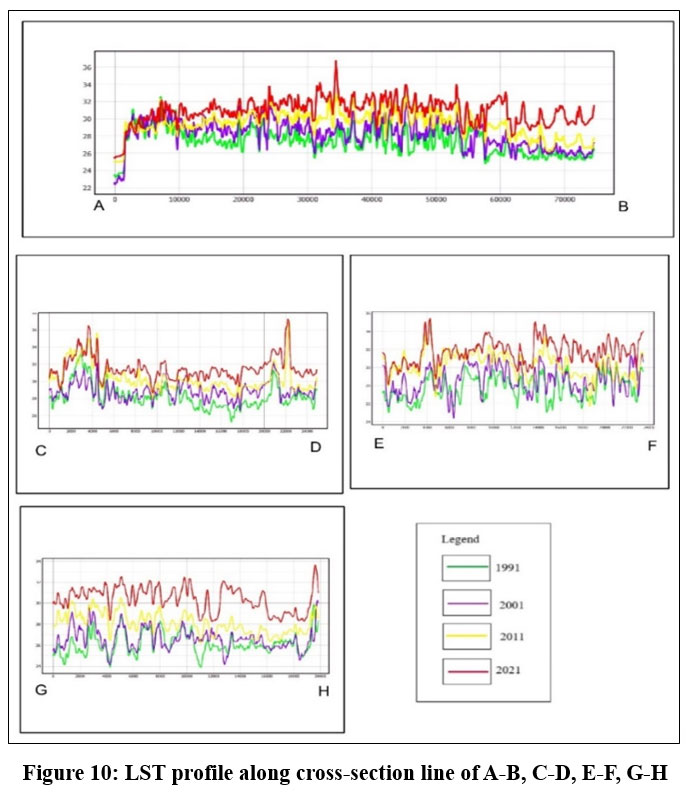 | Figure 10: LST profile along cross-section line of A-B, C-D, E-F, G-H
|
Correlation between various LULC and LST
From past studies, it was found that the linear regression model is an easily and widely used model for understanding the relationship between LULC and LST.29,43 The rapid growth of population and built-up, industrial and mining area Paschim Bardhaman caused a drastic change in LULC pattern.49,50 The interrelation between the different LULC types and mean LST51 for 30 years. As vegetation area decreased, settlement and mining area increased from 1991 to 2021, the LST also increased proportionally. The mean LST of vegetation area enhanced 26.96°C to 30°C in between 1991-2021. Vegetation area negatively correlates with LST (R2 value= 0.82). The mean surface temperature of the residential area improved from 27.40 °C - 31.39 °C. Over time, the maximum mean temperature (28.34°C, 29.65°C, 31.12°C, 32.30°C) (Table 5) was observed in the mining areas. Where built-up, mining and industrial areas have a strongly positive correlation with LST (R2 value 0.08, 0.98, 0.90 respectively) (Figure 11). Water bodies, agricultural land, and barren land also have a negative correlation with LST. This study will help to monitor the temperature anomaly and heat flux of specific land surfaces in response to the dynamic land use of Paschim Bardhaman. This type of research work will help to formulate micro climatic modelling for sustainable planning and eco-friendly development of mining and heavy industrial area.
Table 5: LULC and LST distribution from 1991 to 2021
LULC Types | 1991 | 2001 | 2011 | 2021 | ||||
Area | Avg. LST (°C) | Area | Avg. LST | Area (sq. km) | Avg. LST | Area | Avg. LST | |
Vegetation cover | 477.43 | 26.96 | 355.12 | 27.05 | 320.16 | 28.81 | 136.98 | 30 |
Built-up area | 232.94 | 27.4 | 291.89 | 27.63 | 323.73 | 29.72 | 527.18 | 31.39 |
Agricultural land | 700.77 | 27.29 | 752.75 | 28.39 | 728.07 | 29.53 | 676.8 | 31.03 |
Mines | 35.65 | 28.34 | 40.59 | 29.65 | 45.1 | 31.12 | 66.12 | 32.3 |
Industrial area | 32.62 | 27.5 | 35.32 | 28.42 | 55.07 | 30.35 | 93.98 | 31.38 |
Water | 43.1 | 25.46 | 34.54 | 26.47 | 31.73 | 27.43 | 31.51 | 28.23 |
Barren land | 88.21 | 28.72 | 100.49 | 29.05 | 106.84 | 30.35 | 78.1 | 32.19 |
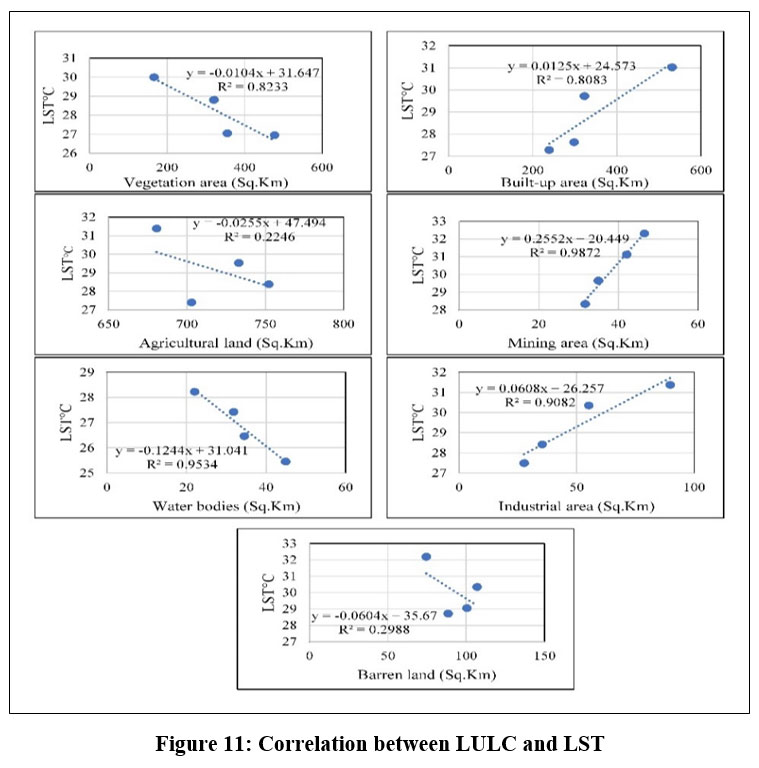 | Figure 11: Correlation between LULC and LST
|
Conclusion
The growing population in Paschim Bardhaman district has a significant impact on land transformation. The growth of built-up areas indicates rapid urbanization, as well as the expansion of industries and mining which could bring challenges to sustainable development. To estimate the impact of LULC variations on LST used Landsat imageries from 1991 to 2021. Vegetation areas and agricultural lands are rapidly shifting into coal mines (6.9%) and built-up (7.4%). The growth of mining areas highlights that the economy of Paschim Bardhaman highly dependent on natural resource extraction, and it’s brings challenges to environmental safeguards. Over the past three decades, the built-up and industrial areas have grown rapidly, while the amount of vegetation cover and water bodies has decreased. It shows strong positive relationship between the built-up, industrial, and mining areas with LST. As a result, in 1991-01, 2001-11, and 2011-21, the mean LST increased by 0.69°C, 4.85°C, 2.22°C in the summer season and 0.87°C, 1.26°C, 1.94°C in winter respectively. The mean LST of vegetation area improved from 26.96°C to 30°C and mean surface temperature of built-up area increased from 27.40°C to 31.39°C from 1991-21. The growing trend of LST leads to the urban heat island phenomenon of Andal, Asansol, and Durgapur due to urbanisation, the rapid growth of industrial and the expansion of mining. Salanpur and Churulia, although have low urban-industrial areas due to proximity of coal mines, these areas experience high LST.
Acknowledgement
I would like to extend my gratitude for the Junior research fellowship provided by the University Grand Commission.
Funding Sources
The research is funded by UGC-JRF. Grant no. 210510209185
Conflict of Interest
The author(s) declares no conflict of interest.
Data Availability Statement
The manuscript incorporates all datasets produced or examined throughout this research study.
Ethics Statement
This research did not involve human participants, animal subjects, or any material that requires ethical approval.
Informed Consent Statement
This study did not involve human participants, and therefore, informed consent was not required.
Author Contributions
Moumita Hati, Debasis Das and Manika Mallick wrote the fundamental frameworks, methods datasets and interpretation of results.
Moumita Hati, Kaushik Panja, Vajana Mondal Deepa Rai, Atoshi Chakma contributed to the mapping and layout all the figures, and diagrams.
Professor Y.V. Krishnaiah provided valuable instruction to frame the work and field expertise in these works. All the authors contributed to the interpretation and reviewed the manuscript.
References
- Lambin E. F., Turner B. L., Geist H. J.et al.The causes of land-use and land-cover change: moving beyond the myths. Global Environmental Change. 2001;11(4):261-269. doi:10.1016/s0959-3780(01)00007.
CrossRef - Showqi I., Rashid I., Romshoo S. A. Land use land cover dynamics as a function of changing demography and hydrology. GeoJournal. 2014;79(3):297-307. doi:10.1007/s10708-013-9494-x.
CrossRef - Bora R., Krishnaiah Y. V. Spatial distribution of land use concentration and land-use efficiency of the Kakodonga river basin, Assam. National Geographical Journal of India. 2021;67(3): 282-293. https://doi.org/10.48008/ngji.1777 Retrieved from https://ngji.in/index.php/home/article/view/292
CrossRef - Lin B. B., Philpott S. M., Jha S. The future of urban agriculture and biodiversity-ecosystem services: Challenges and next steps. Basic Applied Ecology. 2015;16(3):189-201. doi:10.1016/j.baae.2015.01.005.
CrossRef - Richards D. R., Belcher R. N. Global changes in urban vegetation cover. Remote Sensing. 2019;12(1):23. doi:10.3390/rs12010023
CrossRef - Tan J., Zheng Y., Tang X., Guo C., Li L., Song G., & Chen H. The urban heat island and its impact on heat waves and human health in Shanghai. International journal of biometeorology. 2010;54(1):75-84. doi:10.1007/s00484-009-0256-x
CrossRef - Karakus C. B. The impact of land use/land cover (LULC) changes on land surface temperature in Sivas city centre and its surroundings and assessment of urban heat island. Asia-Pacific Journal of Atmospheric Sciences. 2019;55(4):669-684. doi:10.1007/s13143-019-00109-w.
CrossRef - Zhang Y., Odeh IOA., Ramadan E. Assessment of land surface temperature in relation to landscape metrics and fractional vegetation cover in an urban/peri-urban region using Landsat data. International Journal of Remote Sensing. 2013;34(1):168-189. doi:10.1080/01431161.2012.71222.
CrossRef - Pandey K. Monitoring and spatio-temporal analysis of UHI effect for Mansa district of Punjab, India. Advances in environmental research. 2020;9(1):19-39. doi:10.12989/aer.2020.9.1.019.
- Oke TR. City size and the urban heat island. Atmospheric Environment. 1973;7(8):769-779. doi:10.1016/0004-6981(73)90140-6
CrossRef - Montvez JP., Rodrguez A., Jimnez JI. A study of the Urban Heat Island of Granada. International Journal of Climatology. 2000;20(8):899-911. doi:10.1002/1097-0088(20000630)20:8<899::aid-joc433>3.0.co;2-i
CrossRef - Peron F., Maria MM., Spinazzè F., Mazzali U. An analysis of the urban heat island of Venice mainland. Sustain Cities Society. 2015;19:300-309. doi:10.1016/j.scs.2015.05.008
CrossRef - Mohan M., Kikegawa Y., Gurjar B. R., Bhati S., Kolli NR. Assessment of urban heat island effect for different land use–land cover from micrometeorological measurements and remote sensing data for megacity Delhi. Theoretical and Applied Climatology. 2013;112(3-4):647-658. doi:10.1007/s00704-012-0758-z
CrossRef - Oke TR. The distinction between canopy and boundary?layer urban heat islands. Atmosphere. 1976;14(4):268-277. doi:10.1080/00046973.1976.9648422.
CrossRef - Oke TR. The heat island of the urban boundary layer: Characteristics, causes and effects. In: Wind Climate in Cities. 1995:81-107. doi:10.1007/978-94-017-3686-2_5
CrossRef - Jauregui E., Godinez L., Cruz F. Aspects of heat-island development in Guadalajara, Mexico. Atmos Environ. 1992;26(3):391-396. doi:10.1016/0957-1272(92)90014-j
CrossRef - Nichol J. E. A GIS-based approach to microclimate monitoring in Singapore’s high-rise housing estates. Photogrammetric Engineering & Remote Sensing. 1994;60:1225-1232.
- Kikon N., Singh P., Singh SK., Vyas A. Assessment of urban heat islands (UHI) of Noida City, India using multi-temporal satellite data. Sustain Cities Society. 2016;22:19-28. doi:10.1016/j.scs.2016.01.005.
CrossRef - Morini E., Castellani B., Presciutti A. Experimental analysis of the effect of geometry and façade materials on urban district’s equivalent albedo. Sustainability. 2017;9(7):1245. doi:10.3390/su9071245
CrossRef - Mohan M., Singh V. K., Bhati S., Lodhi N., Sati A. P., Sahoo N. R., Dey S. Industrial heat island: a case study of Angul-Talcher region in India. Theor Applied Climatology. 2020;141(1-2):229-246. doi:10.1007/s00704-020-03181-9
CrossRef - Maity B., Mallick SK., Rudra S. Spatiotemporal dynamics of urban landscape in Asansol municipal corporation, West Bengal, India: a geospatial analysis. GeoJournal. 2022;87(3):1619-1637. doi:10.1007/s10708-020-10315-z
CrossRef - Karaca M., Tayanç M., Toros H. Effects of urbanization on climate of ?stanbul and Ankara. Atmos Environ. 1995;29(23):3411-3421. doi:10.1016/1352-2310(95)00085-d
CrossRef - Gupta K., Dey A., Mondal B. Geoinformatics Based Techniques for the Study of Spatialization of Urban Heat Island and Micro-Climatic Region in Asansol Durgapur Development Authority, West Bengal. Geo-Environmental Issues of the New Millennium-Sustainable Planning Perspective. Dey’s Publishing; 2019.
- Asansol Durgapur Development Authority 2015, http://addaonline.in/adda-at-a-glance.
- District Industrial profile (2017-2018), http://www.msmedikolkata.gov.in/uploads/2021/03/districtprofiles/2017-18/PASCHIM%20BARDHAMAN.pdf
- Patra T., Dutta D., Kundu A., Kumar M., Hossain SS., Chattoraj K. K. Evolution of opencast mines in the Raniganj coalfield (India): An assessment through multi-temporal satellite data. J Geol Soc India. 2022;98(3):387-394. doi:10.1007/s12594-022-1990-5
CrossRef - Koshal AK. Environmental Problems Analysis of Coal Mining in Raniganj & Asansol Blocks (West Bengal) Using Remote Sensing and GIS. GIS Development. Map World Forum. Published online 2002.
- Chatterjee S., Gupta K. Exploring the spatial pattern of urban heat island formation in relation to land transformation: A study on a mining industrial region of West Bengal, India. Remote Sens Appl Soc Environ. 2021;23:100581. doi:10.1016/j.rsase.2021.100581
CrossRef - Choudhury D., Das K., Das A. Assessment of land use land cover changes and its impact on variations of land surface temperature in Asansol-Durgapur Development Region. Egypt Journal of Remote Sensing Space Science. 2019;22(2):203-218. doi:10.1016/j.ejrs.2018.05.004.
CrossRef - Kandrika S., Dwivedi RS. Assessment of the impact of mining on agricultural land using erosion-deposition model and space borne multispectral data. Journal of Spatial Hydrology. 2003;3(2):1-17.
- Ghorai D., Ziauddin G., Sarkar S., Singh M. S., Chatterjee J., Ghatak S., Sinha G., Ghosh P. Comprehensive District Agriculture Plan, Paschim Bardhaman for 2017-18 to 2019-20. Krishi Vigyan Kendra Burdwan; 1920.
- Climate of West Bengal (2008). http://imdpune.gov.in.
- Guha S., Govil H., Dey A., Gill N. Analytical study of land surface temperature with NDVI and NDBI using Landsat 8 OLI and TIRS data in Florence and Naples city, Italy. Eur J Remote Sens. 2018; 51(1):667-678. doi:10.1080/22797254.2018.1474494
CrossRef - Hamed Fahmy. A., Amin. A M., El-Fiky G. Investigating land use land cover changes and their effects on land surface temperature and urban heat islands in Sharqiyah Governorate, Egypt. Egypt J Remote Sens Space Sci. 2023;26(2):293-306. doi:10.1016/j.ejrs.2023.04.001
CrossRef - Chan CK., Yao X. Air pollution in mega cities in China. Atmos Environ. 2008;42(1):1-42. doi:10.1016/j.atmosenv.2007.09.003
CrossRef - El-Hattab M., Amany., Lamia. Monitoring and assessment of urban heat islands over the Southern region of Cairo Governorate, Egypt. Egypt J Remote Sens Space Sci. 2018;21(3):311-323. doi:10.1016/j.ejrs.2017.08.008
CrossRef - Rashid N., Alam JAMM., Chowdhury MA., Islam SLU. Impact of landuse change and urbanization on urban heat island effect in Narayanganj city, Bangladesh: A remote sensing-based estimation. Environmental Challenges. 2022;8(100571):100571. doi:10.1016/j.envc.2022.100571.
CrossRef - Ramachandra T. V., Kumar U. Greater Bangalore: emerging urban heat island. GIS Development. 2010; 14 (1): 86–104.
- Sultana S., Satyanarayana ANV. Impact of urbanisation on urban heat island intensity during summer and winter over Indian metropolitan cities. Environ Monit Assess. 2020;19:789. doi:10.1007/s10661-019-7692-9.
CrossRef - Mishra PP., Pujari AK. Impact of mining on agricultural productivity. S Asia Econ J. 2008;9(2):337-350. doi:10.1177/139156140800900204.
CrossRef - Mallick M., Krishnaiah Y.V. Spatio-temporal detection of land use land cover changes in Jalpaiguri district; Geospatial analysis. Int J Sci Research. 2023;12(12):1945-1953. DOI: https://dx.doi.org/10.21275/SR231227231047,
CrossRef - Mallick M., Krishnaiah Y. V., Panja K., Das D., Rai D., Hati M., & Chakma A. Land suitability assessment for tea cultivation in Jalpaiguri district of West Bengal, India, using AHP and DEMATEL techniques. Environment, Development and Sustainability. 2024; 1-39. https://doi.org/10.1007/s10668-024-05711-1.
CrossRef - Das N., Mondal P., Sutradhar S., Ghosh R. Assessment of variation of land use/land cover and its impact on land surface temperature of Asansol subdivision. Egypt J Remote Sens Space Sci. 2021;24(1):131-149. doi:10.1016/j.ejrs.2020.05.001.
CrossRef - Gupta R. K. Green Space Cooling to Mitigate the Surface Urban Heat Island Effect in India's Metropolises. Current World Environment.2024;19(2): 679-691.
CrossRef - Krishnaiah Y. V. Land capability of the Papagni river basin, Andhra Pradesh, using remote sensing technique. Transactions of the Institute of Indian Geographers. 2011; 33(1):113-122.
- https://www.researchgate.net/publication/290578449_Land_capability_of_the_Papagni_river_basin_Andhra_Pradesh_using_remote_sensing_technique#fullTextFileContent
- Krishnaiah Y. V. Landuse Pattern and Landuse Efficiency of the Papagni river basin, India. The Indian Journal of Spatial Science.2013; 4(1): 59-68.
- https://www.researchgate.net/publication/299368862_Landuse_Pattern_and_Landuse_Efficiency of_the_Papagni_River_Basin_India#fullTextFileContent
- Siddique G., Roy A., Mandal M. H., Ghosh S., Basak A., Singh M., Mukherjee N. An assessment on the changing status of urban green space in Asansol city, West Bengal. GeoJournal. 2022;87(2):1299-1321. doi:10.1007/s10708-020-10312-2.
CrossRef - Panja K., Krishnaiah Y. V., Chakma A., Mallick M., Rai D., Hati M., Das D. Impact of Rubber Plantation Growth on LULC Changes in Eastern-Himalayan Region of West Tripura District Using Geospatial Approach. International Journal of Ecology and Environmental Sciences. 2023; 49(5): 533-548. DOI:10.55863/ijees.2023.2852
CrossRef - Patel S., Indraganti M., Jawarneh R. N. A comprehensive systematic review: Impact of Land Use/Land Cover (LULC) on Land Surface Temperatures (LST) and outdoor thermal comfort. Building and Environment. 2024; 249: 111130.
CrossRef - Abdullah S., Barua D., Abdullah S. M. A., Rabby Y. W. Investigating the impact of land use/land cover change on present and future land surface temperature (LST) of Chittagong, Bangladesh. Earth Systems and Environment. 2022; 6(1): 221-235.
CrossRef - Chatterjee S., Das S., Gupta K. Exploring the Spatial Pattern of Urban Heat Island Formation in Relation to Land Transformation: A Study on the Paschim Barddhaman District of West Bengal. In Advances in Urbanism, Smart Cities, and Sustainability.2022; 19-37.
CrossRef - Mallick, M., Krishnaiah, Y.V., Panja, K. et al. Assessment of the Soil Erosion Susceptibility Zones in Tea Plantation Areas of Jalpaiguri District, India: An Integrated Approach of RUSLE and WLC Model. J Indian Soc Remote Sens (2025). https://doi.org/10.1007/s12524-024-02078-8
CrossRef - Panja, K., Y.V. Krishnaiah, D. Das, M. Mallick, M. Hati, D. Rai, A. Chakma. An application of AHP technique for groundwater potential zones in West Tripura district, Tripura, India: A case study, Indian Journal of Soil Conservation. 2024: 52(2), 160-171 DOI: 10.59797/ijsc.v52.i2.170.


