Impact of Coal Mining on the Tzuong River System of Mokokchung, Nagaland
Khruvo Vadeo
 , C. Nokendangba Chang
and Temsulemba Walling
*
, C. Nokendangba Chang
and Temsulemba Walling
*
1
Department of Geology,
Nagaland University,
Kohima,
Nagaland
India
http://dx.doi.org/10.12944/CWE.18.1.19
Copy the following to cite this article:
Vadeo K, Chang C. N, Walling T. Impact of Coal Mining on the Tzuong River System of Mokokchung, Nagaland. Curr World Environ 2023;18(1). DOI:http://dx.doi.org/10.12944/CWE.18.1.19
Copy the following to cite this URL:
Vadeo K, Chang C. N, Walling T. Impact of Coal Mining on the Tzuong River System of Mokokchung, Nagaland. Curr World Environ 2023;18(1).
Download article (pdf)
Citation Manager
Publish History

Introduction
Coal mining contributes significantly to a country's economic development, although it greatly impacts human health and the environment. A vast area of farmland, mountains, and forests are cleared to make way for coal mines which is of great concern. The long-term and continuous mining of coal can have serious impact on the natural environment, including contamination of the soil, land subsidence, and deterioration of stream ecosystems.1-3 Furthermore, the disposal of waste materials from the coal mines interacts with nearby water bodies, which has an irreversible impact on the aquatic and terrestrial environment.4
The mining of coal is often accompanied by the generation of huge quantities of dust and loose materials generated during the excavation of overburden and the mineral. The severity of the effects of coal mining is mainly influenced by factors such as the area’s geology, and composition of overburden and minerals in the coal, mining type, the scale of mining operations, rainfall, etc.5-9 The waste material mainly in the form of overburden, that is removed before the extraction of coal usually contains many toxic chemicals and pollutants such as heavy metals. This leaches out specially during the rains and pollutes the surrounding area.10 One major cause of water contamination is the generation of acid from the oxidation of sulphur-bearing minerals like pyrite in coal mines.11,12 Acid mine drainage (AMD) results due to the reaction of Pyrites with water and air, forming sulphuric acid and some dissolved iron. The resulting contamination from AMDs lowers the pH of the affected water bodies leading to acidity, which in turn facilitates the leaching of toxic metals into the water.13,14
Nagaland forms part of the mobile morpho-tectonic unit of the Indian Plate that collided with the Burma Plate.15 Based on the morpho-tectonic element, Nagaland can be classified into four distinctive units from west to east, i.e., Belt of Schuppen (BoS), Inner Fold Belt (IFB), Naga Hills Ophiolite, and the Naga Metamorphics.16-18 All of these major structures have NE-SW trends. The study area is a part of the BoS, a zone of imbricate thrusts sheets characterized by discrete litho-tectonic blocks.19-21 The BoS, bounded by Naga Thrust on the northwest and by the Disang Thrust on the southeast,22 covers an area of ~4500 sq km and has a length of ~300 km.23 Sediments in this belt range from Eocene to Oligocene and Plio-Pleistocene, comprising Barail, Surma, Tipam Groups, Namsang, and Dihing formations.
Coals in Nagaland are of sub-bituminous rank deposited under the influence of the marine environment.24 A similar depositional environment has been revealed in the study of Singh et al., (2012)25 from the Tiru valley coalfield. Within the BoS, tertiary coal occurs associated with the Tikak Parbat formation of the Barail Group, which is composed of fine to medium-grain sandstone with minor intercalations of shales.
Extensive coal mining in and around the Changkikong range of Mokokchung has irreparably changed the landscape and highly degraded the water bodies. The deterioration in the quality of water and soil because of activities related to coal mining in the Mokokchung region of Nagaland was stressed by workers such as Tiakaba (2016),26 Semy and Singh (2019, 2021a, 2021b),27-29 and Semy et al., (2022).30 The purpose of the study is to determine the ramification of coal mining on the Tzuong River and its tributaries. It involves the analysis of physicochemical properties and evaluation of the Water Quality Index (WQI) of samples collected from Tzuong River and its tributaries. The use of WQI for this study is to assess whether the water quality in the Tzuong River system is affected by coal mining.
Study Area
Area considered for investigation has been taken up from the Changkikong valley of Mokokchung district, Nagaland. It is part of Survey of India (SOI) topographic map No. 83/J7 and lies between the latitude 26°28'18.321" N and 26°24'31.308"N and longitude of 94°24'18.291"E and 94°19'19.254"E, with a coverage of about 21 sq. km (Fig. 1). The preferred method of coal mining is rat-hole mining; however, open cast mining is also becoming quite popular in the recent years (Fig. 2a, b). Coal mining is primarily seasonal, and mining activities are undertaken during the month of October to April before the onset of the Indian Monsoon. The majority of the mining activities are managed and controlled by individual landowners. Coal mining is assumed to be more lucrative, and the appeal of making monetary income quickly has led to a decline in the age-old traditional practice of agriculture and farming as a source of livelihood in the area. The contamination of the irrigation water source from mines and degradation of cultivable land into wasteland areas are also responsible for the weaning away from such agrarian occupation (Fig. 2c). Tzuong river (Fig. 2d) which originates from Mangkolemba town as the Tsujenyong river, flows in the NE-SW direction and eventually drains as 4th order stream into Tsurong river in the neighbouring district of Wokha.
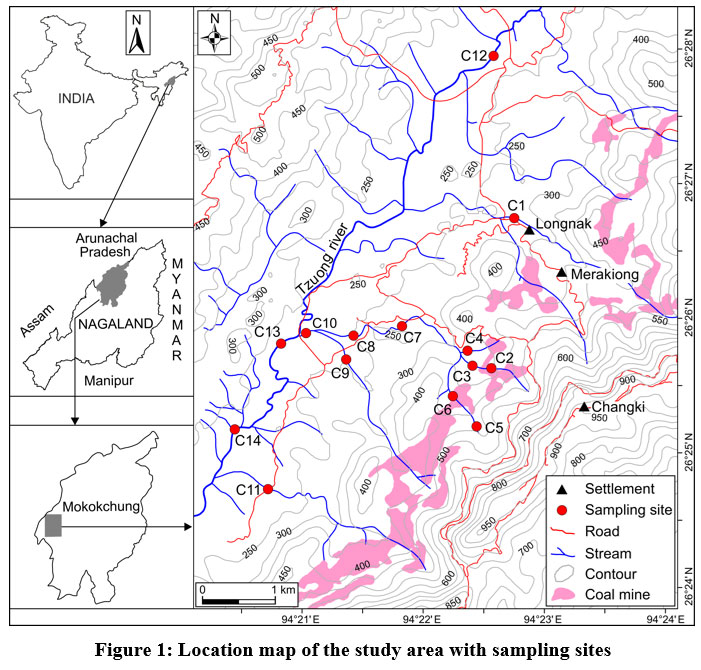 | Figure 1: Location map of the study area with sampling sites.
|
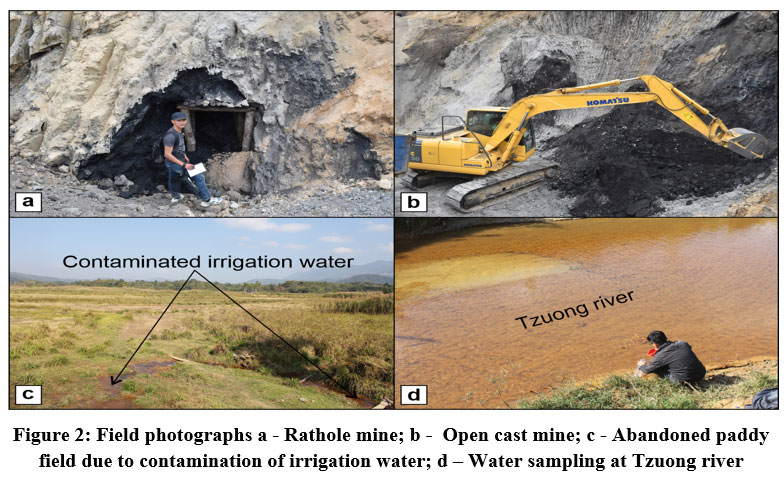 | Figure 2: Field photographs a - Rathole mine; b - Open cast mine; c - Abandoned paddy field due to contamination of irrigation water; d – Water sampling at Tzuong river
|
Methodology
To assess the implications of coal mining on the water regime in the Changkikong valley of Mokokchung, water has been sampled from the Tzuong river and its adjoining tributaries. The tributaries that flow into the Tzuong river mostly have 2nd and 3rd-order streams. The research methodology is given as a flowchart (Fig 3). Altogether 14 water samples were collected to analyze pH (Potential of Hydrogen), Total Dissolved Solids (TDS), nitrate, total hardness, magnesium hardness, calcium hardness, iron, and copper. Samples were collected in 2 L polypropylene bottles, and tagged with a unique identification number and each sampling site marked by GPS (Global Positioning System).
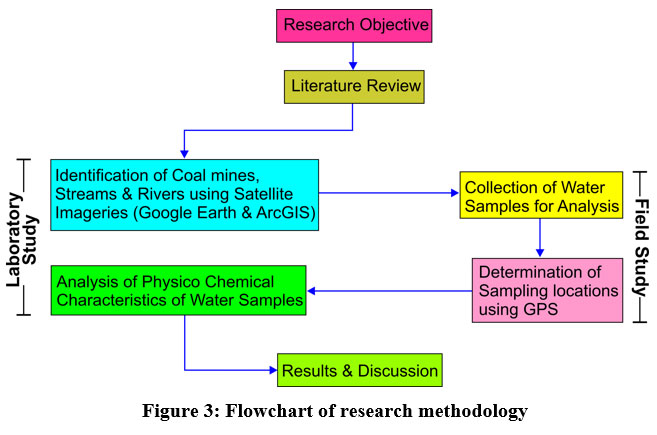 | Figure 3: Flowchart of research methodology.
|
Analysis of pH (Potential of Hydrogen) was done with a digital pH meter (EcoTestr pH1, Eutech Instruments) at the sampling site, while research for TDS was done using the gravimetric method according to Bureau of Indian Standards (BIS) 3025 (1984).31 Total hardness, magnesium hardness, and calcium hardness were analyzed using the titrimetric EDTA (ethylenediamine tetra acetic acid) method according to BIS 3025 (2009, 1991, 1994).32-34 Nitrate, iron, and copper analysis were done with Spectroquant Pharo 300, Merck KGaA, Germany, using the test kit.
WQI was calculated to estimate the status of water using the physicochemical parameters of the samples. Here, the general quality of the water during a specific location or time is expressed by a single number by incorporating several quality parameters of water. This ensures that the data sourced from various parameters of water is reduced into a value that is logical and simplified. 29,35-37. The method, Weighted Arithmetic Index (WAI) 38 was employed to determine WQI following:
.jpg)
Here, Qn = Quality rating of nth water quality parameter, Wn = Unit weight of the nth water.
Qn is determined using equation,
Qn=100 [(Vn-Vi)/(Vs-Vi)]
Here, Vn = real amount of the nth parameter present,
Vi = ideal parameter value [Vi = 0, except for pH (Vi = 7)],
Vs = standard permissible value39 for nth water.
Wn (Unit weight) is derived using the equation,
Wn=k/Vs
where, k is the proportionality constant and is derived by following
.jpg)
where E= 1/Vs (pH) + 1/Vs (TDS) + 1/Vs(total hardness) + 1/Vs (calcium hardness) + 1/Vs(magnesium hardness) + 1/Vs (nitrate) + 1/Vs(iron) + 1/Vs (copper). The BIS standard for drinking water category, as well as weightage accorded to each of the physicochemical parameter, are used for calculating the WQI, as shown in Table 1, while the range of the WQI and its status are shown in Table 2.
Table 1: BIS Standard and the Unit weight of different parameters to determine WQI
| Parameter (mg/L) | BIS standard (Vs) | Unit weight (Wn) |
| pH (0.00-14) | 6.5-8.5 | 0.0050005 |
| TDS | 500 | 0.0000850 |
| Total hardness as CaCO3 | 200 | 0.0002125 |
| Calcium Hardness | 75 | 0.0005667 |
| Magnesium Hardness | 30 | 0.0014168 |
| Nitrate | 45 | 0.0009445 |
| Iron | 0. 3 | 0.1416820 |
| Copper | 0. 05 | 0.8500919 |
Table 2: Water quality index range and status of water sample40
| WQI range | WQS |
| 0.00-25.00 | Excellent |
| 26.00- 50.00 | Good |
| 51.00- 75.00 | Poor |
| 76.00- 100.00 | Very poor |
| Above 100 | Unsuitable for drinking |
Results and discussion
Physicochemical parameters
Table 3 shows the physicochemical properties of all the samples tested. pH is a very important criterion for evaluating water quality as it affects the behaviour of metals in the environment.41,42 The pH level of the water samples ranges between 2.7-5.7, which exceeds the limit of permissibility according to the BIS standard (Table 1). The sample collected at sampling site C10 with a pH of 2.7 is the most acidic.Total dissolved solids (TDS), which is the measure of dissolved ionic concentrations, ranged between 32.1-587 mg/L, where 587 mg/L (highest value) was recorded at C10. As per BIS standard, samples collected at sites C10 and C11 exceeded the permissible limit with values of 587 and 525 mg/L, respectively. Contamination from AMD where oxidation of pyrite (FeS2) into dissolved iron, sulfate, and hydrogen has led to increased acidity and total dissolved solids of the water.43-45
Table 3: Physicochemical characteristics of the water samples
Sampling site | pH | TDS | Total Hardness | Calcium Hardness | Magnesium Hardness | Nitrate | Iron | Copper |
mg/L | ||||||||
C1 | 3 | 336 | 68 | 40 | 6.83 | 0.7 | 3.14 | 0.02 |
C2 | 3.2 | 276 | 36 | 24 | 2.92 | 0.8 | 2.74 | 0.08 |
C3 | 3 | 429 | 68 | 32 | 8.79 | 1.6 | 3.72 | 0.02 |
C4 | 3.5 | 32.1 | 88 | 56 | 7.81 | 0.7 | 1.73 | 0.03 |
C5 | 5.7 | 38 | 72 | 12 | 14.64 | 0.6 | 0.27 | 0.01 |
C6 | 3.3 | 202 | 108 | 20 | 23.91 | 0.8 | 3.17 | 0.08 |
C7 | 2.9 | 411 | 52 | 32 | 4.89 | 0.7 | 2.86 | 0.02 |
C8 | 3 | 416 | 80 | 56 | 5.86 | 0.5 | 4.77 | 0.03 |
C9 | 3.7 | 119 | 72 | 48 | 5.86 | 0.8 | 4.58 | 0.04 |
C10 | 2.7 | 587 | 80 | 52 | 6.83 | 0.5 | 4.22 | 0.05 |
C11 | 2.9 | 525 | 152 | 56 | 23.42 | 1.7 | 4.74 | 0.04 |
C12 | 3.3 | 166 | 184 | 44 | 34.16 | 0.6 | 0.8 | 0.09 |
C13 | 3.1 | 271 | 92 | 44 | 11.71 | 0.6 | 3.39 | 0.06 |
C14 | 3.2 | 238 | 96 | 48 | 11.71 | 0.8 | 1.65 | 0.05 |
The total hardness in all the sampling sites is found to be in the permissible limit of BIS standard and ranges from 36-184 mg/L. The concentration of calcium hardness ranges from 12-56 mg/l. Calcium values of all the water samples are found to be within the BIS permissible limit. Magnesium hardness range from 2.92-34.16 mg/L. The sample collected at site C12 has the highest magnesium value of 34.16 mg/L exceeded the BIS permissible limit, while the rest fell within the permissible limit.
The amount of nitrate in all the samples is found to be low and occurred within BIS permissible limit with values ranging from 0.5-1.7 mg/L. Nitrogen in soil and bedrock is released as nitrate in the presence of air and water during the excavation process and mining.46 Low nitrate levels in the samples may be attributed to a lower level of nitrogen in the soils and bedrocks of the study area. Similar results were reported by Semy and Singh (2019, 2021a, 2021b).27-29
The concentration of iron ranges from 0.27-4.77 mg/L. The sample collected at site C8 has the highest concentration of iron at 4.77 mg/L. All the samples, with the exception of site C5 (0.27 mg/L), have a high iron concentration that exceeds the BIS permissible limit. Concentration of copper in the samples varied between 0.02-0.09 mg/L. The samples at site C2, C6, C12, and C13 with a copper concentration of 0.08, 0.08, 0.09, and 0.06 mg/L respectively, occurs beyond the BIS permissible limit while the remaining samples lie within the permitted limit. Pyrite (FeS2) and Chalcopyrite (CuFeS2), which are released during coal mining operations, are accountable for the high iron and copper in the samples.44, 47, 48
Water Quality Index analysis
The highest Wn value of 0.85 assigned to copper followed by iron at 0.14 (Table 1) suggests their significance in impacting the result of WQI. The observed value for each physicochemical parameter of all the sample areas and their WQI values is shown in Tables 4, 5, 6, 7, and 8. From the WQI scores, iron and copper were found to have the highest influence among all other parameters considered for the study.
Table 4: Calculation of WQI for sites C1, C2, and C3
Parameters | C1 | C2 | C3 | ||||||
Vn | Qn | WnQn | Vn | Qn | WnQn | Vn | Qn | WnQn | |
pH | 3 | -266.667 | -1.33348 | 3.2 | -253.333 | -1.2668 | 3 | -266.667 | -1.33348 |
Total dissolved solids | 336 | 67.2 | 0.005713 | 276 | 55.2 | 0.004693 | 429 | 85.8 | 0.007294 |
Total Hardness | 68 | 34 | 0.007226 | 36 | 18 | 0.003825 | 68 | 34 | 0.007226 |
Calcium Hardness | 40 | 53.33333 | 0.030225 | 24 | 32 | 0.018135 | 32 | 42.66667 | 0.02418 |
Magnesium Hardness | 6.83 | 22.76667 | 0.032256 | 2.92 | 9.733333 | 0.01379 | 8.79 | 29.3 | 0.041513 |
Nitrate | 0.7 | 1.555556 | 0.001469 | 0.8 | 1.777778 | 0.001679 | 1.6 | 3.555556 | 0.003358 |
Iron | 3.14 | 1046.667 | 148.2938 | 2.74 | 913.3333 | 129.4029 | 3.72 | 1240 | 175.6857 |
Copper | 0.02 | 40 | 34.00367 | 0.08 | 160 | 136.0147 | 0.02 | 40 | 34.00367 |
?WnQn = 181.0409 | ?WnQn = 264.1929 | ?WnQn = 208.4394 | |||||||
| WQI = 181.04 | WQI = 264.19 | WQI = 208.44 | ||||||
Table 5: Calculation of WQI for sites C4, C5, and C6
Parameters | C4 | C5 | C6 | ||||||
Vn | Qn | WnQn | Vn | Qn | WnQn | Vn | Qn | WnQn | |
pH | 3.5 | -233.333 | -1.16679 | 5.7 | -86.6667 | -0.43338 | 3.3 | -246.667 | -1.23347 |
Total dissolved solids | 32.1 | 6.42 | 0.000546 | 38 | 7.6 | 0.000646 | 202 | 40.4 | 0.003434 |
Total Hardness | 88 | 44 | 0.009351 | 72 | 36 | 0.007651 | 108 | 54 | 0.011476 |
Calcium Hardness | 56 | 74.66667 | 0.042316 | 12 | 16 | 0.009068 | 20 | 26.66667 | 0.015113 |
Magnesium Hardness | 7.81 | 26.03333 | 0.036885 | 14.64 | 48.8 | 0.069141 | 23.91 | 79.7 | 0.112921 |
Nitrate | 0.7 | 1.555556 | 0.001469 | 0.6 | 1.333333 | 0.001259 | 0.8 | 1.777778 | 0.001679 |
Iron | 1.73 | 576.6667 | 81.70327 | 0.27 | 90 | 12.75138 | 3.17 | 1056.667 | 149.7106 |
Copper | 0.03 | 60 | 51.00551 | 0.01 | 20 | 17.00184 | 0.08 | 160 | 136.0147 |
?WnQn = 131.6326 | ?WnQn = 29.4076 | ?WnQn = 284.6365 | |||||||
| WQI = 131.63 | WQI = 29.41 | WQI = 284.64 | ||||||
Table 6: Calculation of WQI for sites C7, C8, and C9
Parameters | C7 | C8 | C9 | ||||||
Vn | Qn | WnQn | Vn | Qn | WnQn | Vn | Qn | WnQn | |
pH | 2.9 | -273.333 | -1.36681 | 3 | -266.667 | -1.33348 | 3.7 | -220 | -1.10012 |
Total dissolved solids | 411 | 82.2 | 0.006988 | 416 | 83.2 | 0.007073 | 119 | 23.8 | 0.002023 |
Total Hardness | 52 | 26 | 0.005526 | 80 | 40 | 0.008501 | 72 | 36 | 0.007651 |
Calcium Hardness | 32 | 42.66667 | 0.02418 | 56 | 74.66667 | 0.042316 | 48 | 64 | 0.036271 |
Magnesium Hardness | 4.89 | 16.3 | 0.023094 | 5.86 | 19.53333 | 0.027675 | 5.86 | 19.53333 | 0.027675 |
Nitrate | 0.7 | 1.555556 | 0.001469 | 0.5 | 1.111111 | 0.001049 | 0.8 | 1.777778 | 0.001679 |
Iron | 2.86 | 953.3333 | 135.0702 | 4.77 | 1590 | 225.2743 | 4.58 | 1526.667 | 216.3012 |
Copper | 0.02 | 40 | 34.00367 | 0.03 | 60 | 51.00551 | 0.04 | 80 | 68.00735 |
?WnQn = 167.7683 | ?WnQn = 275.033 | ?WnQn = 283.2817 | |||||||
| WQI = 167.77 | WQI = 275.03 | WQI = 283.28 | ||||||
Table 7: Calculation of WQI for sites C10, C11, and C12
Parameters | C10 | C11 | C12 | ||||||
Vn | Qn | WnQn | Vn | Qn | WnQn | Vn | Qn | WnQn | |
pH | 2.7 | -286.667 | -1.43349 | 2.9 | -273.333 | -1.36681 | 3.3 | -246.667 | -1.23347 |
Total dissolved solids | 587 | 117.4 | 0.00998 | 525 | 105 | 0.008926 | 166 | 33.2 | 0.002822 |
Total Hardness | 80 | 40 | 0.008501 | 152 | 76 | 0.016152 | 184 | 92 | 0.019552 |
Calcium Hardness | 52 | 69.33333 | 0.039293 | 56 | 74.66667 | 0.042316 | 44 | 58.66667 | 0.033248 |
Magnesium Hardness | 6.83 | 22.76667 | 0.032256 | 23.42 | 78.06667 | 0.110606 | 34.16 | 113.8667 | 0.161329 |
Nitrate | 0.5 | 1.111111 | 0.001049 | 1.7 | 3.777778 | 0.003568 | 0.6 | 1.333333 | 0.001259 |
Iron | 4.22 | 1406.667 | 199.2993 | 4.74 | 1580 | 223.8575 | 0.8 | 266.6667 | 37.78186 |
Copper | 0.05 | 100 | 85.00919 | 0.04 | 80 | 68.00735 | 0.09 | 180 | 153.0165 |
?WnQn = 282.9661 | ?WnQn = 290.6796 | ?WnQn = 189.7831 | |||||||
| WQI = 282.97 | WQI = 290.68 | WQI = 189.78 | ||||||
Table 8: Calculation of WQI for sites C13 and C14
| Parameters | C13 | C14 | ||||
| Vn | Qn | WnQn | Vn | Qn | WnQn | |
| pH | 3.1 | -260 | -1.30014 | 3.2 | -253.333 | -1.2668 |
| Total dissolved solids | 271 | 54.2 | 0.004607 | 238 | 47.6 | 0.004046 |
| Total Hardness | 92 | 46 | 0.009776 | 96 | 48 | 0.010201 |
| Calcium Hardness | 44 | 58.66667 | 0.033248 | 48 | 64 | 0.036271 |
| Magnesium Hardness | 11.71 | 39.03333 | 0.055303 | 11.71 | 39.03333 | 0.055303 |
| Nitrate | 0.6 | 1.333333 | 0.001259 | 0.8 | 1.777778 | 0.001679 |
| Iron | 3.39 | 1130 | 160.1006 | 1.65 | 550 | 77.92509 |
| Copper | 0.06 | 120 | 102.011 | 0.05 | 100 | 85.00919 |
| ?WnQn = 260.9157 | ?WnQn = 161.775 | |||||
| WQI = 260.92 | WQI = 161.78 | |||||
Table 9 shows the compilation of the WQI values for all the studied samples. The result indicates that the sample from site C5 having a 29.41 WQI value, is good water quality, while the other remaining samples are all categorised as Unsuitable for drinking.
The low WQI value of site C5, is due to the fact that it is located upstream and away from the influence of coal mines (Fig. 1). The sample with the highest WQI value was recorded at sampling site C11 with a score of 290.68. The high WQI value of site C11 can be attributed to the three streams that converge after passing through the coal mines.
Table 9: Summary of WQI and WQS
| Sampling site | WQI | WQS |
| C1 | 181.04 | Unsuitable for drinking purpose |
| C2 | 264.19 | Unsuitable for drinking purpose |
| C3 | 208.44 | Unsuitable for drinking purpose |
| C4 | 131.63 | Unsuitable for drinking purpose |
| C5 | 29.41 | Good water quality |
| C6 | 284.64 | Unsuitable for drinking purpose |
| C7 | 167.77 | Unsuitable for drinking purpose |
| C8 | 275.03 | Unsuitable for drinking purpose |
| C9 | 283.28 | Unsuitable for drinking purpose |
| C10 | 282.97 | Unsuitable for drinking purpose |
| C11 | 290.68 | Unsuitable for drinking purpose |
| C12 | 189.78 | Unsuitable for drinking purpose |
| C13 | 260.92 | Unsuitable for drinking purpose |
| C14 | 161.78 | Unsuitable for drinking purpose |
It is observed that the sampling site C5 with an initial WQI value of 29.41 on reaching site C6 is seen to have drastically increased to 284.64 (Fig. 4). The abrupt rise in the WQI value can be directly attributed to contamination from surface run-offs from coal mines as the stream at site C6 passes through the mining area. The stream at site C6, before reaching site C7 converges with two streams flowing from sites C2, C3, and C4 with WQI values of 264.19, 208.44, and 131.63 respectively. On reaching site C7, the WQI value is seen to have decreased immensely to 167.77. An increase in the WQI value is observed with the stream flowing downstream from C7(167.77) to C10(282.97) through C8(275.03). As the stream joins the Tzuong river downstream of site C10, the WQI value gradually starts decreasing from site C13(260.92) to site C14(161.78). The decrease in the WQI value can be attributed to the dilution of pollutants due to increased discharge in the river as a result of inflow from the less polluted/unpolluted tributaries.49
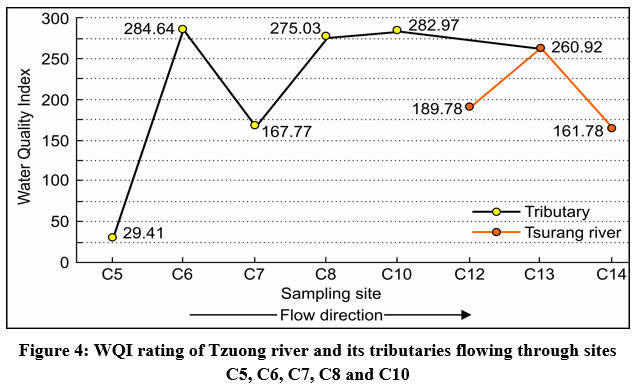 | Figure 4: WQI rating of Tzuong river and its tributaries flowing through sites C5, C6, C7, C8 and C10.
|
The upstream part of the Tzuong river (C12) with an initial high WQI value of 189.78 indicates contamination from coal mines. On reaching C13, the WQI value sharply increases to 260.92. The abrupt increase in WQI value is attributed to contamination from coal mines through its tributaries from sites C1, C2, C4, C6, and C9 (Fig. 1). From site C13(260.92) to C14(161.78) the WQI value sharply decreases which indicates dilution from unpolluted tributaries.
Conclusion
The majority of the water source in the area of study has been highly contaminated by mining activities. Effluents from coal mines in the form of AMD have greatly deteriorated the quality of water of the Tzuong river through its tributaries as evidenced by high acidity, high TDS, iron, and copper concentrations. The overall quality status of the Tzuong river and associated tributaries from WQI values indicate the water to be unsuitable for drinking with iron and copper as the dominant parameters of influence in the WQI scores. Although the pollution levels are still high with high WQI values, the water quality along the Tzuong river is observed to be gradually improving downstream due to the dilution of pollutants by inflow from unpolluted tributaries.
As the entire operation of coal mining is carried out haphazardly by the landowners/locals, with no governmental control or EIA/environmental considerations/legislations in place, there is a strong need for the creation of awareness so that proper environmental protection procedures are followed before any mining activities are initiated as well as to encourage the stakeholders to come forward and volunteer for restoration activities and where possible, minimize and reduce the negative impacts associated with coal mining and its associated activities.
Acknowledgement
The authors thank Mr. Bendangsunep Jamir and Dr. Limasanen Longkumer for their help and support during the fieldwork.
Conflict of Interest
The authors declare that they have no conflict of interest.
Funding Source
The research work is financially supported by the Council of Science and Industrial Research (CSIR), Government of India, National Eligibility Test (NET) JRF-fellowship.
References
- Grzovic M, Ghulam, A. Evaluation of land subsidence from underground coal mining using TimeSAR (SBAS and PSI) in Springfield, Illinois, USA. Nat. Hazards. 2015; 79(3): 1739-1751. DOI: 10.1007/s11069-015-1927-z
CrossRef - Chen Y, Yuan L, Xu C. Accumulation behavior of toxic elements in the soil and plant from Xinzhuangzi reclaimed mining areas, China. Environ. Earth Sci. 2017; 76(5): 1-8. DOI: 10.1007/s12665-017-6535-7
CrossRef - Giam X, Olden J. D, Simberloff D. Impact of coal mining on stream biodiversity in the US and its regulatory implications. Nat. Sustain. 2018; 1(4): 176-183. DOI: 10.1038/s41893-018-0048-6
CrossRef - Singh G. Impact of coal mining on mine water quality. Int. J. Mine Water. 1988; 7(3): 49-59. DOI: 10.1007/BF02504598
CrossRef - Obiadi I. I, Obiadi C. M, Akudinobi B. E. B, Maduewesi U. V, Ezim E. O. Effects of coal mining on the water resources in the communities hosting the Iva Valley and Okpara Coal Mines in Enugu State, Southeast Nigeria. Sustain. Water Resour. Manag. 2016; 2(3): 207-216. DOI: 10.1007/s40899-016-0061-8
CrossRef - Li Q, Wu P, Zha X, Li X, Wu L, Gu S. Effects of mining activities on evolution of water chemistry in coal-bearing aquifers in karst region of Midwestern Guizhou, China: evidences from ?13C of dissolved inorganic carbon and ?34S of sulfate. Environ. Sci. Pollut. Res. 2018; 25(18): 18038-18048. DOI: 10.1007/s11356-018-1969-3
CrossRef - Bo A, Chun Z, Kuiming L, Sitong L, Zhigang T, Haipeng L, Haoran Y. The influence of rainfall on landslide stability of an open-pit mine: the case of Haizhou open-pit mine. Geotech. Geol. Eng. 2019; 37(4): 3367-3378. DOI: 10.1007/s10706-019-00851-y
CrossRef - Chi M, Zhang D, Zhao Q, Yu W, Liang S. Determining the scale of coal mining in an ecologically fragile mining area under the constraint of water resources carrying capacity. J. Environ. Manage. 2021; 279: 111621. DOI: 10.1016/j.jenvman.2020.111621
CrossRef - Islam N, Rabha S, Subramanyam K. S. V, Saikia B. K. Geochemistry and mineralogy of coal mine overburden (waste): A study towards their environmental implications. Chemosphere. 2021; 274: 129736. DOI: 10.1016/j.chemosphere.2021.129736
CrossRef - Kamble P. H, Kumbhar J. S. An Overview of Impact of Coal Mining On Water Resources. Int. J. Sci. Res. Multidiscip. Stud. 2019; 5(12): 115-121.
- Tiwary R. K. Environmental impact of coal mining on water regime and its management. Water Air Soil Pollut. 2001; 132(1): 185-199. DOI: 10.1023/A:1012083519667
CrossRef - Acharya B. S, Kharel G. Acid mine drainage from coal mining in the United States – An overview. J. Hydrol. 2020; 588: 125061. DOI: 10.1016/j.jhydrol.2020.125061
CrossRef - RoyChowdhury A, Sarkar D, Datta R. Remediation of acid mine drainage-impacted water. Curr. Pollut. Rep. 2015; 1(3): 131-141. DOI: 10.1007/s40726-015-0011-3
CrossRef - Galhardi J. A, Bonotto D. M. Hydrogeochemical features of surface water and groundwater contaminated with acid mine drainage (AMD) in coal mining areas: a case study in southern Brazil. Environ. Sci. Pollut. Res. 2016; 23(18): 18911-18927. DOI: 10.1007/s11356-016-7077-3
CrossRef - Bhattacharjee C. C. The Ophiolites of northeast India: a subduction zone ophiolite complex of Indo-Burman Orogenic Belt. Tectonophysics. 1991; 191: 213-222.
CrossRef - Goswami D. N. D. Macerals and low temperature tar of the Tertiary coals of Assam, Meghalaya and Nagaland. Geosci. J. 1985; 6(1): 95-101.
- Mathur L. P, Evans P. Oil in India. Int. Geol. Cong. (22nd session). New Delhi; 1964.
- Directorate of Geology and Mining, Nagaland. Miscellaneous Publication, No 1; 1978.
- Ghose N. C, Agrawal O. P, Srivastava S. C. Metamorphism of the ophiolite belt of Nagaland, NE India. Proceeding National Seminar Tertiary Orogeny; 1987: 189-213.
- Nandy D. R. Geodynamics of Northeastern India and the adjoining region. ACB Publications, Dehradun; 2000.
- Geological Survey of India. Geology and Mineral resources of Manipur, Mizoram, Nagaland, and Tripura. Miscellaneous Publication, No 30, Part IV; 2011: 1 (Part-2).
- Evans P. The tectonic framework of Assam. J. Geol. Soc. India, 1964; 5: 80-96.
- Rao A. R, Samanta, M. K. Structural style of the Naga over thrust belt and its implication on exploration. Bulletin of the Oil and Natural Gas Commission. 1987; 24: 69-109.
- Rajarathnam S, Chandra D, Handique G. K. An overview of chemical properties of marine-influenced Oligocene coal from the northeastern part of the Assam-Arakan basin, India. Int. J. Coal Geol. 1996; 29(4): 337-361. DOI: 10.1016/0166-5162(95)00025-9
CrossRef - Singh P. K, Singh M. P, Singh A. K, Naik A. S. Petrographic and geochemical characterization of coals from Tiru valley, Nagaland, NE India. Energy Explor. Exploit. 2012; 30(2): 171-191. DOI: 10.1260%2F0144-5987.30.2.171
CrossRef - Tiakaba J. T. Impact of coal mining on water quality in Mangkolemba region under Mokokchung District Nagaland, India. J. Environ. Res. Dev. 2016; 10(3): 436-444.
- Semy K, Singh M. R. Assessment on the water quality of Tsurang river, Nagaland affected by coal mining drainage. Indian J. Ecol. 2019; 46(4): 845-849.
- Semy K, Singh M. R. Comparative assessment on physico-chemical properties of coal mining affected and non-affected forest soil at Changki, Nagaland. Indian J. Ecol. 2021a; 48(1): 36-42.
- Semy K, Singh M. R. Quality assessment of Tsurang river water affected by coal mining along the Tsurangkong range, Nagaland, India. Appl. Water Sci. 2021b; 11(7): 1-11. DOI: 10.1007/s13201-021-01444-y
CrossRef - Semy K, Singh M. R, Walling M, Temjen W, Jangir A, Mishra G. Qualitative soil assessment of coal mine disturbed and undisturbed tropical forest in Nagaland, India. Proceedings of the National Academy of Sciences, India Section B: Biological Sciences. 2022; 92: 275-280. DOI: 10.1007/s40011-021-01343-x
CrossRef - Bureau of Indian Standards (BIS) 3025. Methods of sampling and test (physical and chemical) for water and waste water. Part 16 Filterable residue (Total Dissolved Solids). New Delhi; 1984.
- Bureau of Indian Standards (BIS) 3025. Methods of sampling and test (physical and chemical) for water and waste water. Part 21 Hardness. New Delhi; 2009.
- Bureau of Indian Standards (BIS) 3025. Water and wastewater – method of sampling and test (physical and chemical). Part 40 Calcium. New Delhi; 1991.
- Bureau of Indian Standards (BIS) 3025. Methods of sampling and test (physical and chemical) for water and waste water. Part 46 Magnesium. New Delhi; 1994.
- Yogendra K, Puttaiah E. T. Determination of water quality index and suitability of an urban waterbody in Shimoga Town, Karnataka. In: Sengupta, M. and Dalwani, R. (Eds.), Proceedings of Taal2007: The 12th world lake conference. 2008: 342-346.
- Semiromi F. B, Hassani A. H, Torabian A, Karbassi A. R, Lotfi F. H. Water quality index development using fuzzy logic: A case study of the Karoon River of Iran. Afr. J Biotechnol. 2011; 10(50): 10125-10133. DOI: 10.5897/AJB11.1608
CrossRef - Khalaf R. M, Hassan W. H. Evaluation of irrigation water quality index IWQI for Al-Dammam confined aquifer in the west and southwest of Karbala city, Iraq. Int. J. Civ. Eng. 2013; 23: 21-34.
- Brown R. M, McClelland N. I, Deininger R. A, Tozer R. G. A water quality index – do we dare? Water Sew. Works, 1970; 117(10): 339-343.
- Bureau of Indian Standards (BIS) 10500. Drinking water - Specification (Second revision), New Delhi; 2012.
- Brown R. M, McClelland N. I, Deininger R. A, O’Connor M. F. A water quality index – crashing the psychological barrier. In: Thomas W.A. (Ed.), Indicators of Environmental Quality. Springer, Boston, MA. 1972; 1: 173-182. DOI: 10.1007/978-1-4684-2856-8_15
CrossRef - Naseema K, Masihur R, Husain K. A. Study of seasonal variation in the water quality among different ghats of river Ganga, Kanpur, India. J. Environ. Res. Dev. 2013; 8(1), 1-10.
- Mosley L. M, Liss P. S. Particle aggregation, pH changes and metal behaviour during estuarine mixing: review and integration. Mar. Freshw. Res. 2019; 71(3): 300-310. DOI: 10.1071/MF19195
CrossRef - Peppas A, Komnitsas K. A, Halikia I. Use of organic covers for acid mine drainage control. Miner. Eng. 2000; 13(5): 563-574. DOI: 10.1016/S0892-6875(00)00036-4
CrossRef - Akcil A, Koldas S. Acid Mine Drainage (AMD): causes, treatment and case studies. J. Clean. Prod. 2006; 14(12-13): 1139-1145. DOI: 10.1016/j.jclepro.2004.09.006
CrossRef - Li P, Wu J, Tian R, He S, He X, Xue C, Zhang K. Geochemistry, hydraulic connectivity and quality appraisal of multilayered groundwater in the Hongdunzi Coal Mine, Northwest China. Mine Water Environ. 2018; 37(2): 222-237. DOI: 10.1007/s10230-017-0507-8
CrossRef - Bosman C. The hidden dragon: nitrate pollution from open-pit mines–a case study from the limpopo province, South Africa. Proceedings of the International Mine Water Conference, Pretoria, South Africa, 19-23 October 2009. 2009: 849-857
- Johnson D. B. Chemical and microbiological characteristics of mineral spoils and drainage waters at abandoned coal and metal mines. Water Air Soil Pollut.: Focus. 2003; 3(1): 47-66. DOI: 10.1023/A:1022107520836
CrossRef - Rahman M, Howladar M. F, Faruque M. O. Assessment of soil quality for agricultural purposes around the Barapukuria coal mining industrial area, Bangladesh: insights from chemical and multivariate statistical analysis. Environ. Syst. Res. 2017; 6(1): 1-13. DOI: 10.1186/s40068-017-0101-x
CrossRef - Turunen K, Räsänen T, Hämäläinen E, Hämäläinen M, Pajula P, Nieminen S. P. Analysing contaminant mixing and dilution in river waters influenced by mine water discharges. Water Air Soil Pollut. 2020; 231(6): 1-15. DOI: 10.1007/s11270-020-04683-y
CrossRef


