Century of Rainfall Dynamics and Drought in Bihar: Patterns, Trends, and Climatic Variability (1901-2021)
Manu Raj Sharma1
*
 , Sukeshi Priya2
and Surbhi Kumari2
, Sukeshi Priya2
and Surbhi Kumari2
1
University Department of Geography,
Advanced Research Centre,
L N Mithila University,
Darbhanga,
Bihar
India
2
University Department of Geography,
L N Mithila University,
Darbhanga,
Bihar
India
http://dx.doi.org/10.12944/CWE.20.1.9
Copy the following to cite this article:
Sharma M. R, Priya S, Kumari S. Century of Rainfall Dynamics and Drought in Bihar: Patterns, Trends, and Climatic Variability (1901-2021). Curr World Environ 2025;20(1). DOI:http://dx.doi.org/10.12944/CWE.20.1.9
Copy the following to cite this URL:
Sharma M. R, Priya S, Kumari S. Century of Rainfall Dynamics and Drought in Bihar: Patterns, Trends, and Climatic Variability (1901-2021). Curr World Environ 2025;20(1).
Download article (pdf)
Citation Manager
Publish History

Introduction
Over the last century, global warming—primarily driven by human activities—has disrupted surface moisture levels and altered atmospheric processes, leading to significant shifts in rainfall patterns. These disturbances in the earth-atmosphere energy balance have intensified extreme weather events, causing episodic droughts, floods, and greater rainfall variability. In India, such fluctuations in annual rainfall have had far-reaching consequences for the economy, hydrology, and agriculture, particularly in multi-hazard-prone regions. A notable trend is the increasing frequency of heavy rainfall events,¹ while moderate rainfall occurrences are declining whereas regions such as south Bihar experience more frequent and prolonged dry spells.2,3 Recent studies also indicate a rise in extreme rainfall events, particularly in parts of northwest India.?
Bihar, a predominantly rainfed agricultural state, is particularly vulnerable to these changes. The shifting rainfall patterns have disrupted the hydrological cycle, affecting the reliability of monsoonal precipitation. Extensive research on Bihar’s rainfall distribution reveals significant variability, with a declining trend in annual rainfall,? especially in East Bihar. Seasonal analyses further indicate a reduction in monsoonal rainfall,? while summer and post-monsoon precipitation patterns exhibit considerable fluctuations. This variability has profound socio-economic implications, particularly in drought-prone districts, where agricultural productivity is highly sensitive to erratic rainfall.7 Studies also highlight an increase in extreme rainfall intensity, leading to localized flooding in both rural and urban areas. Notably, spatial variability in rainfall is more pronounced in central and north Bihar,? exacerbating flood risks in these regions.
The dual challenge of floods and droughts in Bihar is evident through research on extreme rainfall events and drought indices. Studies indicate a rising trend in extreme rainfall in northern Bihar, leading to recurrent flood conditions in some areas,9 while others experience droughts due to erratic monsoons. Analytical tools such as the Standardized Precipitation Index (SPI) and the Palmer Drought Severity Index (PDSI) underscore the growing threats to Bihar’s agriculture and water resources.¹? Additionally, research examining the link between changing rainfall patterns and crop yields¹¹ confirms that variations in monsoonal rainfall significantly impact staple crops like rice and wheat. In South Bihar, irregular rainfall has worsened water scarcity, further heightening agricultural risks.¹² Moreover, fluctuating precipitation patterns have reduced groundwater availability,¹³ which is crucial for sustaining agriculture during dry spells.
Addressing these climatic challenges is critical for Bihar’s future. The increasing unpredictability of rainfall continues to strain agriculture, water resources, and livelihoods. Effective strategies such as sustainable water resource management and climate-resilient agricultural practices are imperative to mitigate risks and ensure long-term economic and environmental stability in the state.
Objectives
To study the seasonal and annual rainfall distribution and trends in Bihar
To understand the variability of rainfall and assess drought occurrences.
Materials and Methods
This section discusses the study area, data sources, and methodology adopted for understanding rainfall behaviour and drought assessment in Bihar for the period 1901-2021.
Study area
Bihar is a landlocked state in eastern India, situated between latitudes 24°17'6" N to 27°30'93" N and longitudes 83°19'17" E to 88°17'47" E, with an average elevation of 150 meters. It borders Nepal to the north, and the Indian states of Uttar Pradesh, Jharkhand, and West Bengal to the west, south, and east. Bihar roughly covers 94.16 thousand square kilometres and is administered into 38 districts. The climate varies greatly, with summer temperatures reaching 43°C and winter temperatures dropping to 5°C. The state gets around 1200 mm of rain annually, mostly during the monsoon season, and is nourished by perennial rivers like the Ganga, Gandak, Ghaghara, Baghmati, and Kosi.
For this study, based on Koppen’s climate classification region is divided into 2 major types: (a) Subtropical monsoon (Cwa) and (b) Tropical Savanna (Aw) (Figure 1).
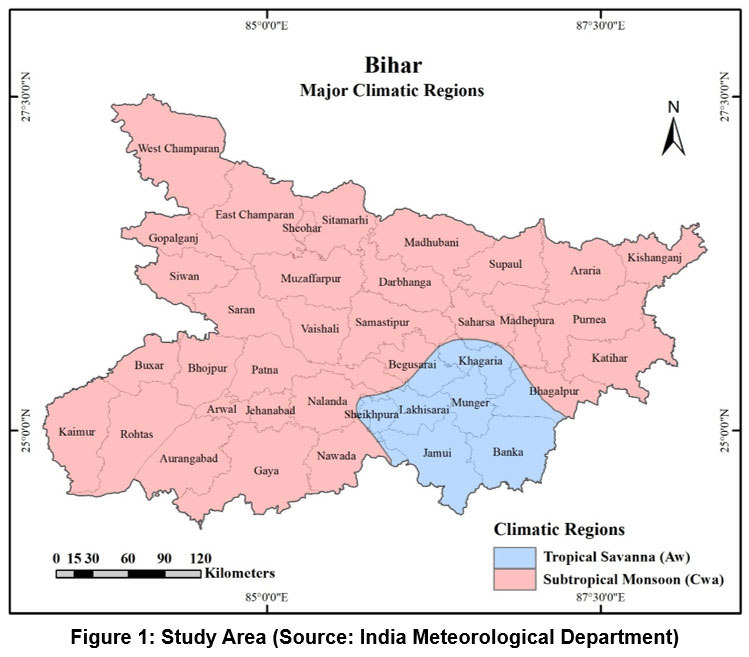 | Figure 1: Study Area (Source: India Meteorological Department)
|
Data Collection and Methodology
The study utilizes long-term monthly rainfall data (1901–2021) at the district level obtained from the India Meteorological Department (IMD) to calculate annual and seasonal precipitation. Missing data were filled using interpolation and mean values from previous years. Rainfall variability was analyzed using Standard Deviation, Range, and the coefficient of variation (CV) for meteorological stations. Trend analysis employed the Mann–Kendall test¹? and Sen’s slope estimator15 at a 95% confidence level. The MK test¹? identifies trends, while Theil and Sen’s slope estimator16 ¹? measures trend magnitude.
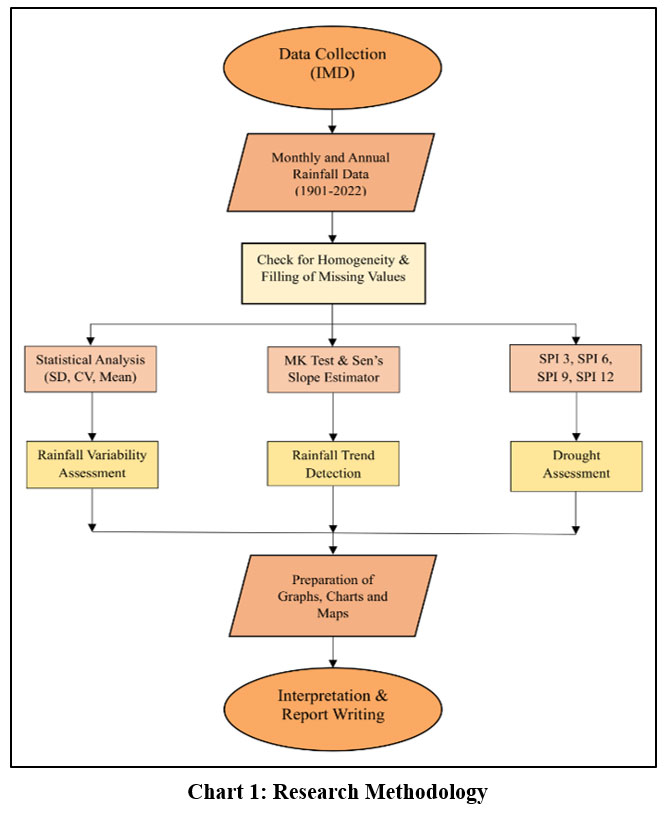 | Chart 1: Research Methodology
|
Table 1: Drought Analysis Index
S. No | Drought Intensity Class | SPI Range |
1 | Extremely Wet | SPI ? 2.0 |
2 | Severely Wet | 1.5? SPI <2.0 |
3 | Moderately Wet | 1.0 ? SPI <1.5 |
4 | Near Normal | -1 ?SPI < 1.0 |
5 | Moderately Dry | -1.5 ? SPI < -1.0 |
6 | Severely Dry | -2.0 ? SPI < -1.5 |
For drought analysis, the Standardized Precipitation Index (SPI) has been calculated for the time interval of 3, 6, 9, and 12 months for each year from 1901 to 2022. It is the most often-used indicator in the world for detecting and describing meteorological droughts.17 The value of SPI ranges between -2 to +2 (Table 1) where the negative value indicates drought-like conditions, and the positive value indicates wet conditions.18 Mapping of spatial patterns of rainfall variability and trends have been done in ArcGIS Pro environment.
Results
For the present study, rigorous statistical analysis was done at the district level to understand the distribution, trend, and variability of annual and seasonal rainfall.
Spatial Distribution of Annual and Seasonal Rainfall
Table 2 presents the seasonal and annual rainfall data (in mm) for Bihar from 1901 to 2021. Figure 2a highlights the significant variation in annual rainfall distribution, showing a clear decreasing trend from northeast to southwest across the state. Northeastern districts like Kishanganj, Araria, and Purnia receive the highest rainfall (above 1500 mm) due to their proximity to the Himalayas and the Bay of Bengal. Nearby districts such as Supaul, Saharsa, Katihar, and West Champaran receive rainfall between 1300–1500 mm, while central regions like Muzaffarpur and Samastipur experience moderate rainfall. Southwestern districts, including Gaya and Buxar, receive the least, with Buxar recording the lowest annual rainfall at 967.23 mm. Seasonal rainfall variations are highly contrasting. Winter rainfall (Fig. 2b) is generally lower, ranging from 16.45 mm in Saharsa to 37.10 mm in Rohtas, with central and southern regions receiving more rain. Summer rainfall (Fig. 2c) varies from 27.05 mm in Kaimur to 235.52 mm in Kishanganj, with the northeastern region experiencing greater rainfall. The monsoon season accounts for about 80% of annual rainfall, with the northeastern districts receiving the highest rainfall (e.g., Kishanganj: 1801.56 mm). Post-monsoon rainfall (Fig. 2e) also contributes heavy rainfall in northeastern districts like Kishanganj, while southwestern Bihar (e.g., Gaya, Jahanabad, Kaimur, Arwal) remains relatively dry. Region-wise, the subtropical monsoon climate (Cwa) consistently records higher rainfall across all seasons, particularly during the summer and monsoon months, which are crucial for agriculture. In contrast, the tropical savanna climate (Aw) faces challenges due to lower annual and seasonal rainfall receipt.
Table 2: Rainfall Data (1901-2021)
District | Annual | Winter (Jan-Feb) | Summer (Mar-May) | Monsoon (June-Sep) | Post Monsoon (Oct-Dec) |
Tropical Savanna Climate (Aw) | |||||
Banka | 1124.42 | 28.89 | 83.46 | 918.20 | 93.87 |
Begusarai | 1135.44 | 26.28 | 75.19 | 960.49 | 73.48 |
Bhagalpur | 1180.78 | 26.95 | 102.86 | 961.41 | 89.56 |
Jamui | 1135.31 | 30.29 | 70.36 | 950.30 | 84.36 |
Khagaria | 1152.64 | 24.06 | 79.26 | 976.13 | 73.20 |
Lakhisarai | 1087.53 | 23.48 | 66.47 | 922.34 | 75.25 |
Munger | 1167.00 | 25.57 | 76.62 | 979.28 | 85.54 |
Sheikhpura | 1016.07 | 26.69 | 54.47 | 871.86 | 63.05 |
Subtropical Monsoon Climate (Cwa) | |||||
Araria | 1632.33 | 20.62 | 178.95 | 1346.49 | 86.28 |
Arwal | 968.67 | 30.89 | 30.07 | 854.39 | 53.32 |
Aurangabad | 1082.67 | 35.69 | 33.44 | 954.39 | 59.14 |
Bhojpur | 1006.46 | 28.53 | 34.86 | 885.04 | 58.03 |
Buxar | 967.23 | 28.28 | 31.02 | 849.15 | 58.79 |
Darbhanga | 1145.20 | 21.88 | 94.39 | 959.91 | 69.02 |
East Champaran | 1274.90 | 26.90 | 90.90 | 1087.46 | 69.64 |
Gaya | 1053.17 | 33.98 | 39.97 | 915.96 | 63.26 |
Gopalganj | 1122.63 | 25.18 | 60.03 | 973.60 | 63.82 |
Jahanabad | 994.48 | 31.62 | 41.67 | 869.31 | 51.88 |
Kaimur | 1038.59 | 33.03 | 27.05 | 926.48 | 52.03 |
Katihar | 1330.85 | 20.47 | 132.30 | 1081.03 | 97.04 |
Kishanganj | 2162.00 | 21.16 | 235.52 | 1801.56 | 103.77 |
Madhepura | 1294.77 | 19.98 | 118.94 | 1072.62 | 83.24 |
Madhubani | 1215.29 | 19.21 | 109.11 | 1018.58 | 68.39 |
Muzaffarpur | 1156.53 | 25.81 | 77.91 | 983.48 | 69.32 |
Nalanda | 983.80 | 27.38 | 44.42 | 854.22 | 57.78 |
Nawada | 1010.77 | 30.75 | 44.98 | 863.60 | 71.43 |
Patna | 992.58 | 27.37 | 48.49 | 856.63 | 60.10 |
Purnia | 1537.04 | 22.49 | 162.94 | 1248.82 | 102.80 |
Rohtas | 1065.32 | 37.10 | 35.99 | 934.92 | 57.31 |
Saharsa | 1316.59 | 16.45 | 134.11 | 1095.24 | 70.79 |
Samastipur | 1177.19 | 27.17 | 77.49 | 1000.61 | 71.93 |
Saran | 1068.61 | 25.76 | 52.94 | 926.28 | 63.63 |
Sheohar | 1270.04 | 26.46 | 93.24 | 1089.14 | 61.21 |
Sitamarhi | 1221.52 | 23.61 | 103.54 | 1031.08 | 63.29 |
Siwan | 1073.69 | 27.19 | 50.72 | 931.65 | 64.13 |
Supaul | 1318.56 | 22.25 | 131.94 | 1083.81 | 80.56 |
Vaishali | 1023.12 | 22.93 | 54.55 | 886.50 | 59.14 |
West Champaran | 1464.29 | 29.46 | 111.06 | 1252.10 | 71.67 |
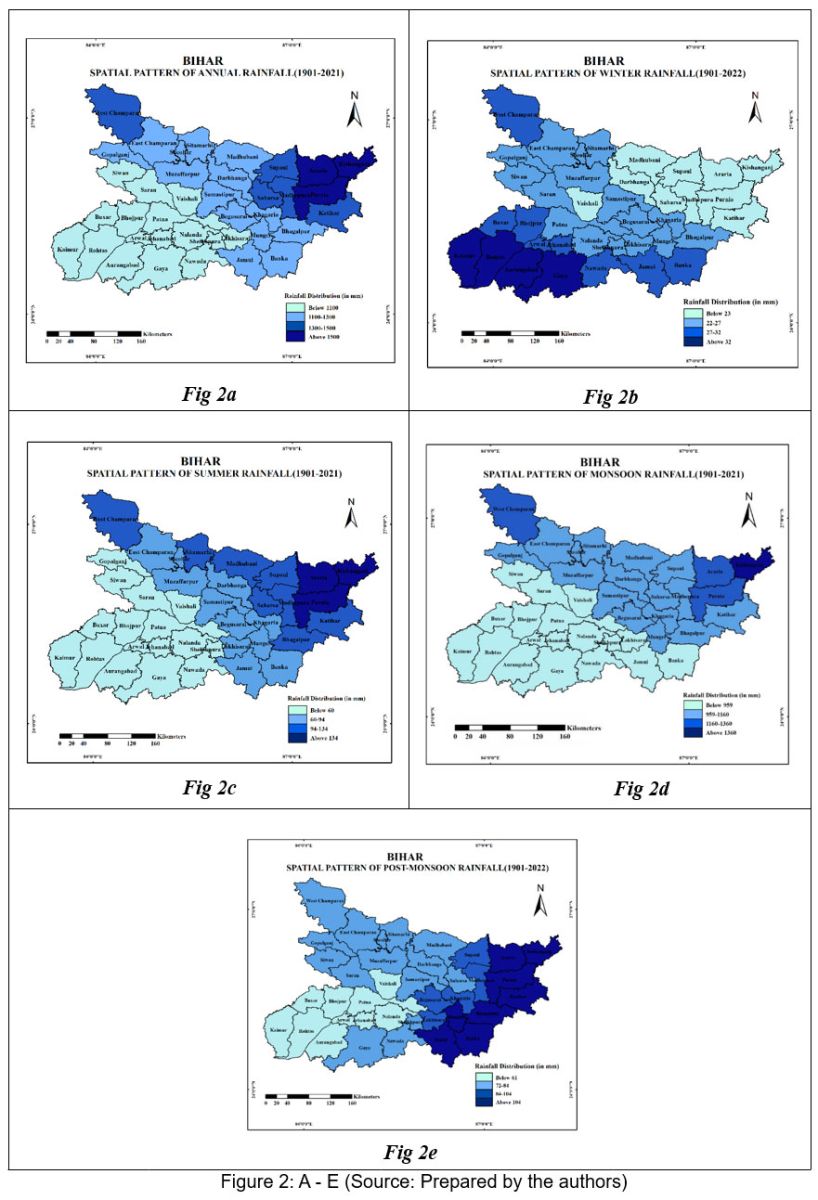 | Figure 2: A - E. Source: Prepared by the authors
|
Analysis of Annual and Seasonal Rainfall Variability
An analysis of rainfall variability across districts in Bihar reveals distinct patterns of seasonal stability and variability, reflecting the region's diverse climate (Table 3). In the Tropical Savanna region (Aw), districts like Banka (SD: 251.92) and Jamui (SD: 256.24) exhibit moderately high annual standard deviation (SD) values, indicating general stability in rainfall distribution. Monsoon season variability is comparatively low, with Bhagalpur recording an SD of 229.67 and Jamui at 225.82, suggesting a consistent water supply for Kharif crops. However, post-monsoon and winter rainfall show higher variability. For instance, Sheikhpura’s post-monsoon SD of 81.52 indicates significant fluctuations that could affect soil moisture and Rabi crop irrigation. Winter variability is notable, with Jamui reporting an SD of 32.29 and a coefficient of variation (CV) of 106.58, reflecting unpredictability. Summer SD values are generally lower than those in the monsoon season, with Banka at 29.08 and Jamui at 32.29 (Figure 3a-3e). A study observed that districts in the Tropical Savanna region exhibited relatively stable rainfall patterns during the monsoon season, while those in the Subtropical Monsoon region (Cwa) experienced higher variability, particularly in districts like Kishanganj (Table 3) and Purnia, which aligns with these findings.19
Annual rainfall variability is more pronounced in the Subtropical Monsoon region (Cwa), encompassing districts like Kishanganj, Araria, and Purnia. Kishanganj’s exceptionally high annual SD of 468.15 and CV of 21.65 indicate substantial annual rainfall with significant variability (Table 3). Monsoon season patterns further emphasize this, as Kishanganj’s monsoon SD reaches 438.92, the highest in the state. High SD values also appear in Araria (305.02) and Purnia (330.77), raising flood risk and potential impacts on food security. The winter months show high SD values in districts like Buxar and Arwal, with CVs exceeding 100%, highlighting irregular and unpredictable rainfall (Figure 3a-3e). Summer rainfall displays significant inter-annual fluctuations, as observed in Supaul (SD: 339.48) and Sitamarhi (SD: 311.93).
Table 3: Annual and Seasonal Rainfall Variability (1901-2021)
Annual | Winter | Summer | Monsoon | Post-monsoon | |||||||
District | SD | CV | SD | CV | SD | CV | SD | CV | SD | CV | |
Tropical Savanna Climate (Aw) | |||||||||||
Banka | 251.92 | 22.40 | 29.08 | 100.65 | 54.15 | 64.88 | 213.28 | 23.23 | 90.74 | 100.01 | |
Begusarai | 287.37 | 25.31 | 24.77 | 94.24 | 54.46 | 72.43 | 261.07 | 27.18 | 74.78 | 103.58 | |
Bhagalpur | 270.76 | 22.93 | 25.39 | 94.20 | 67.69 | 65.81 | 229.67 | 23.89 | 90.01 | 100.89 | |
Jamui | 256.24 | 22.57 | 32.29 | 106.58 | 49.72 | 70.67 | 225.82 | 23.76 | 81.66 | 98.01 | |
Khagaria | 307.99 | 26.72 | 23.74 | 98.70 | 50.06 | 63.17 | 273.44 | 28.01 | 74.58 | 104.92 | |
Lakhisarai | 293.10 | 26.95 | 26.47 | 112.47 | 51.22 | 77.06 | 257.44 | 27.92 | 77.18 | 107.44 | |
Munger | 255.49 | 21.89 | 24.96 | 97.59 | 52.32 | 68.29 | 231.12 | 23.60 | 82.16 | 97.59 | |
Sheikhpura | 263.10 | 25.89 | 28.31 | 106.06 | 44.73 | 82.12 | 240.32 | 27.56 | 81.52 | 132.61 | |
Subtropical Monsoon Climate (Cwa) | |||||||||||
Araria | 337.26 | 20.66 | 20.38 | 98.82 | 82.5 | 46.10 | 305.02 | 22.65 | 84.69 | 98.16 | |
Arwal | 298.36 | 30.80 | 31.14 | 100.84 | 30.5 | 101.41 | 266.76 | 31.22 | 55.65 | 104.36 | |
Aurangabad | 260.86 | 24.09 | 33.71 | 94.45 | 26.75 | 79.99 | 236.18 | 24.75 | 57.65 | 97.48 | |
Bhojpur | 268.67 | 26.69 | 29.20 | 102.34 | 30.54 | 87.61 | 241.74 | 27.31 | 65.45 | 112.79 | |
Buxar | 245.54 | 25.39 | 32.08 | 113.44 | 29.89 | 96.35 | 228.46 | 26.90 | 85.87 | 146.07 | |
Darbhanga | 283.40 | 24.75 | 19.04 | 87.01 | 56.26 | 53.63 | 257.03 | 26.78 | 72.14 | 104.52 | |
East Champaran | 273.04 | 21.42 | 24.08 | 89.52 | 42.75 | 61.90 | 263.12 | 24.20 | 67.58 | 97.04 | |
Gaya | 258.94 | 24.59 | 30.77 | 90.55 | 69.21 | 83.69 | 235.51 | 25.71 | 54.70 | 86.47 | |
Gopalganj | 266.06 | 23.70 | 21.94 | 87.12 | 50.62 | 78.11 | 246.84 | 25.35 | 68.80 | 107.81 | |
Jahanabad | 276.03 | 27.75 | 30.56 | 96.65 | 33.45 | 126.84 | 256.83 | 29.54 | 50.40 | 97.13 | |
Kaimur | 257.19 | 24.76 | 31.02 | 93.92 | 28.9 | 106.85 | 240.71 | 25.98 | 51.37 | 98.73 | |
Katihar | 365.18 | 27.44 | 21.38 | 104.45 | 46.88 | 56.99 | 309.13 | 28.60 | 95.17 | 98.07 | |
Kishanganj | 468.15 | 21.65 | 21.52 | 101.72 | 52.86 | 42.77 | 438.92 | 24.36 | 103.14 | 99.39 | |
Madhepura | 295.83 | 22.85 | 20.31 | 101.68 | 75.4 | 57.24 | 265.16 | 24.72 | 85.68 | 102.93 | |
Madhubani | 280.60 | 23.09 | 18.22 | 94.86 | 100.72 | 48.57 | 260.75 | 25.60 | 70.39 | 102.93 | |
Muzaffarpur | 297.82 | 25.75 | 22.48 | 87.07 | 68.08 | 65.86 | 275.97 | 28.06 | 77.63 | 111.98 | |
Nalanda | 224.79 | 22.85 | 29.85 | 109.05 | 52.99 | 88.75 | 212.18 | 24.84 | 57.57 | 99.63 | |
Nawada | 213.66 | 21.14 | 30.59 | 99.48 | 51.32 | 90.96 | 189.68 | 21.96 | 73.01 | 102.20 | |
Patna | 247.62 | 24.95 | 26.94 | 98.41 | 39.42 | 88.18 | 225.49 | 26.32 | 58.95 | 98.10 | |
Purnia | 330.77 | 24.52 | 22.94 | 101.99 | 84.54 | 51.88 | 330.77 | 26.49 | 101.24 | 98.48 | |
Rohtas | 235.32 | 24.55 | 34.08 | 91.86 | 31.79 | 88.34 | 235.32 | 25.17 | 55.74 | 97.26 | |
Saharsa | 294.02 | 25.85 | 16.65 | 101.19 | 71.85 | 53.57 | 294.02 | 26.85 | 69.92 | 98.77 | |
Samastipur | 284.16 | 25.54 | 27.95 | 102.90 | 51.97 | 67.08 | 284.16 | 28.40 | 76.31 | 106.09 | |
Saran | 232.87 | 22.39 | 22.90 | 88.89 | 38.31 | 72.37 | 232.87 | 25.14 | 68.66 | 107.91 | |
Sheohar | 392.64 | 32.60 | 31.76 | 120.04 | 57.07 | 61.21 | 392.64 | 36.05 | 71.16 | 116.26 | |
Sitamarhi | 311.93 | 25.31 | 23.28 | 95.36 | 55.24 | 51.10 | 306.20 | 27.99 | 63.90 | 97.79 | |
Siwan | 250.18 | 24.77 | 26.34 | 96.87 | 39.12 | 77.14 | 250.18 | 26.85 | 84.44 | 131.68 | |
Supaul | 339.48 | 28.72 | 21.00 | 94.40 | 73.72 | 55.87 | 339.48 | 31.32 | 89.23 | 110.76 | |
Vaishali | 248.14 | 25.67 | 22.06 | 96.19 | 44.43 | 81.44 | 248.14 | 27.99 | 66.02 | 111.63 | |
West Champaran | 310.86 | 21.23 | 24.81 | 84.19 | 40.91 | 62.32 | 287.50 | 22.96 | 64.78 | 90.38 | |
Source: Computed by the authors
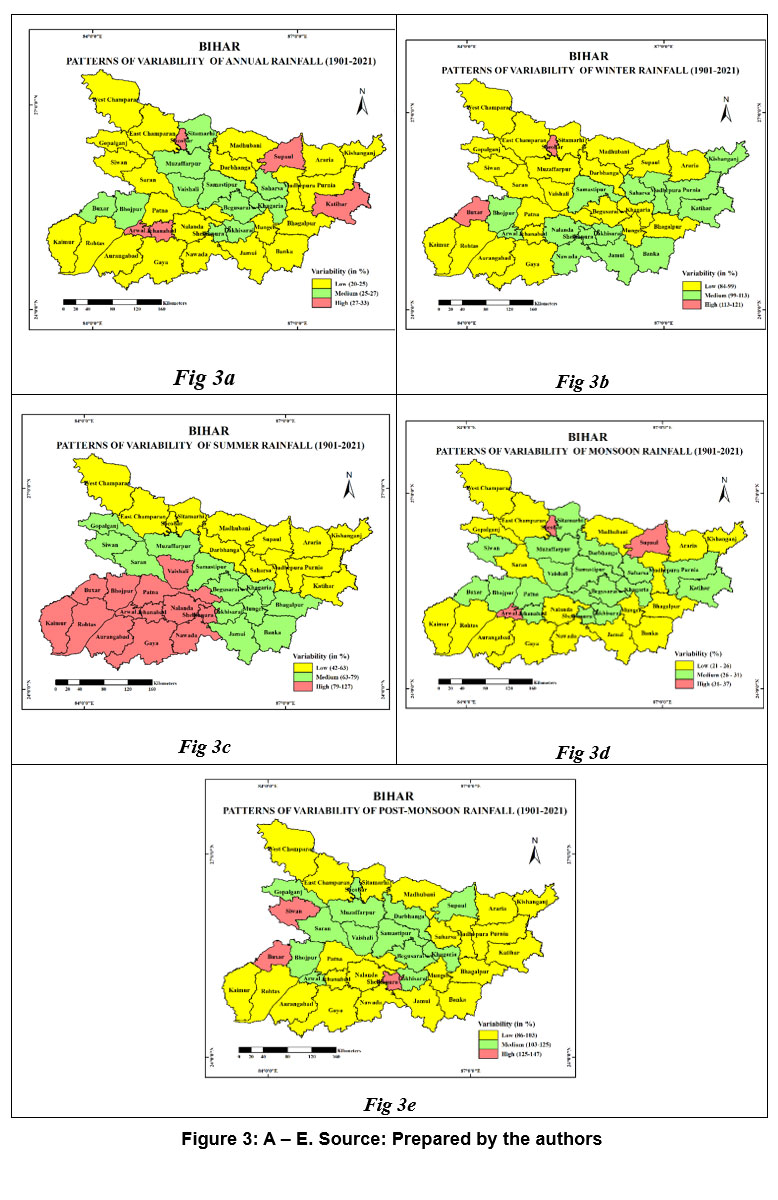 | Figure 3: A - E. Source: Prepared by the authors
|
Analysis of Annual and Seasonal Rainfall Trend
The analysis of rainfall trends from 1901 to 2021 across various stations in Bihar reveals notable declines in both tropical savanna (Aw) and subtropical monsoon (Cwa) climates, with distinct seasonal variations. In the tropical savanna climate, districts such as Begusarai, Lakhisarai, and Jamui exhibit significant negative trends in annual rainfall, with Z-scores of -2.04, -4.50, and -2.52, respectively. These correspond to annual declines of -1.71 mm/year, -4.04 mm/year, and -2.52 mm/year. Seasonal analysis indicates that summer and post-monsoon rainfall also follow declining trends in many of these stations.
In the subtropical monsoon climate, a more pronounced decline is observed, with stations like Arwal and Aurangabad showing significant Z-scores of -3.92 and -4.53, respectively, leading to annual rainfall decreases of -3.51 mm/year and -3.09 mm/year. Similar patterns are observed in Darbhanga and Madhubani, with Z-scores of -3.05 and -3.21, respectively.
Table 4: Rainfall Trends (1901-2021)
Annual | Winter | Summer | Monsoon | Post-monsoon | |||||||
S. No | District | ZS | Qmed | ZS | Qmed | ZS | Qmed | ZS | Qmed | ZS | Qmed |
Tropical Savanna Climate (Aw) | |||||||||||
1 | Banka | -1.50 | -1.07 | -2.79 | -0.16 | -0.60 | -0.08 | -1.60 | -1.01 | 0.34 | 0.05 |
2 | Begusarai | -2.04 | -1.71 | -3.47 | -0.18 | -0.75 | -0.10 | -1.90 | -1.44 | 0.17 | 0.02 |
3 | Bhagalpur | -0.60 | -0.42 | -1.31 | -0.06 | 1.48 | 0.27 | -0.94 | -0.57 | 0.72 | 0.11 |
4 | Jamui | -2.52 | -1.71 | -4.38 | -0.23 | -2.11 | 0.26 | -2.44 | -1.44 | 0.42 | 0.06 |
5 | Lakhisarai | -4.50 | -4.04 | -5.18 | -0.22 | -2.03 | -0.25 | -4.09 | -3.13 | 0.85 | 0.12 |
6 | Khagaria | -2.57 | -2.36 | -3.62 | -0.18 | 0.58 | 0.09 | -2.80 | -2.22 | 0.96 | 0.11 |
7 | Munger | -2.39 | -1.74 | -3.75 | 0.17 | -0.47 | -0.05 | -2.25 | -1.33 | -0.01 | 0.00 |
8 | Sheikhpura | -3.08 | -2.32 | -3.53 | -0.18 | -0.92 | -0.10 | -3.37 | -2.33 | 0.66 | 0.07 |
Subtropical Monsoon Climate (Cwa) | |||||||||||
9 | Arwal | -3.92 | -3.51 | -2.80 | -0.18 | -0.12 | -0.01 | -3.90 | -3.27 | -1.22 | -0.12 |
10 | Araria | -3.08 | -0.45 | -2.79 | -0.16 | 0.72 | 0.17 | -3.34 | -0.31 | -1.11 | -0.15 |
11 | Aurangabad | -4.53 | -3.09 | -2.72 | -0.17 | -0.92 | -0.06 | -4.37 | -2.70 | -0.62 | -0.06 |
12 | Kaimur | -2.29 | -1.46 | -2.32 | -0.14 | -0.53 | -0.02 | -1.92 | -1.06 | -1.48 | -0.11 |
13 | Bhojpur | -2.46 | -2.46 | -3.10 | -0.15 | 1.57 | 0.11 | -2.72 | -1.50 | -1.20 | -0.11 |
14 | Buxar | -2.77 | -1.92 | -4.03 | -0.21 | -0.16 | -0.01 | -2.22 | -1.41 | -1.50 | -0.14 |
15 | Darbhanga | -3.05 | -2.37 | -1.65 | -0.06 | 0.74 | 0.10 | -3.26 | -2.25 | -0.48 | -0.05 |
16 | East Champaran | -2.35 | -1.85 | -1.30 | -0.07 | 0.48 | 0.07 | -2.39 | -1.73 | -0.76 | -0.08 |
17 | Gaya | -4.12 | -2.81 | -3.57 | 0.99 | 0.02 | 0.00 | -3.81 | -2.56 | -0.90 | -0.10 |
18 | Gopalganj | -1.73 | -1.28 | -1.87 | -0.07 | 1.42 | 0.16 | -1.74 | -1.21 | -1.04 | -0.11 |
19 | Jahanabad | -2.83 | -2.26 | -3.06 | -0.21 | 0.25 | 0.02 | -2.83 | -2.10 | -0.61 | -0.05 |
20 | Katihar | -0.05 | -0.04 | -1.19 | -0.03 | 1.66 | 0.34 | 0.68 | -0.58 | 0.27 | 0.04 |
21 | Kishanganj | -0.80 | -1.04 | -2.94 | -0.11 | -0.11 | -0.02 | -0.21 | -0.26 | -1.52 | 0.26 |
22 | Madhepura | -1.20 | -1.08 | -1.20 | -0.05 | 2.56 | 0.58 | -1.62 | -1.50 | -0.59 | -0.10 |
23 | Madhubani | -3.21 | -2.57 | -1.52 | -0.05 | -0.51 | -0.08 | -2.91 | -2.09 | -2.06 | -0.20 |
24 | Muzaffarpur | -1.30 | -1.13 | -1.37 | -0.06 | 2.06 | 0.26 | -1.53 | -1.17 | -0.76 | -0.09 |
25 | Nalanda | -0.57 | -0.41 | -2.82 | -0.12 | 1.09 | 0.09 | -0.94 | -0.54 | 0.23 | 0.02 |
26 | Nawada | -2.02 | -1.27 | -3.14 | -0.17 | 0.09 | 0.01 | -2.04 | -1.14 | 0.38 | 0.03 |
27 | Patna | -0.69 | -0.43 | -2.38 | -0.11 | 2.52 | 0.21 | -1.28 | -0.80 | -0.12 | -0.01 |
28 | Purnia | 2.12 | 2.18 | -1.86 | -0.07 | 3.90 | 0.79 | 1.33 | 1.20 | 0.78 | 0.12 |
29 | Rohtas | -4.66 | -3.21 | -3.16 | -0.19 | 0.61 | 0.04 | -4.61 | -2.76 | -1.49 | -0.16 |
30 | Saharsa | -3.61 | -3.13 | -0.68 | -0.00 | -2.05 | -0.42 | -3.64 | -2.56 | 0.89 | -0.09 |
31 | Samastipur | -2.08 | -1.68 | -2.08 | -0.09 | 1.74 | 0.24 | -2.52 | -1.94 | 0.35 | -0.05 |
32 | Saran | -1.52 | -1.01 | -1.30 | -0.06 | 1.11 | 0.10 | -1.59 | -1.03 | -0.88 | -0.09 |
33 | Sheohar | -0.25 | -0.33 | -0.72 | -0.03 | 0.31 | 0.05 | -0.32 | -0.38 | -1.00 | -0.06 |
34 | Sitamarhi | -2.00 | -1.85 | -1.86 | -0.08 | -0.94 | -0.14 | -1.87 | -1.45 | -1.84 | 0.19 |
35 | Siwan | -1.24 | -0.99 | -3.03 | -0.15 | 0.99 | 0.10 | -1.99 | -1.35 | -1.12 | -0.11 |
36 | Supaul | -1.70 | -1.52 | -1.69 | -0.07 | -1.65 | -1.36 | 1.14 | 0.24 | -0.88 | -0.08 |
37 | Vaishali | -2.15 | -1.63 | -2.95 | -0.13 | 1.41 | 0.14 | -2.10 | -1.52 | -0.20 | -0.02 |
38 | West Champaran | 0.24 | 0.20 | -1.13 | -0.05 | 2.71 | 0.48 | -2.22 | -0.07 | -0.27 | -0.03 |
Source: Prepared by the authors
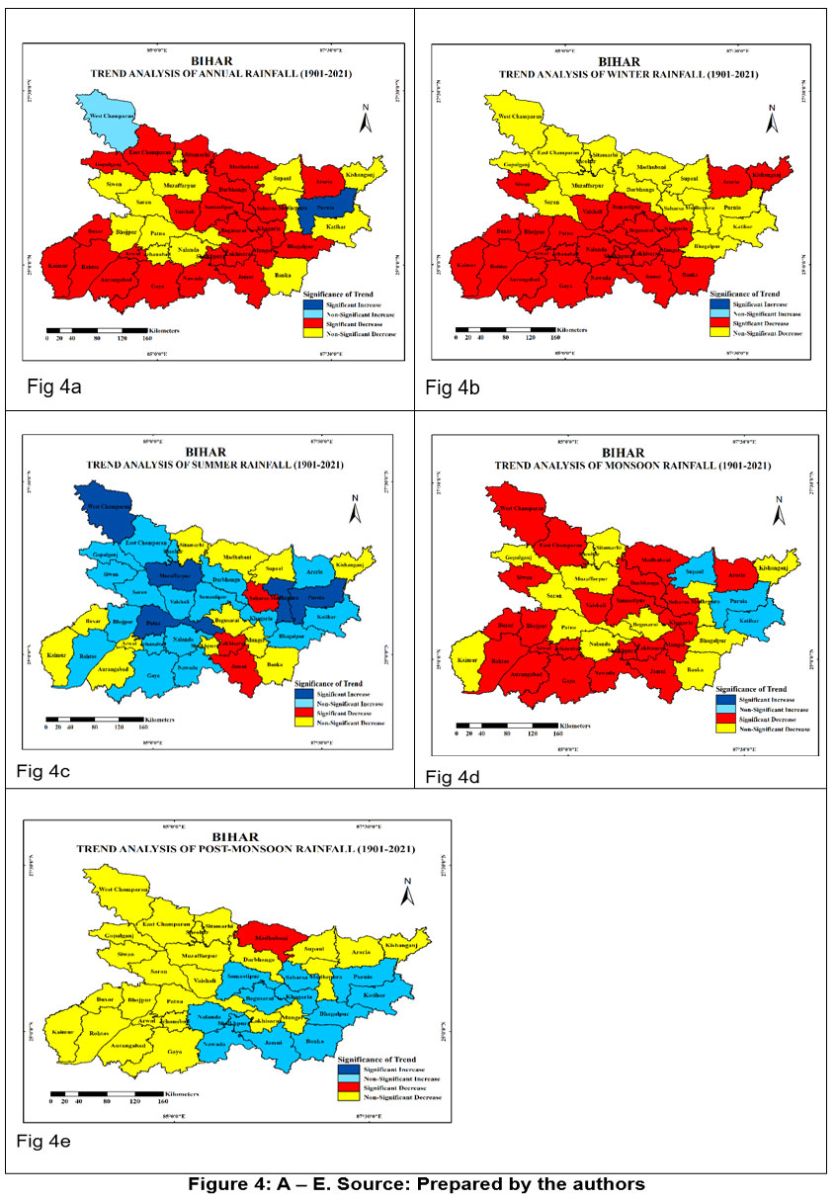 | Figure 4: A – E. Source: Prepared by the authors
|
Drought Assessment Using SPI
Analyzing Standardized Precipitation Index (SPI) values for Bihar from 1901 to 2021 provides insights into drought patterns across different time scales. The 3-month SPI, reflecting short- and medium-term moisture conditions, shows a generally uniform rainfall distribution across the state. The 6- and 9-month SPI values follow a similar pattern, with Gopalganj being the only notable outlier. The 12-month SPI reveals that southeastern districts like Bhagalpur and Munger have experienced mild drought, while the rest of Bihar has remained mildly wet. Minimal differences in SPI values are observed across the region, with most districts receiving over 1100 mm of annual rainfall. Overall, Bihar tends to experience more intense wet periods than dry ones, with a largely consistent rainfall distribution. These findings are supported by Table 5 and the corresponding maps, which illustrate the spatial variability of rainfall and drought conditions.
Table 5: Average SPI (1901-2021)
District | SPI 3 | SPI 6 | SPI 9 | SPI 12 |
Tropical Savanna Climate (Aw) | ||||
Banka | 0.001 | 0.001 | 0.000 | 0.000 |
Begusarai | 0.002 | 0.001 | 0.002 | 0.000 |
Bhagalpur | 0.001 | 0.001 | 0.001 | -0.001 |
Jamui | 0.002 | 0.002 | 0.000 | 0.001 |
Khagaria | 0.003 | 0.003 | 0.001 | 0.001 |
Lakhisarai | 0.002 | 0.002 | 0.002 | 0.001 |
Munger | 0.001 | 0.001 | 0.000 | -0.001 |
Sheikhpura | 0.002 | 0.002 | 0.001 | 0.001 |
Subtropical Monsoon Climate (Cwa) | ||||
Araria | 0.000 | 0.000 | 0.001 | 0.000 |
Arwal | 0.000 | 0.000 | 0.000 | 0.000 |
Aurangabad | 0.001 | 0.001 | 0.001 | 0.000 |
Bhojpur | 0.009 | 0.008 | 0.007 | 0.006 |
Buxar | 0.003 | 0.003 | 0.003 | 0.000 |
Darbhanga | 0.000 | 0.001 | 0.000 | 0.000 |
East Champaran | 0.001 | 0.001 | 0.001 | 0.002 |
Gaya | 0.000 | 0.000 | 0.000 | 0.000 |
Gopalganj | 0.000 | -0.001 | 0.000 | 0.000 |
Jahanabad | 0.001 | 0.002 | 0.000 | 0.000 |
Kaimur | 0.001 | 0.001 | 0.000 | 0.002 |
Katihar | 0.001 | 0.000 | 0.000 | 0.000 |
Kishanganj | 0.001 | 0.001 | 0.001 | 0.000 |
Madhepura | 0.000 | 0.001 | 0.001 | 0.000 |
Madhubani | 0.001 | 0.001 | 0.000 | 0.001 |
Muzaffarpur | 0.000 | 0.001 | 0.000 | 0.000 |
Nalanda | 0.000 | 0.001 | 0.000 | 0.001 |
Nawada | 0.000 | 0.001 | 0.000 | 0.001 |
Patna | 0.000 | 0.001 | 0.000 | 0.000 |
Purnia | 0.000 | 0.001 | 0.001 | 0.000 |
Rohtas | 0.001 | 0.001 | 0.001 | 0.001 |
Saharsa | 0.001 | 0.001 | 0.001 | 0.000 |
Samastipur | 0.001 | 0.001 | 0.001 | 0.000 |
Saran | 0.001 | 0.001 | 0.001 | 0.002 |
Supaul | 0.009 | 0.009 | 0.006 | 0.009 |
Sheohar | 0.001 | 0.001 | 0.000 | 0.001 |
Sitamarhi | 0.017 | 0.019 | 0.007 | 0.013 |
Siwan | 0.001 | 0.001 | 0.001 | 0.001 |
Vaishali | 0.013 | 0.009 | 0.006 | 0.003 |
West Champaran | 0.000 | 0.000 | 0.000 | 0.000 |
Source: Prepared by the authors
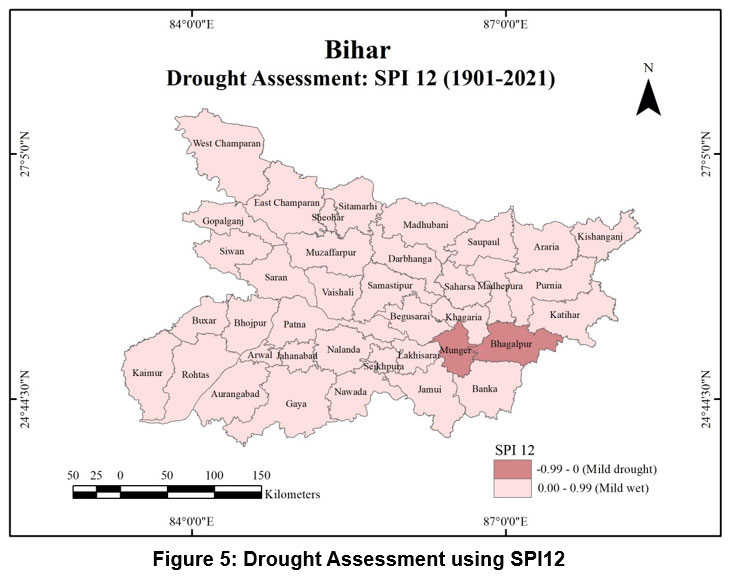 | Figure 5: Drought Assessment using SPI12
|
Discussion
The observed spatial and seasonal variability in rainfall across Bihar is largely influenced by topographical factors, monsoonal circulation, and climate patterns. The higher rainfall in northeastern districts is attributed to their proximity to the Himalayas and the Bay of Bengal, which enhance orographic lift and moisture availability. In contrast, the southwest experiences a decline in rainfall due to the rain-shadow effect and diminishing monsoonal influence. The monsoon, contributing 80% of annual rainfall, underscores the region’s dependence on monsoonal precipitation for agriculture. However, rising rainfall extremes, such as increased heavy rainfall events and prolonged dry spells, pose significant challenges for water resource management and disaster preparedness. Studies highlight increasing drought occurrences in southern Bihar, aligning with the present findings that show lower annual rainfall in southwestern districts.20 Seasonal variations in rainfall further indicate potential risks to agriculture, with winter and summer rainfall variability affecting rabi and kharif crop production.21 This necessitates adaptive farming strategies, including drought-resistant crops and improved irrigation systems. The rainfall differences between the Cwa and Aw climatic zones suggest that areas with a tropical savanna climate (Aw) may require additional water management strategies to sustain agriculture.
In the Aw region, the relatively stable monsoonal rainfall supports Kharif crop cultivation, with low SD values in monsoon rainfall (e.g., Bhagalpur and Jamui), indicating a predictable water supply that supports consistent agricultural output. However, post-monsoon and winter variability, as seen in Sheikhpura and Jamui, poses challenges for Rabi crop irrigation, highlighting the need for better soil moisture retention techniques and irrigation planning. A previous study found less monsoon variability in the Aw region, further supporting the idea that this climate type provides more stable rainfall patterns for agriculture.22 Conversely, the Cwa region exhibits high variability across all seasons, especially in monsoon and winter rainfall. Stations like Kishanganj, Araria, and Purnia experience extreme fluctuations in monsoon SD, which increases flood risks and threatens food security. The high SD values in monsoon rainfall (e.g., Kishanganj: 438.92) call for improved flood mitigation and drainage systems. Additionally, winter rainfall variability in Buxar and Arwal (CV >100%) suggests challenges for groundwater recharge and irrigation management. These findings are consistent with previous research which emphasized the higher variability in Cwa regions, particularly during monsoon and winter seasons, requiring more efficient water management practices. Furthermore, significant inter-annual fluctuations in summer rainfall (e.g., Supaul and Sitamarhi) can impact early cropping cycles and water storage planning, as highlighted by another study which stressed the urgent need for adaptive water management strategies in the Cwa region to mitigate rainfall variability risks.23
Overall, the findings suggest that while farmers in the Aw region benefit from stable monsoon rainfall for reliable Kharif cultivation, the Cwa region's high rainfall variability during monsoon and winter demands improved water management practices to reduce agricultural and hydrological risks. The declining rainfall trends in both tropical savanna and subtropical monsoon climates highlight the need for timely water management strategies. The findings emphasize the importance of adaptive measures, such as better irrigation systems and drought-resistant crops, to address the challenges posed by changing rainfall patterns in Bihar.
Conclusion
The analysis of rainfall patterns in Bihar reveals significant spatial variability, with a pronounced decline in precipitation as one move from the northeastern to the southwestern parts of the state. North Bihar experiences considerably higher rainfall compared to its southern counterpart, which holds critical implications for agricultural productivity in both regions. In subtropical monsoon climate zones like Bihar, rainfall fluctuations are more pronounced than in tropical savanna zones, leading to unpredictable growing conditions that farmers must navigate. A troubling trend is the observed decline in monsoon rainfall, which is vital for the Kharif crop season which primarily relies on this precipitation for sustaining crops like rice and pulses. This reduction poses a direct threat to agricultural yields and food security, underscoring the urgency for adaptive measures. Conversely, the increasing summer rainfall (while potentially beneficial) highlights the need for enhanced water storage systems to capture and retain this precipitation effectively. Existing infrastructure may not suffice to manage these new patterns of rainfall, leading to runoff and wastage. Moreover, reduced rainfall during the winter and post-monsoon periods, particularly in southern Bihar, further exacerbates challenges for Rabi crops that are reliant on consistent moisture levels for their growth. The analysis also reveals that mild wet conditions prevail in the region, with specific districts facing occasional mild droughts, illustrating the complex interplay of rainfall dynamics across Bihar. The standardized precipitation index (SPI) values, which indicate a uniform pattern of precipitation variability, reinforce the importance of strategic water resource management.
Strategies like rainwater harvesting, improved irrigation, drought-resistant crops, and weather forecasting are vital for agricultural resilience. Investments in water conservation measures based on nature-based solutions like maintenance of natural embankments and check dams, recharging of ponds, and promoting community-based water management can build resilience and mitigate the impacts of climate variability. Combining traditional Indian knowledge systems with modern technology offers a holistic approach to water management.
In summary, Bihar must adopt a multi-faceted approach- a combination of advanced water management, adaptive farming, and community engagement to enhance agricultural resilience and ensure sustainability amid changing rainfall patterns.
Acknowledgment
The authors acknowledge the India Meteorological Department (IMD), Patna for providing the latest meteorological data and Shri Anand Shankar, Scientist-C, IMD Patna for valuable suggestions and inputs.
Funding Sources
The author(s) received no financial support for the research, authorship, and/or publication of this article.
Conflict of Interest
The authors do not have any conflict of interest.
Data Availability Statement
The meteorological data used in this study has been provided by India Meteorological Department (IMD), Patna on monthly and annual time scale.
Ethics Statement
This research did not involve human participants, animal subjects, or any material that requires ethical approval.
Informed Consent Statement
This study did not involve human participants, and therefore, informed consent was not required.
Author Contributions
Manu Raj Sharma: conceptualization, methodology, software, validation;
Sukeshi Priya: data mapping, writing—original draft preparation, data analysis, and restructuring;
Surbhi Kumari: Analysis of SPI, supervision, revision.
References
- Goswami BN, Venugopal V, Sengupta D, Madhusoodan MS, Xavier PK. Increasing trend of extreme rain events over India in a warming environment. Science. 2006;314(5804):1442-1445. doi:10.1126/science.1132027
- Srivastava PK, Pradhan RK, Petropoulos GP, et al. Long-term trend analysis of precipitation and extreme events over Kosi River Basin in India. Water. 2021;13(12):1695. doi:10.3390/w13121695
- Singh V, Nema AK, Chouksey A, Kar SK. Spatiotemporal evaluation of drought characteristics in south Bihar region using Standardized Precipitation Index (SPI). Arab J Geosci. 2022;15(13):1231. doi:10.1007/s12517-022-10473-z
- Singh N, Sontakke NA. On climatic fluctuations and environmental changes of the Indo-Gangetic plains, India. Clim Change. 2002;52(3):287-313. doi:10.1023/A:1013772505484
- Sharma MR, Priya S. Long-term assessment of precipitation behaviour in Bihar (1901–2021): Patterns, trends and observed variability. Curr World Environ. 2023;18(2):331-345. doi:10.12944/CWE.18.2.19
- Singh RS, Singh RKP, Singh AK. Rainfall variability analysis and its impact on crop production in Bihar. Afr J Agric Res. 2013;8(41):5100-5108.
- Zakwan M, Ara Z. Statistical analysis of rainfall in Bihar. Sustain Water Resour Manag. 2019;5(4):1781-1789. doi:10.1007/s40899-019-00340-3
- Tripathi G, Pandey AC, Parida BR. Flood hazard and risk zonation in North Bihar using satellite-derived historical flood events and socio-economic data. Sustainability. 2022;14(3):1472. doi:10.3390/su14031472
- Tripathi G, Parida BR, Pandey AC. Spatial-temporal rainfall variability and flood prognosis analysis using satellite data over North Bihar during the August 2017 flood event. Hydrology. 2019;6(2):38. doi:10.3390/HYDROLOGY6020038
- Suni SK. Long-term trends and probability of rainfall for crop planning in Bihar. J Agrometeorol. 2022;16(1):146-148. doi:10.54386/jam.v16i1.1503
- Singh SK, Singh KM, Singh R, Kumar A, Kumar U. Impact of rainfall on agricultural production in Bihar: A zone-wise analysis. Environ Ecol. 2014;32(4A):1571-1576. Available at SSRN: https://ssrn.com/abstract=2464398
- Kumar A, Kumar N. Rainfall variability analysis and its impact on crop production in Bihar. Afr J Agric Res. 2013;8(44):5452-5460. Available from: https://academicjournals.org/journal/AJAR/article-full-text/F1375AD51058
- Jaiswal N. Environmental change and groundwater variability in South Bihar, India. Int J Environ Res. 2024;18(10):1234-1245. DOI: 10.1016/j.gsd.2022.100846
- Kendall MG. Rank correlation method. 4th ed. London, UK: Charles Griffin; 1975.
- Sen PK. Estimates of the regression coefficient based on Kendall’s Tau. J Am Stat Assoc. 1968;63:1379-1389. doi:10.1080/01621459.1968.10480934
- Theil H. A rank-invariant method of linear and polynomial regression analysis. Part 1. Proc R Neth Accad Sci. 1950; 53:386-392.
- Wang Q, Zhang R, Qi J, et al. An improved daily standardized precipitation index dataset for mainland China from 1961 to 2018. Sci Data. 2022;9(124):1-12. doi:10.1038/s41597-022-01201-z
- Aryal A, Maharjan M, Tlhabane R, Thapa BR. Characterizing meteorological droughts in Nepal: A comparative analysis of standardized precipitation index and rainfall anomaly index. Earth. 2022;3(1):409-432. doi:10.3390/earth3010025
- Singh P, Mall RK, Singh KK. District-wise spatiotemporal analysis of precipitation trend during 1900-2022 in Bihar state, India. Mausam. 2024;75(4):1059-1070. doi:10.54302/mausam.v75i4.6673
- Kumari M, Kumar B, Kumar R, et al. Assessment of vulnerability of farmers to climate change in Zone-II of Bihar, India. Econ Aff. 2023;68(Special Issue):1847-1854. DOI: 10.46852/0424-2513.5.2023.8
- Kumar S, Aggarwal PK, Rani S, et al. Climate variability and change in Bihar, India: Challenges and opportunities for sustainable crop production. Sustainability. 2017;9(11):1998. https://doi.org/10.3390/su9111998
- Das S, Mehra MK, Paulson J. Role of autonomous adaptation to climate change in agriculture: A survey-based analysis of Bihar, India. Res Square. 2022. DOI: 10.21203/rs.3.rs-2220319/v1
- Kumar A, Singh SK. Investigating the changing pattern of groundwater levels and rainfall in Bihar, India. Water Supply. 2023;24(2):465-478. DOI: 10.2166/ws.2024.010


