Biomass Stockpile of Trees in Tropical Dry Evergreen Forests, Peninsular India
Muthulingam Udayakumar
*
 and Johnson Evitex Izayas
1
Department of Plant Science,
Manonmaniam Sundaranar University,
Tirunelveli,
Tamil Nadu
India
http://dx.doi.org/10.12944/CWE.20.1.6
Copy the following to cite this article:
Udayakumar M, Izayas J. E. Biomass Stockpile of Trees in Tropical Dry Evergreen Forests, Peninsular India. Curr World Environ 2025;20(1). DOI:http://dx.doi.org/10.12944/CWE.20.1.6
Copy the following to cite this URL:
Udayakumar M, Izayas J. E. Biomass Stockpile of Trees in Tropical Dry Evergreen Forests, Peninsular India. Curr World Environ 2025;20(1).
Download article (pdf)
Citation Manager
Publish History

Introduction
Forests cover one-third of Earth's land area, virtually holding its 80 and 40 percent of total above and belowground terrestrial carbon, respectively.1,2 It is estimated that the forests accumulate as much as 86% carbon pool of vegetation and 73% of the soils.3,4 Biomass estimation and inventories of unstudied forest types becomes highly important in view of the crucial role they play, in controlling global carbon pools and fluxes.5 Tropical forests are the largest sink of carbon in the world and it lodges ~212 Gt of carbon (C) in its vegetation.6,7 Half of all the terrestrial C which account for about 80% of C exchange between terrestrial ecosystem and the atmosphere is present in the forests globally.1,8
The climatic climax vegetation existing on the Coromandel coast region of South India has been classified as TDEF.9 The total geographical cover of the forest type in India is 2072 km2, further the forest type was considered as rarest10 and endangered11 in India. Notably, most proportion of the original forest cover (~95%) has been converted to other uses.12,13 Of the remaining forest area, only 1% is being protected as reserve forest.14 This terrestrial forest type surviving as patches along the Coromandel coast region.15 Currently, TDEFs are divided and generally preserved as 'sacred groves' (SGs).16 The characteristic features of TDEFs include lower basal area, uncommon cauliflory, and very rare presence of herbaceous vascular epiphytes and absence of large vertebrate dispersers.17 Further, the Coromandel coast region is rich in endemic species. The region acts as home for 107 endemic species belonged to 74 genera and 33 species.18 Besides, information on biomass stockpile of tropical dry evergreen forests (TDEFs) are very limited.19,20 Therefore, the present study- assessed species richness (species ha-1), stem density (number of trees ha-1) and stand basal area (m2 ha-1) of trees in ten TDEF patches each with 1-ha study area; estimated wood density (WD) for selected species of TDEFs which do not have wood density data in published form; and quantified above and belowground biomass of trees (Mg ha-1) through suitable allometric equations.
Material and Methods
Study area
The occurrence of forest patches has been recorded through personal interviews with local people of Nagapattinam and Tiruvarur districts in Tamil Nadu. Personal interviews helped us to recorded 24 patches of TDEF sites, among 24 patches ten sites were selected based on the geographical cover. Ten TDEFs with a vegetation coverage exceeding 1-ha (the area of remaining 14 sites is <1-ha) each were selected for quantitative assessment of trees and estimation of above and below ground biomass. Of these, two were in Tamil Nadu's Thiruvarur (TV) district and eight were in Nagapattinam (NP) district (Fig.1). The selected forests occurring 1-5 km inland from the coast, a part of coastal plains of Coromandel coast region. Nagapattinam (10°10' and 11°20' N; 79°15' and 79°50' E) and Thiruvarur (10° 20' and 11° 07' N; 79° 15' and 79° 45' E) are Coromandel Coast districts of Tamil Nadu. In the NP and TV districts, the average maximum and minimum yearly temperatures and rainfall are 32 °C, 24.6 °C, and 1174 mm; and 36.9 °C, 29.8 °C, and 1091 mm, correspondingly. These forests experiences 5-6 dry months in a year.21 The soil type of the study area is coastal alluvium, generally considered as moderately or poorly fertile.22 Notably, the TDEF has been considered as oligotrophic habitat.22,23 The characteristic species of TDEFs are Manilkara hexandra, Memecylon umbellatum, Psydrax dicoccos, Pterospermum canescens and Sapindus emarginatus,10,24 whereas the dominant species vary across forest patches, for instance, Memecylon umbellatum, Tricalysia sphaerocarpa and Drypetes sepiaria dominating Palvathunnan,25 Arasadikuppam and Karisakkadu26 TDEFs, respectively.
Estimation of tree density. species richness and basal area
The total geographical cover of the studied forests varied from 1.5-ha to 5-ha; in order to keep the uniformity and facilitate the comparison, a 1-ha area was selected in each site. Quadrat method was adapted to find tree density (trees ha-1) and species richness (number of species ha-1). A sum of one hundred quadrats, 10m × 10m was laid in each study site (total 100m × 100m, 10,000 m2, 1-ha). All the living trees with diameter at breast height > 5 cm (DBH) were recorded and stem density (trees ha-1) of these plots were directly calculated by totalling all the individuals in 100 quadrats. All the tree species recorded from 100 quadrats was summed to calculate species richness (number of species ha-1). As recommended by researchers27 the height of 40 trees, eight trees each in 10-20, 20.1-30, 30.1-40, 40.1-50 and >50 cm DBH classes was measured with the help of hypsometer and recorded in m. The mean height of DBH classes was utilized to estimate biomass storage of trees. Basal area of stem was calculated using the following formula. For multi-stemmed individuals, the BA calculated separately for each stem and summed.
Wood density
By considering endangered status and restricted geographical extension of the TDEFs, the study kept minimum level of bioresource exploitation for the estimation of wood density (WD). WD data for 21 tree species were taken from a published literature.17 Global Wood Density database provided such information for 16 species.28 The present study also estimated WD value for 17 species for those species whose WD data is unavailable in published form as follows.29,30 A sum of six wood cores (two cores each from three individuals) (0.51 cm diameter; 0.255 cm radius) for each species was collected using increment wood borer (make Haglof, Sweden). The length of collected wood cores measured with mm accuracy and recorded. All the collected samples were placed in a well-ventilated hot-air oven at 105 °C for 72 h. Wood cores re-weighed using a pan-top digital balance and dry weight recorded with mg accuracy. The volume of the wood samples was calculated as follows.
![]()
where, n is constant; r is radius (cm) and L is length (cm). Finally, the wood density of samples was estimated as follows.
Above and belowground biomass estimation
A regression equation6 was used to estimate aboveground biomass (AGB): [(AGB)est = 0.0673 × (pD2H)0.976], where 0.0673 is constant, D is the trunk diameter at breast height (cm), H is the height in meters, and p is the oven-dry wood density (g cm-3). The present study utilized a regression equation31 developed for the estimation of belowground biomass of trees in global tropical forests. BB = Exp[-1.0587 + 0.8836 × LN (ABD)]; where, -1.0587, 0.8836 are constants; BB is Belowground biomass (dry t ha-1); LN = Natural logarithm; ABD = Aboveground dry biomass (Mg ha-1). Biomass values were multiplied by 0.50 to get carbon storage value of trees.32 Statistical analyses carried out through a freely accessible online tool (https://www.socscistatistics.com/).
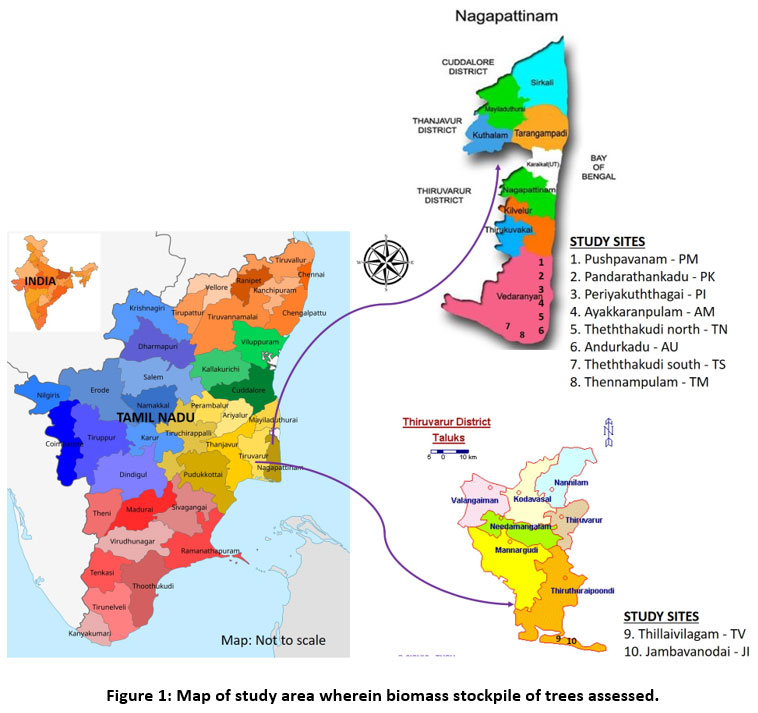 | Figure 1: Map of study area wherein biomass stockpile of trees assessed.
|
Results
Species richness, stand density and basal area
Out of ten TDEFs, 54 tree species (> 5 cm DBH) from 49 taxa under 25 families were surveyed (Table 1). The total number of species recorded at each of the ten sites ranged from a low of 24 species at site PM to a high of 35 species at site TV (Table 1). As to the number of genera recorded, site TV with 33 genera was found to be the maximum, and sites PI and PM each had a minimum of 23 genera. The sites, AM and AK had a maximum of 20 angiosperm families, while PI had 16 families. With eight species, the Rubiaceae family was the most speciose, followed by the Euphorbiaceae with six, the Ebenaceae with four, and the Moraceae, Rutaceae, and Sapindaceae with three each (Table 1). Physiognomically, evergreen species (30; 54.55%) dominated the study area followed by deciduous (17; 30.9%) and brevi-deciduous (8; 14.55%) species. The ten 1-ha plots had 7599 tree individuals (>5 cm DBH). Site JI had a minimum stem density of 397 trees ha-1, while site TV had a maximum of 1337 trees ha-1 (Table 1).
Individual site basal areas ranged from 10.78 m2 ha-1 for site AU to 26.48 m2 ha-1 for TV (Table 1), whereas the mean BA of study area was 18.99±5.05 m2 ha-1. Cumulatively, Memecylon umbellatum was most abundant with 2331 stems (30.68%), whereas Commiphora caudata, Premna latifolia, Sapium insigne and Terminalia arjuna were represented by a single individual each in the study area (Table 2).
Table 1: Species, genera, family, stem density, basal area, biomass and carbon stockpile of trees in TDEFs, southern Coromandel Coast, peninsular India.
Sl. | Forest site | Geographical coordinates | No. of species | No. of genera | No. of families | Stem density (trees ha-1) | Basal area (m2 ha-1) | AGB (Mg ha-1) | BGB (Mg ha-1) | Total biomass (Mg ha-1) | Carbon storage (Mg ha-1) |
1 | PM | 10°29’29.99” N | 26 | 23 | 18 | 638 | 15.58 | 110.86 | 22.23 | 133.09 | 66.545 |
2 | PK | 10°27’2.88” N | 25 | 24 | 17 | 1084 | 23.84 | 141.96 | 27.66 | 169.62 | 84.81 |
3 | PI | 10°25’06.75” N | 26 | 23 | 16 | 955 | 21.16 | 138.99 | 27.15 | 166.22 | 83.11 |
4 | AM | 10°27’2.88” N | 31 | 31 | 20 | 400 | 15.66 | 94.36 | 19.28 | 113.64 | 56.82 |
5 | TN | 10°24’08.17” N | 30 | 27 | 19 | 957 | 22.54 | 131.85 | 25.91 | 157.76 | 78.88 |
6 | AU | 10°23’ 9.6” N | 30 | 26 | 20 | 791 | 10.78 | 72.09 | 15.20 | 87.29 | 43.645 |
7 | TS | 10°26’20.35” N | 26 | 26 | 17 | 517 | 16.72 | 116.02 | 23.14 | 139.16 | 69.58 |
8 | TN | 10°26’55.52” N | 31 | 30 | 18 | 523 | 14.3 | 103.7 | 20.96 | 124.66 | 62.33 |
9 | TV | 10°24’24.16” N | 34 | 33 | 18 | 1337 | 26.48 | 169.03 | 32.27 | 201.30 | 100.65 |
10 | JI | 10°23’ 24.37” N | 28 | 26 | 19 | 397 | 22.87 | 134.41 | 26.36 | 160.77 | 80.385 |
Total | 54 | 49 | 35 | 7599 | 189.9 | 1213.27 | 240.17 | 1453.44 | 726.755 | ||
Mean (S.D.) | 28.7 | 26.9 | 18.2 | 759.9 | 18.99 | 121.33 | 24.02 | 145.35 | 72.67 |
Table 2: Binomial, family, density (trees ha-1), contribution of trees to total density and biomass recorded from the field study area.
No. | Binomial | Family | No. of trees | Contribution of density% | Contribution of biomass% |
1 | Aglaia elaeagnoidea (A .Juss .) Benth. | Meliaceae | 30 | 0.39 | 0.42 |
2 | Albizia lebbeck (L.) Benth. | Mimosaceae | 16 | 0.21 | 0.66 |
3 | Allophylus serratus (Hiern) Kurz | Sapindaceae | 37 | 0.49 | 0.82 |
4 | Anacardium occidentale L. | Anacardiaceae | 12 | 0.16 | 0.13 |
5 | Atalantia monophylla DC. | Rutaceae | 300 | 3.95 | 4.78 |
6 | Azadirachta indica A. Juss. | Meliaceae | 37 | 0.49 | 0.71 |
7 | Benkara malabarica (Lam.) Tirveng. | Rubiaceae | 256 | 3.37 | 1.86 |
8 | Breynia vitis-idaea (Burm. f.) C.E.C. Fisch. | Euphorbiaceae | 55 | 0.80 | 0.22 |
9 | Calophyllum inophyllum L. | Clusiaceae | 5 | 0.07 | 0.04 |
10 | Canthium coromandelicum Alston | Rubiaceae | 51 | 0.67 | 0.67 |
11 | Canthium dicoccum (Gaertn.) Merr. | Rubiaceae | 384 | 5.05 | 1.01 |
12 | Carmona retusa (Vahl) Masam. | Boraginaceae | 9 | 0.12 | 0.43 |
13 | Cassia fistula L. | Caesalpiniaceae | 138 | 1.82 | 1.62 |
14 | Catunaregam spinosa (Thunb.) Tirveng. | Rubiaceae | 31 | 0.41 | 0.21 |
15 | Chionanthus zeylanicus L. | Oleaceae | 10 | 0.13 | 0.02 |
16 | Commiphora caudata Engl. | Burseraceae | 1 | 0.01 | 0.01 |
17 | Crateva magna (Lour.) DC. | Capparidaceae | 32 | 0.42 | 0.26 |
18 | Diospyros ebenum J. König | Ebenaceae | 148 | 1.95 | 1.64 |
19 | Diospyros ferrea (Willd.) Bakh. | Ebenaceae | 303 | 3.98 | 2.4 |
20 | Diospyros montana Roxb. | Ebenaceae | 38 | 0.5 | 0.42 |
21 | Diospyros peregrina Gurke | Ebenaceae | 5 | 0.07 | 0.04 |
22 | Drypetes sepiaria (Wight & Arn.) Pax & K. Hoffm. | Euphorbiaceae | 259 | 3.41 | 14.06 |
23 | Ehretia pubescens Benth. | Boraginaceae | 46 | 0.61 | 0.22 |
24 | Euphorbia antiquorum L. | Euphorbiaceae | 6 | 0.08 | 0.02 |
25 | Ficus benghalensis L. | Moraceae | 14 | 0.18 | 0.78 |
26 | Ficus hispida L. f. | Moraceae | 27 | 0.35 | 0.07 |
27 | Flacourtia indica (Burm. f.) Merr. | Flacourtiaceae | 34 | 0.45 | 0.02 |
28 | Garcinia spicata Hook. | Clusiaceae | 645 | 8.49 | 14.66 |
29 | Glycosmis mauritiana Tanaka | Rutaceae | 547 | 7.19 | 2.31 |
30 | Gmelina asiatica L. | Verbenaceae | 119 | 1.57 | 3.64 |
31 | Ixora pavetta Andrews | Rubiaceae | 117 | 1.54 | 0.74 |
32 | Lannea coromandelica (Houtt.) Merr. | Anacardiaceae | 82 | 1.08 | 0.52 |
33 | Lepisanthes tetraphylla (Vahl.) Radlk. | Sapindaceae | 126 | 1.66 | 6.79 |
34 | Madhuca longifolia (J. König ex L.) J.F. Macbr. | Sapotaceae | 29 | 0.38 | 0.32 |
35 | Manilkara hexandra (Roxb.) Dubard | Sapotaceae | 153 | 2.01 | 2.57 |
36 | Maytenus emarginata (Willd.) Ding Hou | Celastraceae | 113 | 1.49 | 0.65 |
37 | Memecylon umbellatum Burm. f. | Melastomataceae | 2331 | 30.68 | 17.19 |
38 | Morinda coreia Buch. -Ham. | Rubiaceae | 5 | 0.07 | 0.1 |
39 | Ochna serrata L. | Ochnaceae | 57 | 0.75 | 0.27 |
40 | Pamburus missionis (Wight) Swingle | Rutaceae | 39 | 0.51 | 0.41 |
41 | Pavetta indica L. | Rubiaceae | 177 | 2.33 | 0.09 |
42 | Phyllanthus reticulatus Poir. | Euphorbiaceae | 14 | 0.18 | 0.04 |
43 | Pongamia pinnata (L.) Merr. | Papilionaceae | 57 | 0.75 | 0.21 |
44 | Premna latifolia Roxb. | Verbenaceae | 1 | 0.01 | 0.01 |
45 | Pterospermum canescens Roxb. | Sterculiaceae | 167 | 2.19 | 4.79 |
46 | Sapindus emarginatus Vahl | Sapindaceae | 16 | 0.21 | 0.03 |
47 | Sapium insigne (Royle) Benth. & Hook. f. | Euphorbiaceae | 1 | 0.01 | 0.01 |
48 | Securenega leucopyrus (Willd.) Muell.-Arg. | Euphorbiaceae | 17 | 0.22 | 0.03 |
49 | Streblus asper Lour. | Moraceae | 53 | 0.69 | 0.8 |
50 | Syzygium cumini (L.) Skeels | Myrtaceae | 160 | 2.12 | 9.61 |
51 | Tamarindus indica L. | Caesalpiniaceae | 13 | 0.17 | 0.03 |
52 | Tarenna asiatica Kuntze ex K. Schum. | Rubiaceae | 270 | 3.55 | 0.52 |
53 | Terminalia arjuna Wight & Arn. | Caesalpiniaceae | 1 | 0.01 | 0.01 |
54 | Thespesia populnea (L.) Sol. Ex Corrêa | Malvaceae | 5 | 0.07 | 0.03 |
Total | - | 7599 | 100 | 100 |
Wood density
Wood density ranged from a minimum of 0.37±0.03 g cm-3 (Crataeva magna) to a maximum of 0.98±0.15 g cm-3 (Tamarindus indica). Among evergreen trees, Tarenna asiatica had high WD (0.89±0.06 g cm-3) followed by Aglaia elaegnoidea (0.87±0.05g cm-3) and Atalantia monophylla (0.84 g cm-3), while Tamarindus indica (0.98±0.15 g cm-3) and Albizia saman (0.74±0.06 g cm-3) held high WD among deciduous trees. The present study estimated an average of 0.71±0.053 g cm-3 WD value for each species (Table 3). The average WD value of evergreen species was 0.723±0.065 g cm-3, while it was 0.662±0.057 g cm-3 for deciduous species.
Table 3: Wood density of trees found in ten TDEFs of southern Coromandel coast, India.
No. | Species | Wood density (g cm-3 ± SD) |
1. | Allophylus serratus (Hiern) Kurz | 0.42±0.04 |
2. | Anacardium occidentale L. | 0.47±0.06 |
3. | Benkara malabarica (Lam.) Tirveng. | 0.63±0.1 |
4. | Breynia vitis-idaea (Burm. f.) C.E.C. Fisch. | 0.67±0.05 |
5. | Canthium coromandelicum Alston | 0.72±0.03 |
6. | Catunaregam spinosa (Thunb.) Tirveng. | 0.67±0.02 |
7. | Cordia pubescens Willd. ex Roem. Schult. | 0.67±0.003 |
8. | Ficus hispida L. f. | 0.37±0.02 |
9. | Flacourtia indica (Burm. f.) Merr. | 0.69±0.05 |
10. | Gmelina asiatica L. | 0.49±0.18 |
11. | Ixora pavetta Andrews | 0.69±0.12 |
12. | Maytenus emarginata (Willd.) Ding Hou | 0.69±0.03 |
13. | Ochna squarrosa L. | 0.80±0.04 |
14. | Pamburus missionis (Wight) Swingle | 0.78±0.08 |
15. | Sapindus emarginatus Vahl | 0.71±0.12 |
16. | Streblus asper Lour. | 0.72±0.02 |
17. | Tamarindus indica L. | 0.98±0.15 |
Sub total (17 species) | 11.70±0.065 | |
Cumulative WD value for 21 species 17 | 15.63±0.053 | |
Cumulative WD value of 16 species 28 | 11.02±0.086 | |
Total | 38.35/54 | |
Mean WD value (54 species) | 0.71 |
Aboveground biomass
An average of 121.33±27.68 (S.D.) Mg ha-1 AGB was estimated in each TDEF. AGB ranged from a minimum of 72.09 Mg ha-1 in AU to a maximum of 169.03 Mg ha-1 in TV. A total of 1213.27 Mg of AGB was present in ten TDEFs (Table 1). At species-level, ten species which include Memecylon umbellatum (17.19 %, 208.52 Mg), Garcinia spicata (14.66 %, 177.82 Mg) and Drypetes sepiaria (14.06 %, 170.53) were contributed 80.49 % (976.55 Mg) to total AGB, whereas rest of 44 species contributed only 19.51 % (236.71 Mg) to total AGB (Fig. 2). Among eight diameter classes (5-10, 10.1-20, 20.1-30, 30.1-40, 40.1-50, 50.1-60, 60.1-70 and >70 cm), the diameter class >70 cm DBH was contributed a maximum of 217.65 Mg (17.72%) to total AGB (ten sites), whereas a minimum was constituted by 5-10 cm DBH (39.39 Mg, 3.25 %) (Table 4).
Table 4: Contribution of diameter classes (cm) to total AGB in TDEFs of southern Coromandel coast, India. (Percentages are in parenthesis)
Diameter class (cm) | |||||||||
Site | 5-10 | 10.1-20 | 20.1-30 | 30.1-40 | 40.1-50 | 50.1-60 | 60.1-70 | >70 | Site AGB |
AU | 3.89 (5.40) | 27.64 (38.34) | 16.44 (22.80) | 10.83 (15.02) | 11.11 (15.41) | - | 2.18 (3.03) | - | 72.09 |
AM | 1.14 (1.21) | 15.35 (16.27) | 19.62 (20.79) | 20.09 (21.28) | 23.7 (25.12) | 10.47 (11.1) | - | 3.99 (4.22) | 94.36 |
JI | 1.6 (1.19) | 9.53 (7.09) | 17.07 (12.70) | 17.42 (12.96) | 18.66 (13.88) | 12.26 (9.12) | 11.66 (8.67) | 46.21 (34.39) | 134.41 |
PK | 6.67 (4.7) | 10.63 (7.49) | 16.64 (11.72) | 20.3 (14.3) | 22.94 (16.16) | 15.86 (11.17) | 14.87 (10.47) | 34.05 (23.99) | 141.96 |
PI | 6.03 (4.34) | 21.07 (15.16) | 26.88 (19.34) | 22.61 (16.26) | 22.62 (16.27) | 16.76 (12.07) | 13.49 (9.70) | 9.53 (6.86) | 138.99 |
PM | 2.77 (2.50) | 12.26 (11.06) | 17.08 (15.40) | 17.8 (16.05) | 12.43 (11.21) | 15.24 (13.75) | 11.36 (10.25) | 21.92 (19.79) | 110.86 |
TM | 3.03 (2.92) | 10.52 (10.14) | 10.93 (10.55) | 17.75 (17.12) | 14.14 (13.65) | 11.94 (11.50) | 9.95 (9.59) | 25.44 (24.53) | 103.7 |
TN | 4.97 (3.77) | 21.82 (16.55) | 28.56 (21.65) | 20.59 (15.62) | 13.51 (10.25) | 11.93 (9.05) | 9.43 (7.15) | 21.04 (15.96) | 131.85 |
TS | 1.97 (1.70) | 12.38 (10.67) | 13.09 (11.28) | 13.79 (11.89) | 21.77 (18.77) | 13.81 (11.90) | 18.44 (15.89) | 20.77 (17.90) | 116.02 |
TV | 7.32 (4.33) | 29.44 (17.42) | 29.01 (17.16) | 23.56 (13.94) | 17.73 (10.49) | 15.03 (8.89) | 12.24 (7.24) | 34.7 (20.53) | 169.03 |
Total | 39.39 (3.25) | 170.64 (14.06) | 195.32 (16.10) | 184.74 (15.23) | 178.61 (14.72) | 123.3 (10.16) | 103.62 (8.54) | 217.65 (17.94) | 1213.27 (100) |
Belowground biomass
The mean belowground biomass storage recorded as 5.24±0.14 Mg ha-1. The site TV stored higher below ground tree biomass (BGB) (32.27 Mg ha-1) followed by PK (27.66 Mg ha-1), PI (27.15 Mg ha-1) and JI (26.36 Mg ha-1); sites PM, TM and TS showed intermediate value. While, AU and AM had less amount of BGB, 15.2 and 15.44 Mg ha-1, respectively. (Table 1).
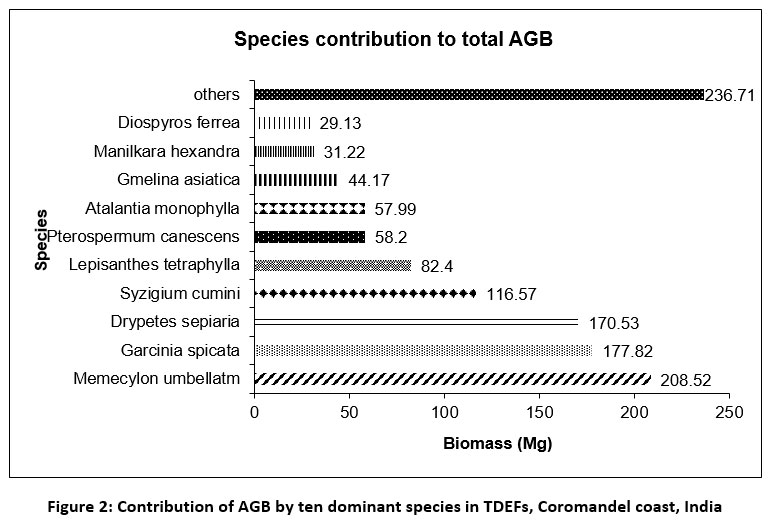 | Figure 2: Contribution of AGB by ten dominant species in TDEFs, Coromandel coast, India
|
Discussion
Species richness and basal area
Compared to the wet evergreen forests of India's Western Ghats, tropical dry evergreen forests have a comparatively higher tree stand density and are moderate in terms of species diversity and stand basal area.33 Tree diversity per unit area tends to increase when rainfall increases.34-36 TDEFs receive less annual rainfall (1100-1200 mm) than Western Ghats (>1400 mm). The total, mean and range of species richness (55 species; range 25-34; mean 28.7±2.95); tree density ha-1 (7599 individuals; range 397-1337; mean 759.9±317.49) and forest stand basal area (189.9 m2; range 10.78-26.48 m2; mean 18.99±5.05 m2) found in the present study are comparable with previous studies on TDEFs of Coromandel coast of India.19,37,38
Wood density
Trees with dense wood have reduced leaf water potential, smaller leaves, and lower mortality.29 The current study's mean WD (0.71±0.053 g cm-3) falls well within the range of WD found in Indian forests (0.232-1.280 g cm-3).29 The mean WD of the current study is relatively higher than that reported for the nation-wide mean WD recorded for Africa (0.648 g cm-3) and North America (0.540 g cm-3) and lesser than in Australia (0.725 g cm-3).29 Physiognomically, Indian TDEFs are dominated by evergreen species 16, 21. This study recorded 30 (54.55 %) evergreen tree species; their mean WD value was 0.723±0.065 g cm-3. This result complies with that of an earlier findings,39 they found dense wood in species with slow returns on investment (evergreens). Amount of soil carbon, phosphorous and nitrogen appears to be less in TDEFs.37,40 A negative correlation (wood density increases when soil fertility decreases) was obtained by many.41-43 High mean WD of present study could have contributed by less soil fertility and good proportion of evergreen species. High mean WD of present study could have contributed by less soil fertility and good proportion of evergreen species.
Above and belowground biomass storage
The stored AGB in the study area (1213.27 Mg) is relatively higher than that reported earlier,17 the previous study estimated a total of 1022.4 Mg AGB from ten TDEFs of Coromandel coast. The total AGB of this study was estimated from the basal areas of 189.9 m2 (ten sites) compared to 218.3 m2 basal areas quantified by them. It could be reasoned for arriving a higher AGB in our study that the present study considered WD and height (H), whereas, they used only basal area to estimate AGB in a similar forest type. Further, the mean total biomass storage of present study area is higher than in average total biomass storage of tropical dry deciduous forests of India (93.8 Mg ha-1).44
A total of 240.17 Mg of BGB estimated from ten TDEFs, and shoot to root ratio and percentage of BGB were 5.024 (range 4.74 to 5.24), and 19.91 (range 19.09 to 21.08 %), respectively. It is complying with the original findings31 (range 18–30 %) who suggested a generalized regression equation to estimate BGB in forest ecosystems. Results on BGB showed that percentage of (19-21%) accumulation of BGB in TDEFs is higher than that of other forest types of India. A group of researchers from India45 reported 5, 6.4, 9.3, 10.7 and 12.1 % BGB, respectively, from southern thorn forests, Euphorbia scrub, evergreen scrub, deciduous and secondary deciduous forests, respectively.
Carbon storage of trees
The mean carbon storage value (72.67±16.28 Mg C ha-1) of present study area is greater than what has been reported for tropical (44.3 Mg C ha-1), sub-tropical (40.5 Mg C ha-1) and alpine (45.3 Mg C ha-1);46 mangrove (28.24 Mg C ha-1), Dipterocarp (28.00 Mg C ha-1) and Sal (24.07 Mg C ha-1) forests of India.47 The average C storage of our study area is comparable with area weighted average C storage of world’s forest (70 Mg C ha-1).48
Conclusion
TDEFs accumulate higher AGB and BGB in its vegetation when compared to other dry forests of India. Considering its moderate biodiversity and restricted geographical extension, conservation and protection measures are needed to protect/preserve these valuable forest sites. Data obtained from this study could be useful as a tool for foresters, forest managers and ecologists to select indigenous species for afforestation and re-forestation programmes. The present study contributes substantial amount of essential information on biomass and C storage of TDEFs. However, long-term studies are needed to evaluate annual biomass and C sequestration potential of TDEFs in southern Coromandel Coast, India.
Acknowledgement
We are thankful to the local people and temple authorities of sacred groves of Nagapattinam and Thiruvarur districts, Tamil Nadu for their invaluable assistance and support during field surveys.
Funding Sources
This study was funded by Science and Engineering Research Board, Department of Science and Technology, GoI through Core Research Grant (CRG/2019/003148).
Conflict of Interest
The author(s) do not have any conflict of interest
Data Availability Statement
The manuscript incorporates all datasets produced or examined throughout this research study.
Ethics Statement
This research did not involve human participants, animal subjects, or any material that requires ethical approval.
Informed Consent Statement
This study did not involve human participants, and therefore, informed consent was not required.
Authors’ Contribution
MU designed and conceptualized the study. MU and JE conducted field surveys, collection and estimation of biomass from study area. JE prepared the first draft of the manuscript; MU corrected and revised it.
References
- Dixon R. K, Solomon A. M, Brown S, Houghton R. A, Trexier M. C, Wisniewski J. Carbon pools and flux of global forest ecosystems. Science. 1994;263:185-190.
CrossRef - Keenan T. F, Williams C. A. The terrestrial carbon sink. Annu Rev Environ Res. 2018; 43:219-243.
CrossRef - Brown S, Iverson L. R, Prasad A, Liu D. Geographical distributions of carbon in biomass and soils of tropical Asian forests. Geocarto Int. 1993; 8:45-59.
CrossRef - Usuga J. C, Toro J. A, Alzate M. V, Tapias Á. D. Estimation of biomass and carbon stocks in plants, soil and forest floor in different tropical forests. Forest Ecol Manag. 2010; 260:1906-1913.
CrossRef - Vogt K. A, Vogt D. J, Palmiotto P. A, Boon P, O’Hara J, Asbjornsen H. Review of root dynamics in forest ecosystems grouped by climate, climatic forest type and species. Plant Soil. 1996; 187:159-219.
CrossRef - Chave J, Rejou-Mechain M, Burquez A, Chidumayo E, Colgan M. S, Delitti W. B. C, Duque A, Eid T, Fearnside P. M, Goodman R. C, Henry M. Improved allometric models to estimate the aboveground biomass of tropical trees. Glob Change Biol. 2014; 20:3177-3190.
CrossRef - IPCC, (Intergovernmental Panel on Climate Change) Special report on land use, land-use change and forestry, Summary for policy makers, Geneva. 2000; 20.
- Malhi Y, Meir P, Brown, S. Forests, carbon and global climate. Philos Trans Math Phys Eng Sci. 2002; 360:1567-1591.
CrossRef - Champion H. G, Seth S. K. A revised survey of the forest types of India. Manager of publications, Delhi, India. 1968. pp 404.
- Blanchflower P. Restoration of the tropical dry evergreen forest of peninsular India. Biodivers. 2005; 6:17-24.
CrossRef - Everard M. The characteristics, representativeness, function and conservation importance of tropical dry evergreen forest on India’s Coromandel Coast. J Threat Taxa. 2018; 10:11760-11769.
CrossRef - Ramanujam M. P, Kumar P, Cyril K. Woody species diversity of four sacred groves in the Pondicherry region of south India. Biodivers Conserv. 2003; 12:289–299.
CrossRef - Wikramanayake E. D. Terrestrial Ecoregions of the Indo-Pacific: A Conservation Assessment. Island Press, Washington; 2002.
- Rajan S. A. The avifauna of the tropical dry evergreen forests of Point Calimere Wildlife Sanctuary, Tamil Nadu. Buceros 2001; 6:33–35.
- Mani M. S. Biogeography of the Peninsula. In Ecology and biogeography in India, Dordrecht: Springer Netherlands; 1974. p 614-647.
CrossRef - Udayakumar M, Parthasarathy N. Angiosperms, tropical dry evergreen forests of southern Coromandel coast, Peninsular India. Check List. 2010; 6:368-381.
CrossRef - Mani S, Parthasarathy N. Above-ground biomass estimation in ten tropical dry evergreen forest sites of peninsular India. Biom Bioe. 2007; 31:284-290.
CrossRef - Narayanasamy D, Natesan B. Endemic Vascular Plants from the Coromandel Coast of Tamil Nadu, Southern India. In: Kumar S. (eds) Endangered Plants. Intech Open. 2020; 89-106.
CrossRef - Mani S, Parthasarathy N. Biodiversity assessment of trees in five inland tropical dry evergreen forests of peninsular India. Syst Biodivers. 2005; 3:1-12.
CrossRef - Mani S and Parthasarathy N. Tree population and above-ground biomass changes in two disturbed tropical dry evergreen forests of peninsular India. Trop Ecol. 2009; 50:249-258.
- Parthasarathy N, Selwyn M. A, Udayakumar M. Tropical dry evergreen forests: ecology and conservation significance. Trop Conserv Sci. 2008; 1: 89-110.
CrossRef - Udayakumar M, Sekar T. Leaf traits of trees in tropical dry evergreen forests of peninsular India. Ecologies. 2021; 2:268-284.
CrossRef - Udayakumar M, Sekar T. Estimation of leaf area–wood density traits relationship in tropical dry evergreen forests of Southern Coromandel Coast, Peninsular India. In: Pandey K, Ramakantha V, Chauhan S, Arun Kumar A. (eds) Wood is Good: Current Trends and Future Prospects in Wood Utilization Springer Singapore. 2017; 169-187.
CrossRef - Udayakumar, M. Ecological Studies on Selected Tropical Dry Evergreen Forests of Southern Coromandel Coast, Peninsular India. PhD Dissertation, University of Madras, Chennai, India. 2015.
- Naveen Babu K, Harpal B, Parthasarathy N. Changes in tree diversity and carbon stock over a decade in two Indian tropical dry evergreen forests. Geol Ecol Landsc. 2021; 5:7-18.
CrossRef - Mani S, Parthasarathy N. Tree diversity and stand structure in inland and coastal tropical dry evergreen forests of peninsular India. Curr Sci. 2006; 90:1238-1246.
- Phillips O. L, Baker T, Feldspauch T, Brienen R. J. Field manual for plot establishment and remeasurement (RAINFOR). Amazon Forest Inventory Network, Sixth Framework Programme (2002–2006). 2002.
- Zanne A. E, Lopez-Gonzalez G, Coomes D. A, Ilic J, Jansen S, Lewis S. L, Miller R. B, Swenson N. G, Wiemann M. C, Chave J. Global wood density data-base. Dryad. 2009. Available at: http://hdl. handle. net/10255/dryad, 235.
- Chave J, Coomes D, Jansen S, Lewis S. W, Swenson N. G, Zanne A. E. Towards a worldwide wood economics spectrum. Ecol Lett. 2009; 12:351-66.
CrossRef - Williamson G. B, Wiemann M. C. Measuring wood specific gravity… correctly. Am J Bot. 2010; 97:519-524.
CrossRef - Cairns M. A, Brown S, Helmer E. H, Baumgardner G. A. Root biomass allocation in the world’s upland forests. Oecologia. 1997; 111:1-11.
CrossRef - Petersson H, Holm S, Ståhl G, Alger D, Fridman J, Lehtonen A, Lundström A, Mäkipää R. Individual tree biomass equations or biomass expansion factors for assessment of carbon stock changes in living biomass–A comparative study. For Ecol Manag. 2012; 270:78-84.
CrossRef - Parthasarathy N, Selwyn M. A, Udayakumar M. Tropical dry evergreen forests: ecology and conservation significance. Trop Conserv Sci. 2008; 1: 89-110.
CrossRef - Gentry A. H. Patterns of neotropical plant-species diversity. In: Hecht M. K, Wallace B, Prance G. T. (eds) Evolutionary Biology. Boston: Springer. 1982; 1-84.
CrossRef - Wright I. J. Seasonal drought, soil fertility and the species density of tropical forest plant communities. Trend Ecol Evol. 1992; 7:260-263.
CrossRef - Specht A, Specht R. L. Species richness and canopy productivity of Australian plant communities. Biodivers Conserv. 1993; 2:152-167.
CrossRef - Parthasarathy N, Karthikeyan R. Plant biodiversity inventory and conservation of two tropical dry evergreen forests on the Coromandel coast, south India. Biodivers Conserv. 1997; 6:063-1083.
CrossRef - Venkateswaran R, Parthasarathy N. Tropical dry evergreen forests on the Coromandel coast of India: structure, composition and human disturbance. Ecotropica. 2003; 9:45-58.
- Wright I. J, Ackerly D. D, Bongers F, Harms K. E, Ibarra-Manriquez G, Martinez-Ramos M, Mazer S. J, Muller-Landau H. C, Paz H, Pitman N. C, Poorter L. Relationships among ecologically important dimensions of plant trait variation in seven Neotropical forests. Ann Bot. 2007; 99:1003-1015.
CrossRef - Visalakshi N. Fine root dynamics in two tropical dry evergreen forests in southern India. J Biosci 1994; 19: 103-116.
CrossRef - Baker T. R, Phillips O. L, Malhi Y, Almeida S, Arroyo L, Di Fiore A, Erwin T, Killeen T. J, Laurance S. G, Laurance W. F, Lewis S. L. Variation in wood density determines spatial patterns in Amazonian forest plots. Glob Change Biol. 2004; 10:545-562.
CrossRef - Patino S, Lloyd J, Paiva R, Baker T. R, Quesada C. A, Mercado L. M, Schmerler J, Schwarz M, Santos A. J. B, Aguilar A, Alvarez Z. Branch xylem density variations across Amazonia. Biogeosci Discuss. 2003; 5:2003-2047.
- ter Steege H, Pitman N. C, Phillips O. L. Continental-scale patterns of canopy tree composition and function across Amazonia. Nature. 2006; 443:444-447.
CrossRef - Ravindranath N. H, Somashekhar B. S, Gadgil M. Carbon flow in Indian forests. Clim Change. 1997; 35:297-320.
CrossRef - Ramachandran A, Jayakumar S, Haroon R. M, Bhaskaran A, Arockiasamy D. I. Carbon sequestration: estimation of carbon stocks in natural forests using geo-spatial technology in the Eastern Ghats of Tamil Nadu, India. Curr Sci. 2007; 92:323-31.
- Haripriya G. S. Estimates of biomass in Indian forests. Biom and Bioe. 2000; 19:245-258.
CrossRef - Manhas R. K, Negi J. D. S, Kumar R, Chauhan P. S. Temporal assessment of growing stock, biomass and carbon stock of Indian forests. Clim Change. 2006; 74:191-221.
CrossRef - Houghton R. A, Lawrence K. L, Hackler J. L, Brown S. The spatial distribution of forest biomass in the Brazilian Amazon: a comparison of estimates. Glob Change Biol 2001; 7: 731-746.
CrossRef


