Assessment of Relationship Between Meteorological Parameters and Air Quality Index of Kota, Rajasthan, India
Kuldeep Kamboj
*
 and Anil K. Mathur
1
Civil Engineering Department,
University Department, Rajasthan Technical University,
Kota,
Rajasthan
India
http://dx.doi.org/10.12944/CWE.18.1.22
Copy the following to cite this article:
Kamboj K, Mathur A. K. Assessment of Relationship Between Meteorological Parameters and Air Quality Index of Kota, Rajasthan, India. Curr World Environ 2023;18(1). DOI:http://dx.doi.org/10.12944/CWE.18.1.22
Copy the following to cite this URL:
Kamboj K, Mathur A. K. Assessment of Relationship Between Meteorological Parameters and Air Quality Index of Kota, Rajasthan, India. Curr World Environ 2023;18(1).
Download article (pdf) Citation Manager Publish History

Introduction
The presence of air pollutants in the ambient air is a versatile global issue in metropolitan areas due to its adverse effects on the environment and humans1,2. Oxides of nitrogen (NOx), sulphur dioxide (SO2), particulates (PM10 and PM2.5), Ozone (O3), and carbon monoxide (CO) are the primary air pollutants that originated through anthropogenic activities3–5. These pollutants coexist in the gaseous medium, the atmosphere, with a greater affinity for interacting with each other and enhancing their adverse effects due to synergistic effects6–8.
The major health effects of air pollutants on human beings are mortality due to ALRI, Stroke, COPD, IHD, Lung Cancer, and all-natural causes9–14. Aggravation of respiratory disease, reduction in pulmonary functions, wheezing, surrogate for eye irritation, breath shortness, and chest constriction are the short-term effects of air pollutants15–20.
Oxides of sulphur and nitrogen are the principal cause of acid rain. Acid fog and clouds with very low pH levels damage the fauna on the earth's surface9,21. The plant's ability to extract soil nutrition is seriously decreased due to acidification. Sulphates, nitrogen oxides, and dust are responsible for visibility impairment. Global historic statues and buildings are being eroded and discoloured due to their reactions with the components of acid rains 22–24.
The primary layer near to the ground level of Earth is the planetary boundary layer (PBL), and this layer exchange heat, moisture, and momentum with the earth's surface. The atmospheric stability significantly affects the dispersion of air pollutants in this layer3. The stable atmosphere was associated with scarce rainfall and weak wind speeds when the pollution arose, revealing the alleged role of air pollutants accumulation in a place22,25–30. These conditions (stable weather) close to the ground surface inhibited air pollutants' vertical diffusion. In contrast, an unstable atmosphere is associated with abundant precipitation and stronger winds when the pollution decreases. Unstable conditions of weather near the ground surface encouraged air pollutants' vertical diffusion3,4,31. Several studies reveal the importance of meteorological parameters for variation in air quality under the rare low anthropogenic pollutant emissions during covid-19 restrictions32–35.
The critical meteorological factors influencing urban air quality are wind direction, wind speed, relative humidity, and temperature34,36–39. These meteorological parameters significantly affect the air pollutant dispersion process and removal mechanisms40,41. Rainfall is an additional factor that removes gaseous pollution and particulate matter deposition through the atmospheric chemical processes25,26,42,43.
Several studies worldwide indicate the potential influence of meteorological variables on the quality of ambient air. The present study determines the impact of meteorological variables on AQI during observation period of four years (2018-2021) for the Kota metropolis. Wind speed and direction, relative humidity, precipitation, and temperature are the meteorological variables selected to determine the impact of meteorological factors on the AQI. The parameters chosen for evaluating the AQI are PM10, NO2, PM2.5, and SO2, and the CPCB prescribed method is used to determine AQI. Past studies on the Kota metropolis did not quantify the effect of meteorological parameters on the city 44,45. Hence, a prediction model has been developed using multiple regression analysis with a confidence level of 95%. This study may be beneficial for stakeholders and policymakers to consider the effect of meteorological factors on the ambient air of Kota city to make new policies and rules to curb air pollution.
Materials and Methods
Study Area and Research Methodology
The rapid and fast-growing city of Rajasthan, Kota, has been chosen to study the effects of meteorological variables on the quality of ambient air in the city. It is situated on the banks of the Chambal river and comes under the category of smart cities. Rapid urbanisation, vigorous population growth, unplanned development, increased vehicles, dynamic construction and demolition work, and lack of awareness among people had several detrimental impacts on the city's air quality22,45. The air quality of Kota city is determined through the CPCB method of air quality index (AQI) with the help of four pollutants, namely, PM10, PM2.5, SO2, and NO2. Meteorological parameters selected for the study are wind speed and direction, relative humidity, precipitation, and temperature. The correlation study with the significance level between each meteorological parameter and AQI is performed separately. A multiple regression analysis based AQI prediction model is also formulated using temperature, wind speed, and relative humidity through M.S. Excel software. The meteorological and air parameters data are collected for four years (2018-2021) from different government agencies such as CPCB and RSPCB. The study area is shown in Figure 1, and the GPS coordinates of the selected air monitor locations are tabulated in Table 1.
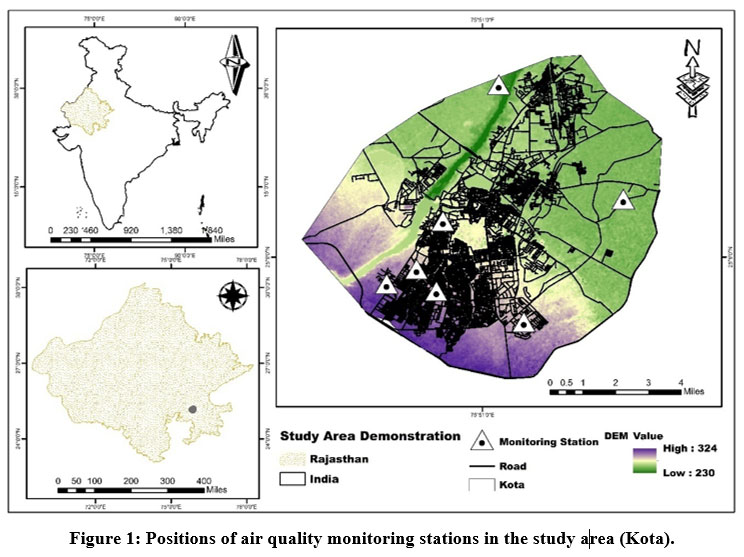 | Figure 1: Positions of air quality monitoring stations in the study area (Kota).
|
Table 1: Manual and continuous air monitoring sites in Kota, Rajasthan, India.
| Code | Operating Type | Latitude (degree) | Longitude (degree) | Description |
| SAQ1 | M | 025.13 | 075.82 | Shrinathpuram Fire Station, |
| SAQ2 | M | 025.16 | 075.83 | Municipal Corporation, CAD Circle |
| SAQ3 | M | 025.13 | 075.80 | RTU, Akelgarh |
| SAQ4 | M | 025.12 | 075.86 | Regional Office, RSPCB |
| SAQ5 | M | 025.17 | 075.91 | SGL, Nayanohra |
| SAQ6 | M | 025.22 | 075.84 | STP, Balita |
| SAQ7 | C | 025.14 | 075.82 | Stadium Shrinathpuram |
*Here M and C stands for manual and continous stations respectively.
CPCB Method for Evaluating AQI
AQI is calculated in this study as per the CPCB Method developed with the help of IIT Kanpur in October 201443,44. CPCB method of air quality index (AQI) evaluation involves (i) subindex calculation for each air pollutant using equation 1, (ii) define AQI on the basis of highest subindex among all air pollutants using equation 2. M.S. excel software is used to perform this analysis 18,29. Table 2 exhibits the AQI category based on AQI Values. The governing equation to calculate the subindex () is shown in equation 1.
Where, BPHI = Higher breakpoint concentration of pollutant,
BPLO = Lower breakpoint concentration of pollutant,
IHI = AQI corresponding to BPHI , ILO = AQI corresponding to BPLO , and
PC = concentration of air pollutants.
The maximum operator system is used to obtain the subindex of each pollutant, as shown in equation 2.
Table 2: AQI range with respective category and colour code43,44.
| AQI category | AQI Range | Colour |
| Severe | 401 to 500 | Maroon |
| Very poor | 301 to 400 | Red |
| Poor | 201 to 300 | Orange |
| Moderate | 101 to 200 | Yellow |
| Satisfactory | 51 to 100 | Green |
| Good | 0 to 50 | Light green |
Multiple Linear Regression Analysis
The stepwise multiple linear regression method is employed to determine the relationship between the selected variables of this study. This method is used when independent variables are greater than one (1), and the general equation for this method is as follows37

Where C is the regression constant, and X is the regression coefficient. The determination coefficient (R2) analysis has been done to define its predictive ability (goodness). The value of R2 varies between 0 to 1. The accuracy of predicted values derived from the regression line is measured through standard error. The t-statistic test (CI:95%) and one-way ANOVA test (?=5%) have been used as the test of significance.
Observed Data
The observation period for the study is four years, from 2018 to 2021. Total rainfall and average temperature with standard deviation are tabulated in Table 3, while Table 4 and Table 5 exhibit average relative humidity and wind speed, respectively. The highest, lowest and average concentrations of pollutants, along with standard deviation, are shown in Table 6 for each air quality monitoring site in Kota during the observation of four years. The variation in the monthly average concentrations of PM10, PM2.5, NO2, and SO2 are shown in Figure 2.
Table 3. Monthly Total Rainfall and Average Temperature Data for Kota City from 2018 to 2021.
| Month | Rainfall | Temperature | ||||||
| 2018 | 2019 | 2020 | 2021 | 2018 | 2019 | 2020 | 2021 | |
| January | 0 | 0 | 7 | 37 | 18.0±1.9 | 17.0±2.0 | 15.5±2.1 | 16.8±1.8 |
| February | 0 | 0 | 0 | 0 | 20.6±3.0 | 19.1±2.7 | 19.7±3.1 | 21.8±2.7 |
| March | 0 | 0 | 40 | 2 | 25.4±2.8 | 24.5±3.9 | 23.8±2.6 | 27.9±2.7 |
| April | 0 | 27 | 0 | 0 | 31.2±2.9 | 32.7±3.3 | 31.3±1.9 | 31.8±1.7 |
| May | 3 | 2 | 0 | 27 | 38.0±1.5 | 34.8±1.9 | 35.1±2.4 | 32.1±2.8 |
| June | 84 | 107 | 85 | 18 | 34.5±3.2 | 34.7±3.9 | 31.6±1.9 | 32.4±1.9 |
| July | 162 | 491 | 94 | 262 | 29.7±1.7 | 29.4±2.2 | 30.8±1.1 | 30.4±2.4 |
| August | 309 | 553 | 179 | 680 | 28.8±1.1 | 27.3±1.1 | 28.1±1.1 | 28.1±1.7 |
| September | 127 | 436 | 106 | 208 | 28.5±2.3 | 27.2±1.3 | 29.6±1.5 | 27.7±1.2 |
| October | 0 | 14 | 0 | 43 | 30.3±2.3 | 26.4±1.4 | 28.3±1.8 | 27.2±2.2 |
| November | 0 | 7 | 3 | 41 | 29.7±7.0 | 23.6±1.7 | 21.3±2.1 | 21.1±2.0 |
| December | 0 | 0 | 0 | 20 | 18.3±2.3 | 15.7±2.9 | 18.2±3.3 | 16.9±1.9 |
Table 4: Mean Relative Humidity for Kota City during observation period.
| Month | Relative Humidity | |||
| 2018 | 2019 | 2020 | 2021 | |
| January | 47.9±08.8 | 55.3±08.6 | 68.5±13.7 | 72.5±11.8 |
| February | 42.0±09.5 | 50.1±10.8 | 59.3±10.0 | 55.3±08.8 |
| March | 30.2±11.2 | 35.6±10.8 | 61.8±11.3 | 40.6±11.4 |
| April | 22.9±10.6 | 23.1±13.0 | 41.7±05.3 | 24.5±07.5 |
| May | 16.9±07.4 | 21.9±06.0 | 40.6±10.2 | 37.2±17.0 |
| June | 45.1±18.9 | 40.2±19.8 | 70.9±07.8 | 47.8±08.6 |
| July | 74.9±10.9 | 71.0±12.9 | 80.6±05.3 | 65.3±14.6 |
| August | 77.6±09.9 | 83.9±06.3 | 90.7±04.5 | 75.5±11.5 |
| September | 71.4±15.2 | 83.7±04.5 | 78.5±06.7 | 81.9±06.6 |
| October | 37.7±05.9 | 57.9±10.6 | 50.9±08.0 | 58.7±13.8 |
| November | 43.3±08.2 | 60.0±07.7 | 61.5±06.2 | 60.4±17.5 |
| December | 50.0±06.6 | 66.4±08.8 | 62.9±09.7 | 69.9±10.8 |
Table 5: Monthly Average Wind Speed for Kota City from 2018 to 2021.
| Month | Wind Speed | |||
| 2018 | 2019 | 2020 | 2021 | |
| January | 0.96±0.2 | 0.99±0.2 | 1.04±0.2 | 0.97±0.3 |
| February | 1.28±0.4 | 1.24±0.2 | 1.01±0.2 | 0.92±0.2 |
| March | 1.25±0.2 | 1.26±0.2 | 1.26±0.4 | 1.29±0.5 |
| April | 1.26±0.3 | 1.36±0.4 | 1.23±0.3 | 1.19±0.2 |
| May | 1.54±0.4 | 1.64±0.4 | 1.75±0.4 | 1.55±0.3 |
| June | 2.07±0.5 | 1.85±0.5 | 1.72±0.4 | 1.89±0.3 |
| July | 1.94±0.4 | 1.69±0.4 | 1.58±0.4 | 1.66±0.3 |
| August | 1.82±0.3 | 1.65±0.5 | 1.48±0.2 | 1.65±0.3 |
| September | 1.74±0.5 | 1.34±0.3 | 1.38±0.2 | 1.25±0.3 |
| October | 1.00±0.2 | 0.90±0.2 | 1.05±0.3 | 0.95±0.2 |
| November | 0.79±0.1 | 0.85±0.2 | 0.81±0.2 | 0.62±0.1 |
| December | 0.86±0.1 | 0.86±0.2 | 0.82±0.2 | 0.73±0.2 |
Table 6: Annual Maximum, Minimum, and Average concentration along with standard deviation for each selected pollutant at each monitoring site during the study period.
| PM10 | |||||||
| Parameter | SAQ1 | SAQ2 | SAQ3 | SAQ4 | SAQ5 | SAQ6 | SAQ7 |
| Maximum (µg/m3) | 203.00 | 178.00 | 318.00 | 258.00 | 206.00 | 209.00 | 197.77 |
| Minimum (µg/m3) | 46.00 | 45.00 | 54.00 | 58.00 | 36.00 | 40.00 | 37.52 |
| Average (µg/m3) | 110.13 | 115.77 | 125.40 | 150.79 | 120.79 | 125.08 | 110.19 |
| Standard Deviation | 40.89 | 34.90 | 60.46 | 52.23 | 39.69 | 39.90 | 40.69 |
| PM2.5 | |||||||
| Parameter | SAQ1 | SAQ2 | SAQ3 | SAQ4 | SAQ5 | SAQ6 | SAQ7 |
| Maximum (µg/m3) | 142.04 | 124.55 | 165.26 | 170.73 | 144.14 | 84.22 | 120.94 |
| Minimum (µg/m3) | 22.14 | 14.36 | 26.63 | 23.95 | 17.33 | 19.25 | 18.79 |
| Average (µg/m3) | 51.61 | 55.72 | 57.74 | 71.53 | 57.29 | 52.17 | 51.76 |
| Standard Deviation | 23.08 | 23.54 | 29.15 | 31.09 | 24.65 | 20.21 | 22.54 |
| NO2 | |||||||
| Parameter | SAQ1 | SAQ2 | SAQ3 | SAQ4 | SAQ5 | SAQ6 | SAQ7 |
| Maximum (µg/m3) | 35.62 | 34.25 | 35.76 | 33.25 | 32.52 | 33.34 | 51.51 |
| Minimum (µg/m3) | 12.49 | 12.49 | 12.49 | 12.49 | 12.49 | 19.38 | 9.00 |
| Average (µg/m3) | 25.53 | 25.22 | 24.89 | 25.27 | 24.02 | 25.96 | 23.48 |
| Standard Deviation | 4.28 | 4.29 | 4.16 | 4.42 | 3.52 | 4.23 | 10.04 |
| SO2 | |||||||
| Parameter | SAQ1 | SAQ2 | SAQ3 | SAQ4 | SAQ5 | SAQ6 | SAQ7 |
| Maximum (µg/m3) | 10.62 | 10.40 | 10.89 | 10.70 | 10.04 | 7.95 | 21.56 |
| Minimum (µg/m3) | 5.46 | 5.51 | 5.65 | 5.89 | 5.86 | 5.45 | 4.31 |
| Average (µg/m3) | 6.97 | 7.15 | 6.98 | 7.18 | 7.04 | 6.41 | 10.01 |
| Standard Deviation | 1.31 | 1.35 | 1.27 | 1.27 | 1.16 | 0.66 | 2.64 |
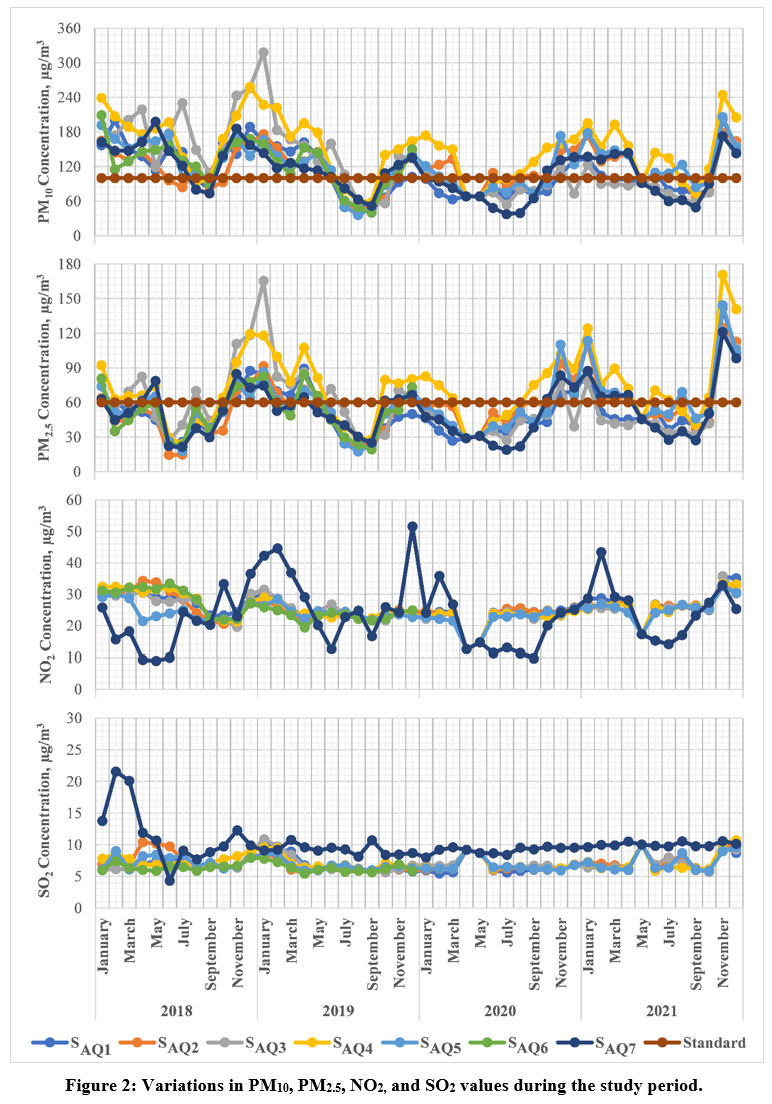 | Figure 2: Variations in PM10, PM2.5, NO2, and SO2 values during the study period.
|
Results and Discussion
Variability in the concentration of PM10, PM2.5, NO2, and SO2
The annual average concentration of PM10 was 153 ± 32 µg/m3, 119 ± 40 µg/m3, 97 ± 23 µg/m3, and 119 ± 34 µg/m3 in 2018, 2019, 2020, and 2021, respectively. The range of pollutant concentration was 73-258 µg/m3(2018), 36-318 µg/m3 (2019), 38-174 µg/m3 (2020), and 49-244 µg/m3 (2021). The annual PM2.5 concentration in 2018, 2019, 2020, and 2021 were 55 ± 18 µg/m3, 58 ± 20 µg/m3, 50 ± 15 µg/m3, and 67 ± 27 µg/m3, respectively. The PM2.5 concentration range was 14-119 µg/m3 in 2018, 17-165 µg/m3 in 2019, 19-110 µg/m3 in 2020, and 27-170 µg/m3 in 2021. The annual permissible limits for PM10 and PM2.5 are 60 and 40, respectively, as per CPCB guidelines. PM10 and PM2.5 are the main reasons behind the continuous deterioration in the city's air quality, as both were continuously violating the Indian standards prescribed by the CPCB. Vehicular emissions, construction, and demolition works, power plant emissions, cement plant, stone cutting industries, open burning, stubble burning, and natural dust, significantly contribute to particulate matter pollution in the city 42–45.
The annual NO2 concentration was 26 ± 4 µg/m3 in 2018, 25 ± 3 µg/m3in 2019, 22 ± 3 µg/m3in 2020, and 26 ± 4 µg/m3 in 2021. The concentration of NO2 varies in between 9-37 µg/m3 (2018), 12-52 µg/m3 (2019), 10-36 µg/m3(2020), and 14-43 µg/m3 (2021). The annual concentration of SO2 was 8 ± 2 µg/m3, 7 ± 1 µg/m3, 7 ± 1 µg/m3, and 8 ± 1 µg/m3 in 2018, 2019, 2020, and 2021, respectively. The range of pollutant variation is between 4 -22 µg/m3 for 2018, 5-11 µg/m3 for 2019, 5-10 µg/m3 for 2020, and 6-11 µg/m3 for 2021. The annual NO2 and SO2 standards are 40 and 50 µg/m3, respectively, and both air parameters were well under the prescribed Indian limits and can't be considered air pollutants.
The concentration of each parameter goes down in the rainy season due to precipitation in the southwest monsoon season. The highest concentrations of air quality parameters were observed in Winter, followed by Summer and Rainy seasons, except in 2020, as the lockdown restriction prevails this year. This variation in the concentration of air quality parameters majorly depends on the meteorological parameters in these seasons. The stable atmospheric conditions prevail in the winters, while unstable atmospheric conditions in the summers and rainy seasons44,45. The difference between stable and unstable conditions in Kota may be understood with the help of Table 7.
Table 7: Variations in relative humidity, temperature, wind speed, and rainfall for Winter, Summer, and Rainy seasons.
| Parameter | Winter | Summer | Rainy |
| Relative Humidity | 42-72 | 17-71 | 38-91 |
| Temperature | 15.5-29.7 | 23.8-38 | 26.4-30.8 |
| Wind Speed | 0.6-1.3 | 1.2-2.1 | 0.9-1.9 |
| Rainfall, max (mm) | 41 | 107 | 680 |
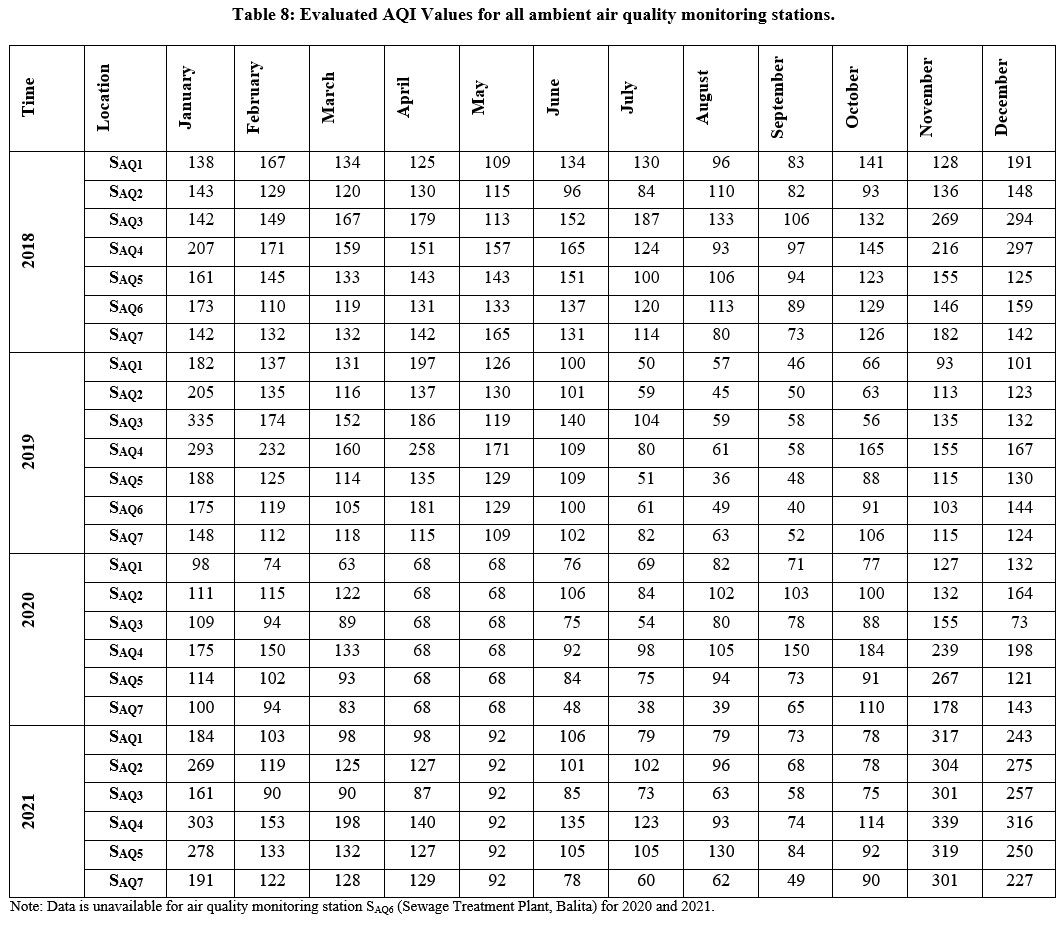
CPCB method-based AQI is classified into six categories, namely Severe (400 to 500), Very Poor (300 to 400), Poor (200 to 300), Moderately polluted (100 to 200), Satisfactory (50 to 100), and Good (0 to 50). This method of calculating AQI utilises at least three air quality parameters, one of which should be PM10 or PM2.5. A sub-index is calculated for these pollutants depending upon their measured concentration in the ambient atmosphere. AQI values on a monthly and seasonal basis for each monitoring location for 2018, 2019, 2020, and 2021 are shown in Table 8 and Table 9, respectively. The variation in the air quality index from 2018 to 2021 is graphically shown in Figure 3.
The obtained AQI values suggest that AQI varies continuously from month to month, season to season, year to year, and station to station. The lowest values of AQI levels for each monitoring site were obtained in the rainy season, followed by the summer and winter seasons. The reason was temperature, rainfall, relative humidity, and wind speed because AQI is based on pollutant concentration, and pollutant concentration is considerably affected by meteorological conditions31,43,46. The AQI varies between 73-297 in 2018, 36-335 in 2019, 38-267 in 2020, and 49-339 in 2021. Another factor that reduced AQI values in 2020 was the lockdown restriction due to Covid-19.
Table 8: Evaluated AQI Values for all ambient air quality monitoring stations.
 | Table 8: Evaluated AQI Values for all ambient air quality monitoring stations.
|
Note: Data is unavailable for air quality monitoring station SAQ6 (Sewage Treatment Plant, Balita) for 2020 and 2021.
Table 9: Station wise Air Quality Index for Air Monitoring Stations, Kota (India) on seasonal and annual basis.
| 2018 | 2019 | |||||||
| Location | Winter | Summer | Rainy | Annual | Winter | Summer | Rainy | Annual |
| SAQ1 | 148 | 126 | 114 | 129 | 119 | 125 | 55 | 104 |
| SAQ2 | 137 | 116 | 94 | 116 | 139 | 117 | 54 | 106 |
| SAQ3 | 187 | 153 | 139 | 155 | 220 | 143 | 70 | 126 |
| SAQ4 | 208 | 158 | 116 | 153 | 212 | 165 | 85 | 141 |
| SAQ5 | 144 | 143 | 106 | 131 | 133 | 118 | 56 | 105 |
| SAQ6 | 142 | 130 | 114 | 129 | 124 | 117 | 60 | 105 |
| SAQ7 | 142 | 142 | 102 | 129 | 120 | 110 | 76 | 105 |
| 2020 | 2021 | |||||||
| SAQ1 | 101 | 69 | 75 | 82 | 218 | 99 | 77 | 105 |
| SAQ2 | 140 | 95 | 98 | 93 | 243 | 112 | 86 | 127 |
| SAQ3 | 89 | 75 | 75 | 83 | 193 | 88 | 67 | 97 |
| SAQ4 | 190 | 95 | 124 | 118 | 306 | 131 | 103 | 180 |
| SAQ5 | 136 | 78 | 83 | 97 | 260 | 115 | 101 | 144 |
| SAQ7 | 110 | 67 | 64 | 82 | 210 | 109 | 65 | 106 |
Note: Data is unavailable for air quality monitoring station SAQ6 (Sewage Treatment Plant, Balita) for 2020 and 2021.
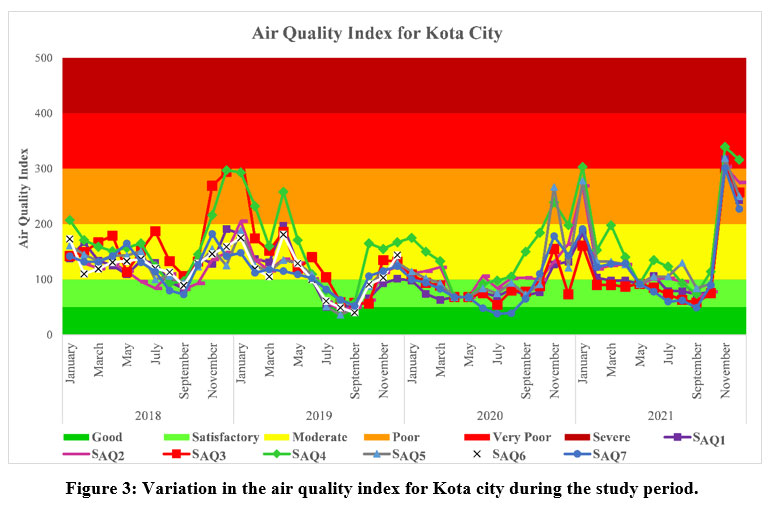 | Figure 3: Variation in the air quality index for Kota city during the study period.
|
Meteorological Parameters Affecting Air Quality
The air quality of a particular location varies tremendously daily, even at constant daily emissions due to meteorological parameters. The air quality of a region is significantly affected by these above-mentioned meteorological parameters. The relationship between AQI and Meteorological variables are shown in Figure 4.
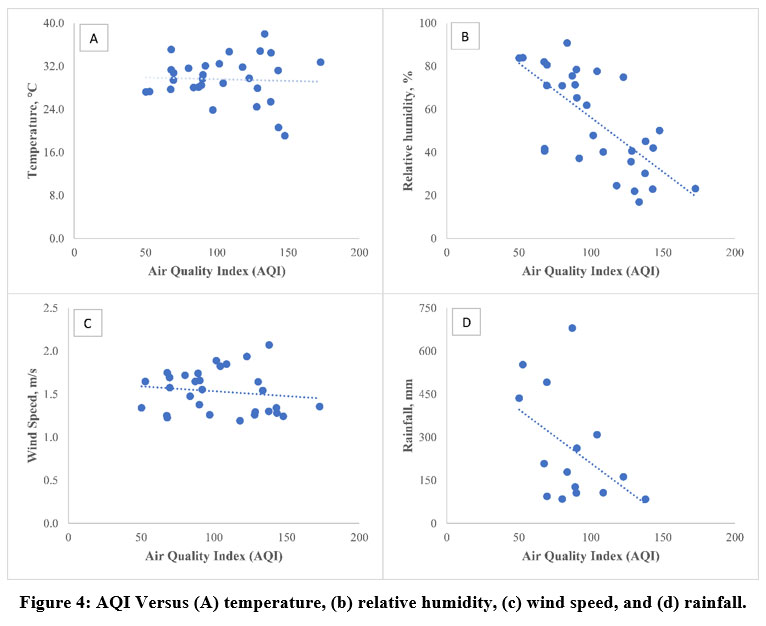 | Figure 4: AQI Versus (A) temperature, (b) relative humidity, (c) wind speed, and (d) rainfall.
|
The air quality of Kota city is also affected by these parameters. Hence, all these are considered here to determine their impact on air quality. The total rainfall in Kota city (Ladpura rainfall station) was 685, 1637, 514, and 1338 mm in 2018, 2019, 2020, and 2021, respectively. However, a significant portion of the total rainfall occurs in the rainfall season, from mid-June to September. The monsoon percentage of total rainfall in 2018, 2019, 2020, and 2021 were 99.56, 96.94, 90.36, and 87.29, respectively. The precipitation occurs in the city due to the southwest monsoon in June, July, August, and September of a calendar year.
The coefficient of correlation between rainfall and air quality index (AQI) was -0.42 [significance level (P) < 5%], which confirms a negative correlation between rainfall and air quality index (AQI), i.e., as the amount of precipitation increases, the air quality of the city gets improves or vice versa. The effect of rainfall on air quality is shown in Figure 5.
The maximum monthly average temperature was in Summer (23.8 – 38 °C), followed by the Rainy (29.4 – 30.8 °C) and Winter (15.5 – 29.7 °C) seasons. The temperature started rising in the city in March as the apparent northward movement of the Sun toward the Tropic of Cancer.
The summer season includes March, April, May, and June months. Rainfall occurred from the southwest monsoon in mid-June, resulting in a slight decrease in temperature. July, August, September, and October are the months of the Rainy season.
The Sun migrates to the southern hemisphere during the Winter season, decreasing the temperature during November, December, January, and February. The correlation coefficient between the air quality index and temperature (AQI) was -0.49 (P < 5%), which confirms a negative correlation between temperature and air quality index (AQI), i.e., as the temperature decreases, the city's air quality gets worst or vice versa. The effect of rainfall on air quality is shown in Figure 5.
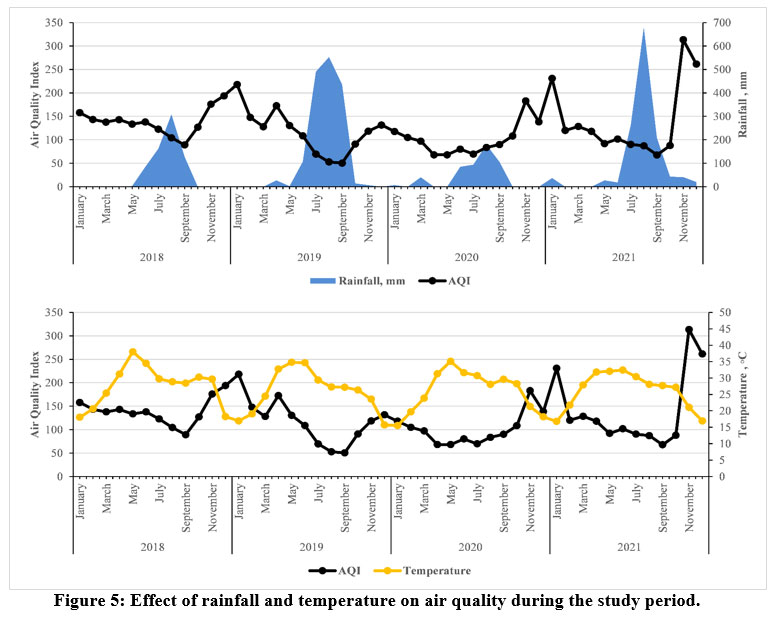 | Figure 5: Effect of rainfall and temperature on air quality during the study period.
|
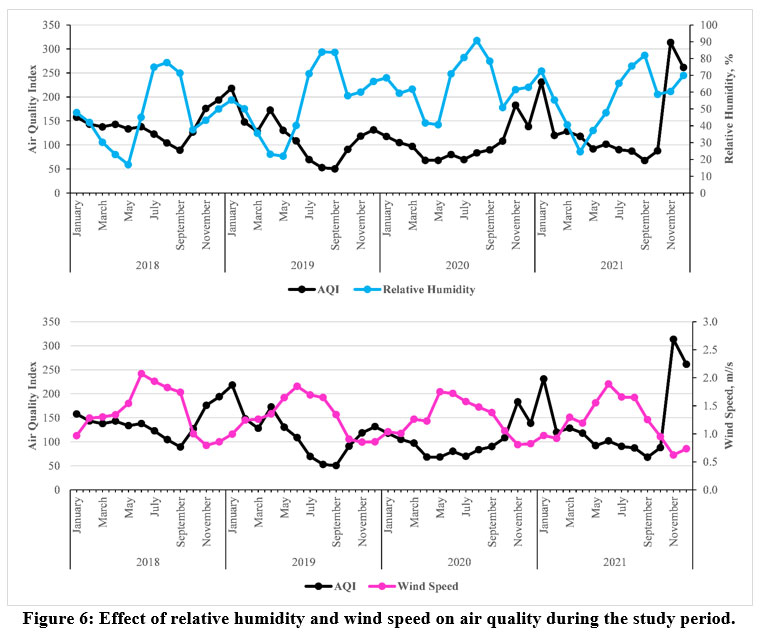
Relative humidity is the atmosphere's moisture content that can be retained at a given temperature and pressure without condensation. It is generally expressed on a percentage basis. The maximum relative humidity is found in the Rainy season (65 – 91 %), followed by Winter (42 – 73 %) and Summer (22 – 45%). It is greatly affected by temperature, rainfall, and wind speed. Hence, it has little impact on air quality [Correlation coefficient = -0.22 (P > 5%)]. The effect of relative humidity on air quality is shown in Figure 6.
 | Figure 6: Effect of relative humidity and wind speed on air quality during the study period.
|
The average wind speed in Winters, Summer, Rainy, and Annually were between 0.6 to 1.3 m/s, 1.3 to 2.1 m/s, 1.3 to 1.9 m/s, and 0.6 to 2.1 m/s, respectively. There is a little difference between seasonal wind variations, but this little difference has a massive impact on air quality. A robust negative correlation [Correlation coefficient = -0.54 (P < 5%)]) exists between wind speed and air quality, i.e., wind speed increases, dispersion, and dilution of pollutants increases, ultimately improving the air quality. The effect of wind speed on air quality is shown in Figure 6.
Developed AQI Prediction Model Through Meteorological Parameters
The AQI prediction model has been developed with the help of multiple regression analysis. Three meteorological parameters, namely, wind speed, relative humidity, and temperature, were used as independent variables to determine the dependent variable, i.e., AQI. The formulated equation to determine AQI is as follows:

Where, AQI = Air quality index,
WS= Wind speed (m/s),
RH = Relative Humidity (%) and,
T=Temperature (°C).
The regression coefficient (R-value) obtained for the above equation is 0.795, while the determination coefficient (R2 value) is 0.632, i.e., 63.2% of the total variations in AQI are determined through the linear relationship between AQI and meteorological parameters. The significance level (?) for all meteorological parameters was ? 0.05, which validates the significant relationship between AQI and selected meteorological variables. This equation holds good for wind speed ? 1.2 m/s. This equation does not consider rainfall as it only occurs in the monsoon period.
Conclusion
This study concludes that PM10 and PM2.5 are the main reasons behind the continuous deterioration in the city's air quality, as both continuously violated the Indian standards prescribed by the CPCB. The annual average concentrations of NO2 and SO2 were well under the prescribed Indian limits and couldn't be considered air pollutants. The highest AQIs were observed in Winter, followed by summer and rainy seasons, except in 2020, as the lockdown restriction prevails this year. This variation in the concentration of air quality parameters majorly depends on the meteorological parameters in these seasons. The lowest AQI values show the low concentration of air pollutants in ambient air throughout the rainy season as high temperature, intense wind speed, and wind direction work together to increase the dispersion of air pollutants in the atmosphere, while rainfall acts as the cleansing agent to wash out air pollutants from the atmosphere. This study attempts to statistically analyse the meteorological variable's impact on the air quality index of Kota city. A negative correlation was found between AQI and Temperature, AQI and Rainfall, AQI and relative humidity, and AQI and wind speed. The developed AQI prediction model is advantageous for stakeholders and researchers in the air pollution field. However, anthropogenic activities significantly affect meteorological activities and, ultimately, the accumulation of air pollutants near the ground surface, causing increased air pollution scenarios in Kota city. It may be used as the baseline study to help policymakers and stakeholders make rules, regulations and management/prevention plans for different aspects of air pollution in the city.
Acknowledgement
We are grateful to CPCB and RSPCB for providing air pollutant data for the study.
Conflict of Interest
There is no conflict of interest between the authors.
Funding Sources
There is none
References
- Sathe Y, Gupta P, Bawase M, Lamsal L, Patadia F, Thipse S. Surface and satellite observations of air pollution in India during COVID-19 lockdown: Implication to air quality. Sustain Cities Soc. 2021;66(2):102688. DOI:10.1016/j.scs.2020.102688
CrossRef - Shen L, Zhao T, Wang H, et al. importance of meteorology in air pollution events during the city lockdown for COVID-19 in Hubei Province, Central China. Sci Total Environ. 2021;754:142227. DOI:10.1016/j.scitotenv.2020.142227
CrossRef - Al-Hemoud A, Al-Sudairawi M, Al-Rashidi M, Behbehani W, Al-Khayat A. Temperature inversion and mixing height: critical indicators for air pollution in hot arid climate. Nat Hazards. 2019;97(1):139-155. DOI:10.1007/s11069-019-03631-2
CrossRef - Zhang Y. Dynamic effect analysis of meteorological conditions on air pollution: A case study from Beijing. Sci Total Environ. 2019;684:178-185. DOI:10.1016/j.scitotenv.2019.05.360
CrossRef - Ravindra K, Singh T, Mor S, et al. Real-time monitoring of air pollutants in seven cities of North India during crop residue burning and their relationship with meteorology and transboundary movement of air. Sci Total Environ. 2019;690(June):717-729. DOI:10.1016/j.scitotenv.2019.06.216
CrossRef - Feng H, Zou B, Wang J, Gu X. Dominant variables of global air pollution-climate interaction: Geographic insight. Ecol Indic. 2019;99(December 2018):251-260. DOI:10.1016/j.ecolind.2018.12.038
CrossRef - Thi Do, Chi Lan, Toan Vuduc, Linh Qha, Chien Vuvan, Huyen Vuthu. Risk Assessment For PM10 And PM2.5 In Hanoi , Vietnam?: An Ecological Study. 2020;39(4):971-979.
- Jain S, Sharma T. Social and Travel Lockdown Impact Considering Coronavirus Disease ( COVID-19 ) on Air Quality in Megacities of India?: Present Benefits , Future Challenges and Way Forward. 2020;(Ii):1222-1236.
CrossRef - Al-Thani H, Koç M, Isaifan RJ. A review on the direct effect of particulate atmospheric pollution on materials and its mitigation for sustainable cities and societies. Environ Sci Pollut Res. 2018;25(28):27839-27857. DOI:10.1007/s11356-018-2952-8
CrossRef - Salonen H, Salthammer T, Morawska L. Human exposure to NO2 in school and office indoor environments. Environ Int. 2019;130(March):104887. DOI:10.1016/j.envint.2019.05.081
CrossRef - Power AL, Tennant RK, Jones RT, et al. Monitoring Impacts of Urbanisation and Industrialisation on Air Quality in the Anthropocene Using Urban Pond Sediments. Front Earth Sci. 2018;6(September):1-18. DOI:10.3389/feart.2018.00131
CrossRef - Ansari M, Ehrampoush MH. Meteorological Correlates and AirQ+ Health Risk Assessment of Ambient Fine Particulate Matter in Tehran, Iran. Vol 170. Elsevier Inc.; 2019. DOI:10.1016/j.envres.2018.11.046
CrossRef - Khaniabadi YO, Polosa R, Chuturkova RZ, et al. Human health risk assessment due to ambient PM10 and SO2 by an air quality modeling technique. Process Saf Environ Prot. 2017;111:346-354. DOI:10.1016/j.psep.2017.07.018
CrossRef - Goel A, Saxena P, Sonwani S, et al. Health benefits due to reduction in respirable particulates during covid-19 lockdown in india. Aerosol Air Qual Res. 2021;21(5):1-16. DOI:10.4209/aaqr.200460
CrossRef - Kuldeep, Kumar P, Kamboj P, Mathur AK. Air Quality Decrement After Lockdown in Major Cities of Rajasthan , India. In: ECS Transactions. ; 2022:18479-18496. DOI:https://DOI.org/10.1149/10701.18479ecst
CrossRef - Chen J, Wang B, Huang S, Song M. The influence of increased population density in China on air pollution. Sci Total Environ. 2020;735:139456. DOI:10.1016/j.scitotenv.2020.139456
CrossRef - Kuldeep, Sisodiya S, Mathur AK, Verma P. Assessment of Urban Air Quality for Jodhpur City by the Air Quality Index (AQI) and Exceedance Factor (EF). In: Verma P, Samuel OD, Verma TN, Dwivedi G, eds. Advancement in Materials, Manufacturing and Energy Engineering, Vol. I. Springer Singapore; 2022:585-596.
CrossRef - Afghan FR, Patidar SK. Health impacts assessment due to PM2.5, PM10 and NO2 exposure in National Capital Territory (NCT) Delhi. Pollution. 2020;6(1):115-126. DOI:10.22059/POLL.2019.286454.662
CrossRef - Kuldeep Kuldeep, Shivali Sen, Sohil Sisodiya and AKM. Particulate Matter Associated Human Health Effects Determination Through AirQ + for Alwar , Rajasthan ( India ). Published online 2022. DOI:https://DOI.org/10.1149/10701.1073ecst
CrossRef - Xu H, Bechle MJ, Wang M, et al. National PM2.5 and NO2 exposure models for China based on land use regression, satellite measurements, and universal kriging. Sci Total Environ. 2019;655(2):423-433. DOI:10.1016/j.scitotenv.2018.11.125
CrossRef - Waterworth K. Acid Rain And Plant Damage - Effects Of Acid Rain On Plant Growth. 2020;(May).https://www.gardeningknowhow.com/plant-problems/environmental/acid-rain-damage.htm
- Kamboj K, Mathur AK. Environmental Risk Assessment from 2018 to 2022 for Kota, Rajasthan (India). Current World Environment Journal, 2022;17(3):698-713. DOI: http://dx.DOI.org/10.12944/CWE.17.3.18
CrossRef - Rovira J, Domingo JL, Schuhmacher M. Air quality, health impacts and burden of disease due to air pollution (PM10, PM2.5, NO2 and O3): Application of AirQ+ model to the Camp de Tarragona County (Catalonia, Spain). Sci Total Environ. 2020;703(xxxx):135538. DOI:10.1016/j.scitotenv.2019.135538
CrossRef - Kamarehie B, Ghaderpoori M, Jafari A, et al. Quantification of health effects related to SO2 and NO2 pollutants using Air quality model. J Adv Env Heal Res. 2017;5(1):44-50. http://jaehr.muk.ac.ir/article_47757.html
- Oduber F, Calvo AI, Blanco-Alegre C, et al. Links between recent trends in airborne pollen concentration, meteorological parameters and air pollutants. Agric For Meteorol. 2019;264(June 2018):16-26. DOI:10.1016/j.agrformet.2018.09.023
CrossRef - Lorenzo JSL, Tam WWS, Seow WJ. Association between air quality, meteorological factors and COVID-19 infection case numbers. Environ Res. 2021;197(March):111024. DOI:10.1016/j.envres.2021.111024
CrossRef - Kumar, Porush; Kuldeep, kuldeep; Gautam N. An assessment of ambient air quality using AQI and exceedance factor for Udaipur City , Rajasthan ( India ). Weentech Proc Energy. 2021;7(December 2020):94-106. DOI:https://DOI.org/10.32438/WPE.102021
CrossRef - Huangfu P, Atkinson R. Long-term exposure to NO2 and O3 and all-cause and respiratory mortality: A systematic review and meta-analysis. Environ Int. 2020;144(July):105998. DOI:10.1016/j.envint.2020.105998
CrossRef - Manojkumar N, Srimuruganandam B. Health effects of particulate matter in major Indian cities. Int J Environ Health Res. 2021;31(3):258-270. DOI:10.1080/09603123.2019.1651257
CrossRef - Caloiero T, Ferrari RC and E. Analysis of Monthly Rainfall Trend in Calabria ( Southern Italy ) through the Application of Statistical. Published online 2018:1-9. DOI:10.3390/proceedings2110629
CrossRef - Kamboj K, Mathur AK. Assessment of Air Quality for Kota Metropolis. Indian Journal of Environment Protection, 2023;43(1):148-162.
- Bao R, Zhang A. Science of the Total Environment Does lockdown reduce air pollution?? Evidence from 44 cities in northern China. Sci Total Environ. 2020;731(1954):139052. DOI:10.1016/j.scitotenv.2020.139052
CrossRef - Lokhandwala S, Gautam P. Indirect impact of COVID-19 on environment: A brief study in Indian context. Environ Res. 2020;188(April):109807. DOI:10.1016/j.envres.2020.109807
CrossRef - Chauhan RPS & A. Impact of lockdown on air quality in India during COVID-19 pandemic. Dokl Earth Sci. 2020;1(1):921-928. DOI:10.1007/s11869-020-00863-1 Impact
CrossRef - Biswal A, Singh T, Singh V, Ravindra K, Mor S. COVID-19 lockdown and its impact on tropospheric NO2 concentrations over India using satellite-based data. Heliyon. 2020;6(9):e04764. DOI:10.1016/j.heliyon.2020.e04764
CrossRef - Tobías A, Carnerero C, Reche C, et al. Science of the Total Environment Changes in air quality during the lockdown in Barcelona ( Spain ) one month into the SARS-CoV-2 epidemic. Sci Total Environ. 2020;726:138540. DOI:10.1016/j.scitotenv.2020.138540
CrossRef - Ilten N., Tülay Selici A. Investigating the impacts of some meteorological parameters on air pollution in Balikesir, Turkey. Environ Monit Assess (2008) 140:267–277. DOI 10.1007/s10661-007-9865-1
CrossRef - Lou J, Wu Y, Liu P, Kota SH, Huang L. Health Effects of Climate Change Through Temperature and Air Pollution. Curr Pollut Reports. 2019;5(3):144-158. DOI:10.1007/s40726-019-00112-9
CrossRef - Guttikunda SK, Nishadh KA, Jawahar P. Air pollution knowledge assessments (APnA) for 20 Indian cities. Urban Clim. 2019;27(August 2018):124-141. DOI:10.1016/j.uclim.2018.11.005
CrossRef - Kuldeep, Sisodiya S, Mathur AK. Environmental Risk Assessment Ascribed to Particulate Matter for Kota. In: ECS Transactions. ; 2022:543-559. DOI:https://DOI.org/10.1149/10701.0543ecst
CrossRef - Kuldeep, Sohil Sisodiya and AKM. ECS Transactions A Case Study on Human Health Risk Assessment Attributable to Particulate Matter at Kota Metropolis , Rajasthan ( India ). Published online 2022. DOI:https://DOI.org/10.1149/10701.0561ecst
CrossRef - Bahino J, Yoboué V, Galy-Lacaux C, et al. A pilot study of gaseous pollutants' measurement (NO2, SO2, NH3, HNO3 and O3) in Abidjan, Côte d'Ivoire: Contribution to an overview of gaseous pollution in African cities. Atmos Chem Phys. 2018;18(7):5173-5198. DOI:10.5194/acp-18-5173-2018
CrossRef - Kayes I, Shahriar SA, Hasan K, Akhter M, Kabir MM, Salam MA. The relationships between meteorological parameters and air pollutants in an urban environment. Glob J Environ Sci Manag. 2019;5(3):265-278. DOI:10.22034/gjesm.2019.03.01
- Kamboj K, Sisodiya S, Mathur AK, Zare A, Verma P. Assessment and Spatial Distribution Mapping of Criteria Pollutants. Water Air Soil Pollut. 2022;233(3):1-15. DOI:10.1007/s11270-022-05522-y
CrossRef - Kamboj K, Mathur AK. Air Quality Assessment with Human Health Effects for Kota. Current World Environment Journal, 2022;17(2):373-392. DOI:http://dx.DOI.org/10.12944/CWE.17.2.10
CrossRef - Kuldeep, Sisodiya S, Mathur AK. Variation in NO2 Concentrations for Kota City ( India ) Associated with. In: ECS Transactions. ; 2022:3081-3089. DOI:https://DOI.org/10.1149/10701.3081ecst
CrossRef


