Regional variations in the soil characteristics of the Ghiror block in Uttar Pradesh's Mainpuri District
Pukhraj Kumawat1
 , Yad Vir Singh1
*
 , Prem Kumar Bharteey2
 , Surajyoti Pradhan3
 , Rajesh Kumar4
 and Ashok Kumar5

1
Department of Soil Science and Agricultural Chemistry,
Institute of Agricultural Sciences, Banaras Hindu University,
Varanasi,
Uttar Pradesh
India
2
Department of Agricultural Chemistry and Soil Science,
C.C.R. (P.G.) College,
Muzaffarnagar,
Uttar Pradesh
India
3
Department of Agronomy,
Krishi Vigyan Kendra (OUAT),
Mayurbhanj-2,
Orissa
India
4
Department of Agronomy,
Kisan Post-Graduate College (Chaudhary Charan Singh University),
Simbhaoli, Hapur,
Uttar Pradesh
India
5
Department of Agricultural Chemistry and Soil Science,
Post Graduate College,
Ghazipur,
Uttar Pradesh
India
Corresponding author Email: vysingh59@rediffmail.com
DOI: http://dx.doi.org/10.12944/CWE.19.3.31
Copy the following to cite this article:
Kumawat P, Singh Y. V, Bharteey P. K, Pradhan S, Kumar R, Kumar A. Regional variations in the soil characteristics of the Ghiror block in Uttar Pradesh's Mainpuri District. Curr World Environ 2024;19(3). DOI:http://dx.doi.org/10.12944/CWE.19.3.31
Copy the following to cite this URL:
Kumawat P, Singh Y. V, Bharteey P. K, Pradhan S, Kumar R, Kumar A. Regional variations in the soil characteristics of the Ghiror block in Uttar Pradesh's Mainpuri District. Curr World Environ 2024;19(3).
Download article (pdf)
Citation Manager
Publish History
Select type of program for download
| Endnote EndNote format (Mac & Win) | |
| Reference Manager Ris format (Win only) | |
| Procite Ris format (Win only) | |
| Medlars Format | |
| RefWorks Format RefWorks format (Mac & Win) | |
| BibTex Format BibTex format (Mac & Win) |
Article Publishing History
| Received: | 2024-07-13 |
|---|---|
| Accepted: | 2024-12-09 |
| Reviewed by: | 
 Raina Arogya Trust
|
| Second Review by: |

 Fadly Hairannoor Yusran
|
| Final Approval by: | Dr. Hemant Kumar |
Introduction
Soil is the principal nutrient repository for crops. Nutrients such as macronutrients and micronutrients are important for plants in promoting growth, architecture, and different cycles1. Comparing various nutrients nitrogen is one of the major primary nutrients in plant proteins, nucleic acids, and chlorophyll. Phosphorus helps in the development of roots and is a stabilizing agent in the soil2. While potassium is crucial for improving leaf quality, enzyme operation, abdominal control, ionic balance, and disease resistance3. This is because Indian agricultural soils have become low in fertility due to one-season cultivation techniques throughout the years. Another essential attribute that requires an appraisal and a clear systematic decision is the regenerative capability of the soil because of the excessively intensive use of plant nutrients-macronutrients and micronutrients in every crop growing season. This could be due to cropping systems, frequency of manure and fertilizer application and other cultivation operations among others. Regarding this, fertility appraisal of the soil as well as the suggestion given on the kind of fertilizer to use are factors that affect the crops4. Every farm is perfect if it can be checked and assessed based on the quality of the soil on every farm. Nutrient requirements of crops, and the physical/chemical status of the soils such as pH, organic matter status, nitrogen-mineralization, total-nitrogen, and cation exchange capacity of the soils may be used to explain the utility of chemical fertilizers in the farming systems. Sustainable agriculture issues include: the burning of cones like fuel wood and charcoal through improved production methods leads to air and water pollution, pesticide residue in food, soil acidity, water resources pollution, and land degradation4,5. There is a need to determine the characteristics of soils at micro and macro scale and arrangement to establish how they pose a threat to the land and physical resources. These include fertility mapping, estimation of textural fractions as well and determination of the management zones for the area containing the land regions for agricultural management6,7 have the contention that diagnostic tools such as the soil test are instrumental in the plant nutrient information. Technologies in geographical information systems (GIS) assist in the speedy, efficient and less costly identification of the soil's terrain dynamics. Furthermore, while developing thematic soil fertility maps, it is recommended to use the Geographical Positioning System for the soil sampling8. In Andhra Pradesh, an experiment was conducted to assess soil fertility in Madanapalle block of Chittor district9, geospatial soil variability in Dhemaji district of Assam10, and soil fertility in Depalpur block of Indore district of Madhya Pradesh11. Hence, it has great importance in agriculture for the subsequent checking of the nutrient status in the different places/villages. Georeferenced maps may also be useful in gathering successive nutrition data by returning to with GPS. Using GIS technology, the present investigation evaluates the soil physico-chemical content's distribution across space in Uttar Pradesh's Mainpuri District.
Materials and Methods
Current study area: The current trial was conducted in the seven villages that together make up the Ghiror Block of the Mainpuri district (Fig. 1). The study area is situated in Eastern Uttar Pradesh which experienced a semi-arid climate. In the study area, therefore, there are several soil kinds, for example; the medium black and deep clay loamy soils. It has been observed, that the source of the town’s income is within the agricultural sector. The area is famous for the cropping of rice and wheat where the farmers use the cropping system. These include: kharif crops viz groundnuts, paddy and maize, rabi crops: wheat, mustard and gram, Zaid crops: mung-bean, urd bean and onions.
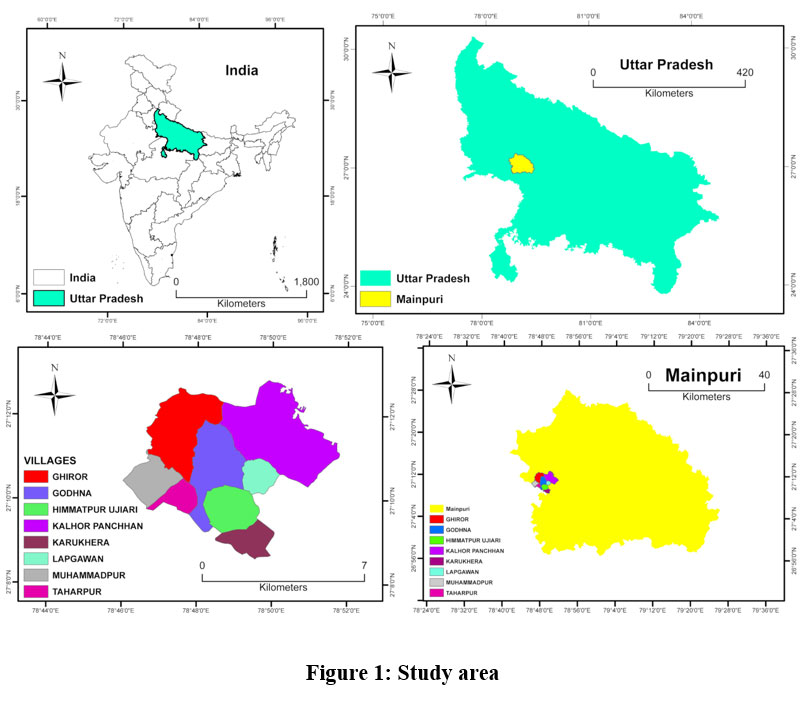 | Figure 1: Study area
|
Soil sampling, processing and analysis
Thirty-two soil samples were collected from eight villages as shown in Figure 2. A spade was employed for gatherings of soil samples. First, there was a clearing of rocks, garbage and twigs from the region. Subsequently, to a depth of 0 to 15 cm, V-structured trenches were done and the earth’s horizons are represented further. In each field, samples of soil were collected in a zigzag fashion. Miscellaneous soil samples were prepared through crushing, air drying and then sieving the samples through a 2 mm filter. A 500 g sample of dirt was taken for the analysis after which the sample was sieved before being placed in a plastic bag and stored in the laboratory. Some of the realizations are the soil’s physical and chemical characteristics. The bulk density and particle density were determined by a pycnometer12, porosity volume was calculated by employing the values of the bulk and particle densities, the water holding capacity was estimated by using the keen box technique13, organic carbon was measured using the wet oxidation method15, while electrical conductivity was assessed using a digital EC meter and pH was quantified using an electrode pH meter14, the available nitrogen was analyses by alkaline potassium permanganate method as well as Kjeltech semi-automatic nitrogen analyzer16, the available phosphorus was carried out using olsen method17, The available potassium was assayed, using a flammable photometer with normal neutral ammonium acetate as an extractant18, the levels of exchangeable calcium and magnesium versanate titration method19, the available sulphur was also analyzed using the turbimetric method by means of a spectrophotometer based on the standarad method20, the micronutrients were analyzed using atomic absorption spectrophotometer applying the DTPA method21, and the accessible boron concentration was measured using the hot water plate method. The analysis soil physicochemical properties of soil was conducted in soil science and agriculture chemistry at Banaras Hindu University, Varanasi, Uttar Pradesh.
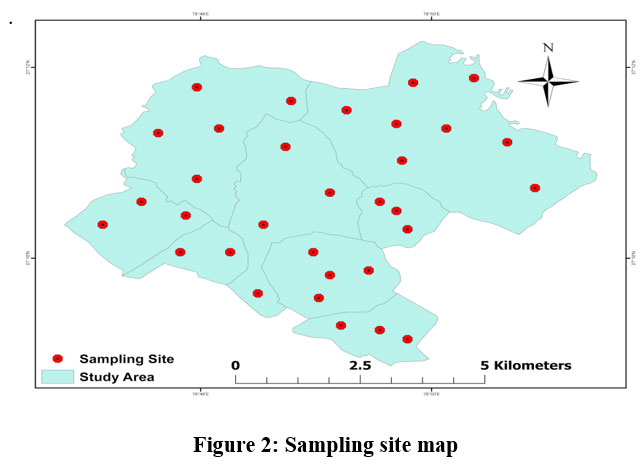 | Figure 2: Sampling site map
|
Nutrient index evaluation
The soil nutrient index was computed and obtained from the percentage distribution of the data obtained from the soil test results. The nutrient index was categorized as low, moderate and high22, compared to the nutritional index value of <1.5 for low, 1.5 to 2.5 for medium, and >2.5 for high23. The following equation:

Statistical analysis
Descriptive analysis was conducted on all the observational data that were recorded from all the subjects. The extent of the relationship between the given parameters, variations or dispersion of all the parameters in the soils, mean value of each block's soils were classified as having a low, moderate, or high nutritional rating. All the parameters in the soils, range of all the parameters in the soils, average variation of all the parameters in the soils, standard error of all the parameters in the soils and coefficient of variation of all the parameters in the soils were calculated. The coefficient of variation was calculated by using the following formula: The statistical parameters were calculated with the help of Microsoft excel 2016 and correlation by SPSS 21.1.

As for the value of the second variable, to find out the corelation-coefficient the following formula was applied:24.

Where r is a correlation coefficient and SP (xy) is the sum of the variables x and y.
SS (x) = x variable's total of all square
SS (y) = y variable's total of the square.
Results and Discussions
Status of physico-chemical properties
Table 1 represents the soil physical and chemical status of the studied region; the variation of soil bulk and particle density is 1.13-1.54 mg m-3 and 2.33-2.78 mg m-3, respectively, with a mean of 1.29 mg m-3 and 2.49 mg m-3; and the WHC of soil varied from 32.75-48.75 per cent, with an average value of 41.24 per cent. Fine texture soil has a higher variability of soil parameters such as bulk density (CV=6.68 per cent), particle density (CV=3.68 per cent), and WHC (CV=9.14 per cent). Similar findings were in the soils of Pantnagar, Uttarakhand by Pandey25. Farmers' field surface soils have a pH range of 7.45 to 9.9. Out of thirty-two soil samples, 46.88 percent of the earth had an alkaline reaction, while 53.12 per cent were somewhat alkaline. The electrical conductivity of the studied area ranges from 0.12-0.64 dS m-1. Most samples have low organic carbon. It ranges from 0.13-0.47 per cent with a mean of 0.27 per cent. All the soil samples are low range (100 per cent) in organic carbon content26. The variability of soil parameters viz., pH (CV=5.43 per cent), electrical conductivity (CV=42.49 per cent) and organic carbon (CV=40.66 per cent), there are low application organic residues, climatic conditions, and low microbial activity in the study area. Similar findings were also presented in Prayagraj, Uttar Pradesh27. The distributions of physico-chemical spatial variability are shown in Fig. 3.
Table 1: Statistical evaluation of soil physical and chemical characteristics of the study area
Parameters, | Range | Mean | SD | C.V. (%) |
B.D. (g cm-3) | 1.16-1.54 | 1.29 | 0.08 | 6.68 |
P.D. (g cm-3) | 2.33-2.78 | 2.49 | 0.09 | 3.68 |
Porosity (%) | 39.75-55.75 | 53.02 | 3.8 | 7.17 |
W.H.C. (%) | 32.75-48.75 | 41.24 | 3.77 | 9.14 |
Soil reaction (pH) | 7.45-9.90 | 7.98 | 0.43 | 5.43 |
E.C. (dS m-1) | 0.12-0.64 | 0.44 | 0.11 | 42.49 |
Organic-C (%) | 0.13-0.47 | 0.27 | 0.1 | 40.66 |
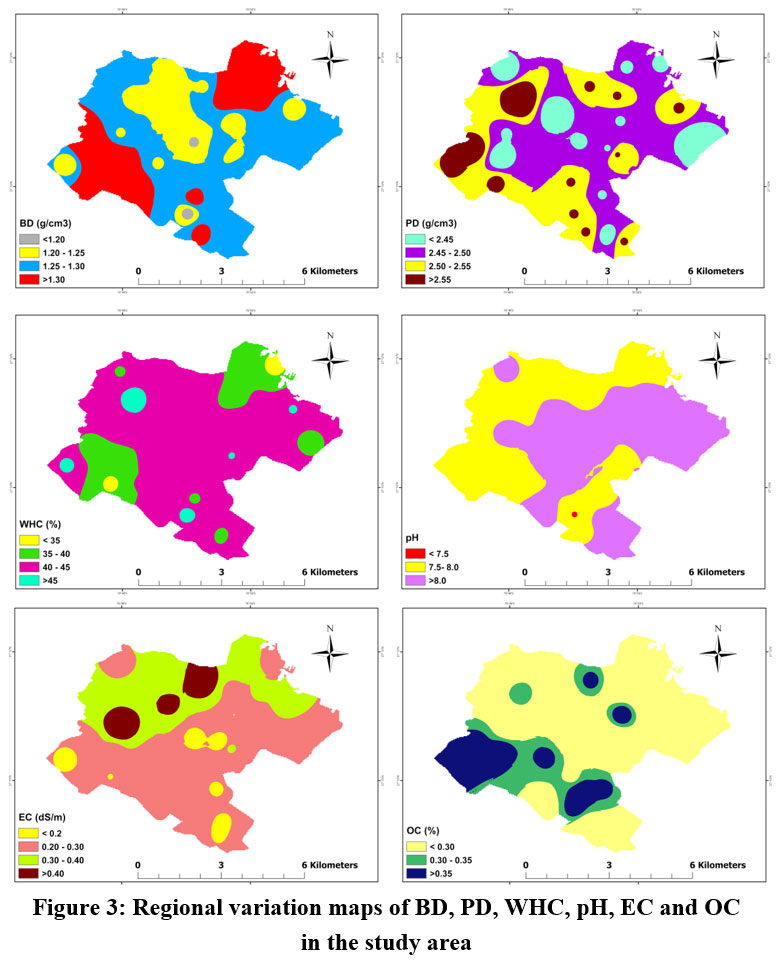 | Figure 3: Regional variation maps of BD, PD, WHC, pH, EC and OC in the study area
|
Status of primary and secondary nutrients
Table 2 presents a comprehensive statistical analysis of soil nutrient properties, including Nitrogen, phosphorus, Potassium, and Sulfur. Nitrogen levels range from 50.17 to 213.24 kg per ha, with an average of 132.10 kg per ha, due to the low level of carbon from organic sources. The average variation is 43.45, with a CV of 32.89 per cent. According to the overall evaluation, 100 per cent of the soil samples have available nitrogen contents that fall into the low range due to low organic carbon in soil26. Similar findings regarding the amount of nitrogen that was available in the soils of Varanasi, Uttar Pradesh, India.27. Phosphorus levels range from 15.46 to 59.09 kg per ha, with a mean of 36.09 kg per ha. The average variation is 9.92, and the CV is 27.48 per cent. In terms of available phosphorus content, the overall assessment indicates that 15.62 per cent of soils come under medium range and 84.38 per cent of soils fall into the high category. Similar results were also reported,29 in the soils of Tonk district of Rajasthan. The range value of potassium is 206.12 to 460.75 kg per ha, with an average value of 245.99 kg per ha. The average variation is 71.35, and the CV is 23.82 per cent. Based on an overall assessment, the available potassium content of 59.37 per cent of the soil samples falls into the medium category, while 40.63 per cent of the samples fall into the high range. Similar findings were noted by different investigator30 in the soils of Uttar Pradesh's Bundelkhand region. Sulphur concentration levels range from 7.54 to 54.32 kg per ha, with a mean of 23.73 kg per ha. The average variation is 9.13, and the CV is 38.47 per cent. According to the overall evaluation, 3.12 per cent of soil samples fall into the low category, 28.12 per cent fall into the medium category, and 68.75 per cent fall into the high category. These results are consistent with earlier researchers31. Magnesium concentration ranges from 0.80 to 2.60 meq/100 g, with a mean value of 1.71 meq/100 g. The average variation is 0.43, and the CV is 25.05 per cent. It was discovered that every sample had enough exchangeable calcium in the Ghiror Block. The results prescribed by other scientists32 for the soils in the Madanapalle Block of Chittor are consistent with these findings. Finally, calcium concentration ranges from 2.20 to 5.60 meq/100 g, with a mean value of 3.62 meq/100 g. The average variation is 0.83, and the CV is 23.05 per cent. 3.12 per cent of soil samples had insufficient exchangeable magnesium, while 96.88 per cent of samples had enough. Similar findings were noted by earlier investigators33, who found that the Uttara Kannada district's soils had an exchangeable magnesium content ranging from 0.82 to 1.21 meq/100 g. The distributions of primary and secondary spatial variability are shown in Fig 4.
Table 2: Statistical data of available macronutrients in soils of study area
Parameters | Range | Mean | S.D. | C.V. (%) |
Avail-N. (kg. ha-1) | 50.17-213.24 | 132.1 | 43.45 | 32.89 |
Avail-P. (kg. ha-1) | 15.46-59.09 | 36.09 | 9.92 | 27.48 |
Avail-K. (kg. ha-1) | 206.12-460.75 | 299.45 | 71.35 | 23.82 |
Avail-Mg. (meq/100 g) | 2.20-5.60 | 3.62 | 0.83 | 23.05 |
Avail-Ca. (meq/100 g) | 0.80-2.60 | 1.71 | 0.43 | 25.05 |
Avail-S. (kg. ha-1) | 7.54-54.32 | 23.73 | 9.13 | 38.47 |
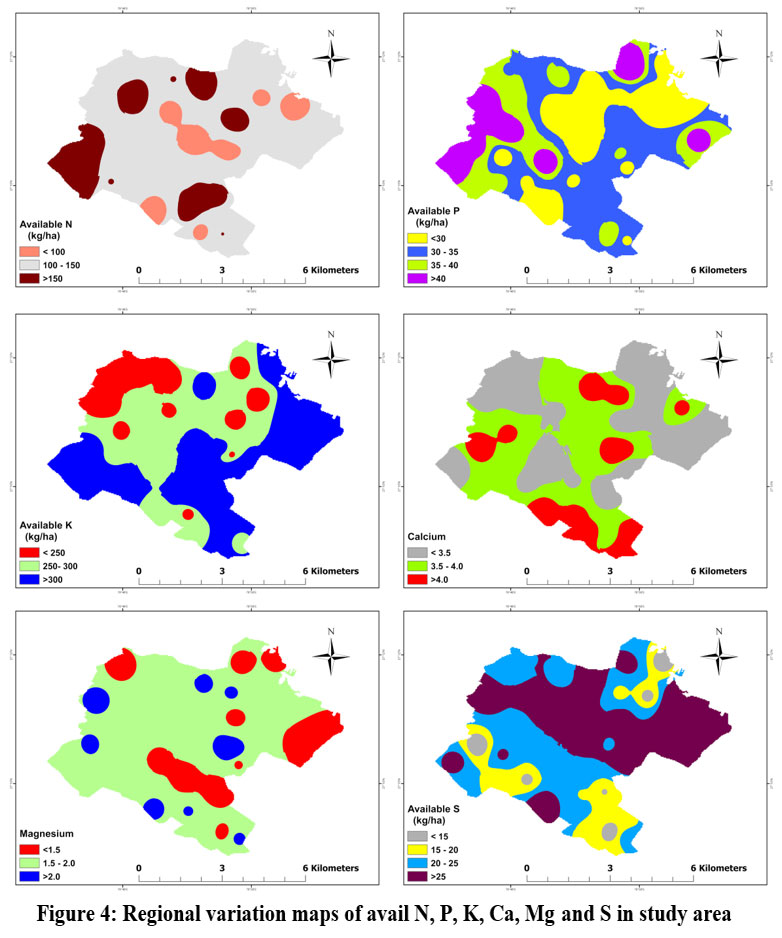 | Figure 4: Regional variation maps of avail N, P, K, Ca, Mg and S in study area
Click here to view Figure |
Status of micronutrients
Table 3 presents a comprehensive statistical analysis of soil nutrient properties, including iron, manganese, copper and boron. Iron concentration ranges from 0.18 to 2.03 mg per kg, with a mean of 0.71 mg per kg. The average variation is 0.40, with a CV of 56.86 per cent. Of the soil samples, 31.25 per cent had an iron deficiency, 37.5 per cent had a Fe surplus, and 31.25 per cent had a high level of iron. These results are consistent with other findings of researcher34. Manganese concentration ranges from 2.54 to 20.29 mg per kg, with a mean of 9.17 mg per kg. The average variation is 4.95; with a CV of 93.53 per cent. 19.37 per cent of samples had a deficiency in Mn, whereas 71.87 per cent of soil samples had high Mn content. Copper concentration ranges from 2.87 to 20.29 mg per kg, with a mean of 9.83 mg per kg. The average variation is 4.95, with a CV of 50.37 per cent, it was discovered that 100 per cent of the soil samples had an adequate amount of copper. These outcomes are consistent with the research conducted in the Vikas Khand tehsil of Varanasi, Eastern Uttar Pradesh, by a group of scientists35. Zinc concentration ranges from 0.72 to 2.56 mg per kg, with a mean of 1.47 mg per kg. The average variation is 0.44, with a CV of 30.39 per cent. Of the soil samples, 28.12 per cent had insufficient Zn content, while 65.62 per cent had sufficient Zn content. Similar findings about the condition of micronutrients in the soils of Azad Jammu and Kashmir's Bhimber district were noted by early researchers36. Boron concentration ranges from 0.26 to 4.21 mg per kg, with a mean of 1.54 mg per kg. The average variation is 0.96, with a CV of 62.62 per cent. 3.12 per cent of soil samples have insufficient available boron content, while 96.87 per cent of soil samples have sufficient available boron content36. The distributions of micronutrient spatial variability are shown in Fig 5.
Table 3: Statistical data of available micronutrients in soils of study area
Parameters | Range | Mean | S.D. | C.V. (%) |
Avail-Fe. (mg per kg) | 0.18-2.03 | 0.71 | 0.40 | 56.86 |
Avail-Mn. (mg per kg) | 2.54-32.64 | 9.80 | 9.17 | 93.53 |
Avail-Zn. (mg per kg) | 2.87-20.29 | 9.83 | 4.95 | 50.37 |
Avail-Cu. (mg per kg) | 0.72-2.56 | 1.47 | 0.44 | 30.39 |
Avail-Bo. (mg per kg) | 0.26-4.21 | 1.54 | 0.96 | 62.62 |
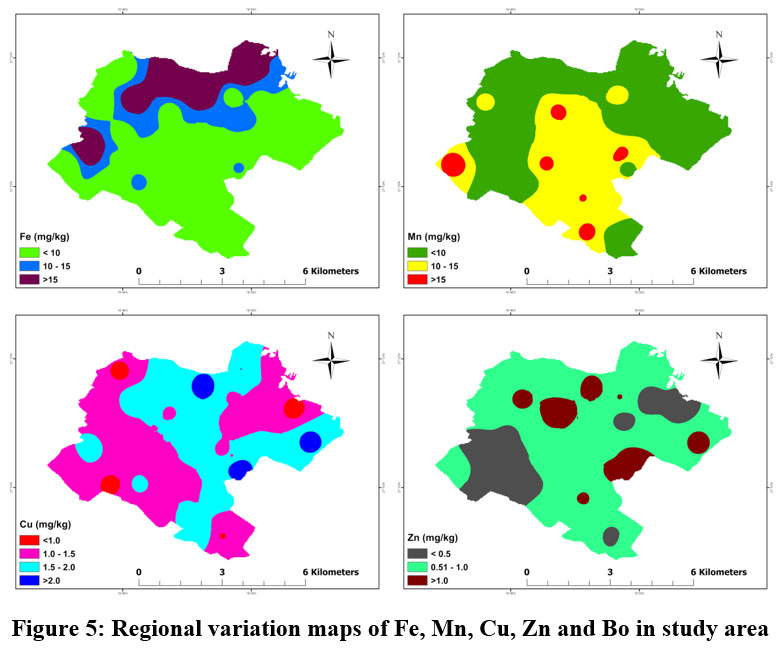 | Figure 5: Regional variation maps of Fe, Mn, Cu, Zn and Bo in study area
|
Nutrient Index Value
The nutrient index value (NIV) for available nutrients i.e. N, P, K, S, Ca, Mg, Fe, Mn, Cu, Zn and B in Ghiror block of Mainpuri district were given below in Fig. 6.
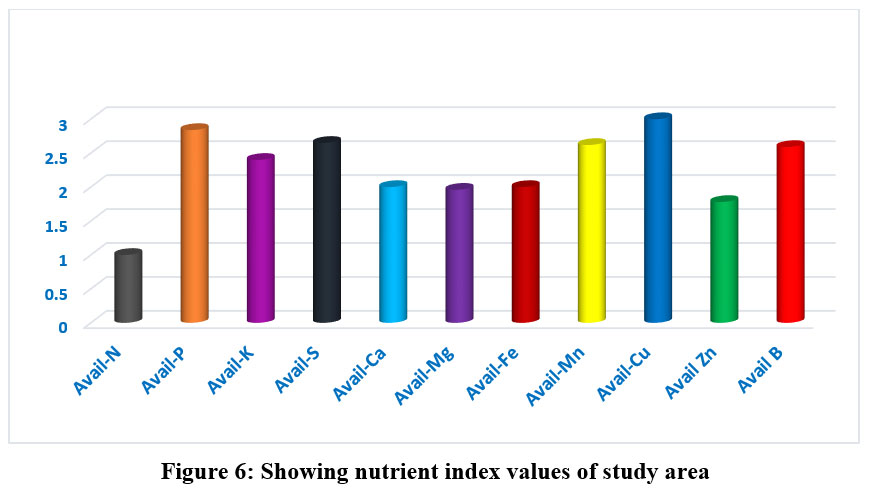 | Figure 6: Showing nutrient index values of study area
|
Association between physico-chemical properties of soil
The data related to association study are given in Figure 7. The soil's pH was found to have a negative association with nitrogen (r=-0.135), porosity (r =-0.082), and OC (r =-0.211*) of the soil. There is a strong negative association (-0.870**) between bulk density and soil porosity37. Porosity is highly positively correlated with water holding capacity (r=1.000**)38. water holding capacity exhibits a weak positive association (r=0.436*) with particle density and a strong negative association (r=-0.870**) with bulk density39. WHC is highly positively correlated with porosity (r=1.000**). The relationship between EC and pH is inverse (r=-0.206). Particle density and EC have a marginally positive association(r=0.155), EC exhibits a weak positive association with OC (r=0.011), and there is a strong positive association (r =0.818**) between OC and N and a negative association (r =-0.178) between OC and Cation Exchange Capacity (CEC)28. There is a weak positive association (r=0.209) between CEC and pH, and a negative association (r=-0.081) between CEC and OC and EC. N has an extremely strong positive association (r =0.818**) with OC. N and P have a strong positive association (r =0.368*). And additionally, phosphorus and organic carbon have a positive association (r = 0.209)40. Potassium exhibits a positive association (r=0.165) with nitrogen and a not-significant negative association(r=-0.136) with phosphorus. The available sulphur in these soils has a negative association(r=-0.021) with pH. It also exhibits a negative, non-significant association (r=-0.269) with organic carbon and a non-significant association(r=0.192) with calcium and magnesium. Boron has a weekly negative association(r=-0.087) with pH, and all cationic micronutrients have a negative association pH. However, Boron exhibits a weekly positive association iron (r=0.260) and a negative association Copper, Manganese, and Zinc.
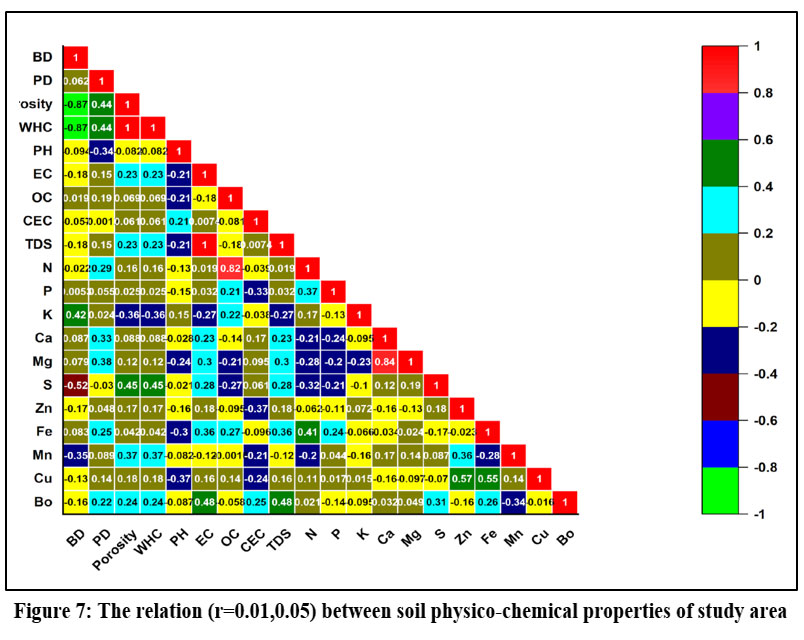 | Figure 7: The relation (r=0.01,0.05) between soil physico-chemical properties of study area
|
Principal component analysis
The physico-chemical properties were analyzed for 20 factors , and the two PCA explained the variation of 21.4 per cent (PC1) and 15.1 (PC2) respectively. The first two principal components (PCs) 36.48 per cent variability have eigenvalues greater than 1.5. The results of PCA are summarized in Table 4. The PD, porosity, WHC, EC, CEC, TDS, Ca, Mg, S and all micronutrient are positive relation on PC1, while BD, pH, OC, P and K are negative relation on PC1. The BD, PD, porosity, WHC, EC, TDS, Ca, Mg, S and all micronutrient are positive relation on PC2, while pH, CEC, Ca, Mg, S and Mn are negative relation on PC2. The PCA biplot showing four quadrant (Figure 8).
Table 4: variance (per cent), Eigenvalues, cumulative variance (per cent) and matrix factor loading of soil parameters
Parameters | PCA1 | PCA2 |
Eigenvalue | 4.29 | 3.02 |
Variance (%) | 21.43 | 15.08 |
Cumulative (%) | 21.43 | 36.51 |
BD | -0.704 | 0.048 |
PD | 0.431 | 0.273 |
Porosity | 0.845 | 0.084 |
WHC | 0.845 | 0.084 |
PH | -0.279 | -0.393 |
EC | 0.644 | 0.020 |
OC | -0.097 | 0.712 |
CEC | 0.037 | -0.357 |
TDS | 0.647 | 0.022 |
N | 0.005 | 0.797 |
P | -0.032 | 0.507 |
K | -0.476 | 0.150 |
Ca | 0.295 | -0.434 |
Mg | 0.389 | -0.407 |
S | 0.557 | -0.388 |
Zn | 0.261 | 0.195 |
Fe | 0.227 | 0.619 |
Mn | 0.279 | -0.086 |
Cu | 0.280 | 0.534 |
Bo | 0.442 | -0.028 |
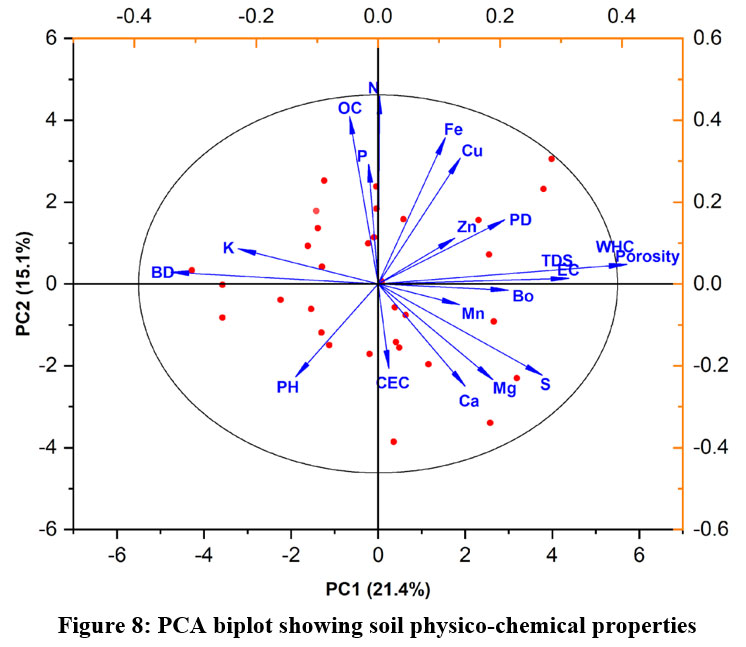 | Figure 8: PCA biplot showing soil physico-chemical properties
|
Conclusion
The results reveal that the endless use of synthetic chemicals has led to a decline in soil quality, impacting small crops. The soil in Ghiror Block is naturally alkaline and not affected by crop salinity. However, concerns about soil fertility include low nitrogen and organic carbon content. While available micronutrients are not deficient in soil, it is particularly good for soil fertility. Understanding soil nutrient status is crucial for farmers to reinforce agricultural productiveness and food security. Enhancing agricultural efficiency, maintaining food support, long-term viability and soil health are all dependent on maintaining soil health. The current investigation aids Uttar Pradesh farmers in making informed fertilizer decisions, reducing soil risks, and increasing long-term agricultural profitability through physico-chemical analysis of soil in Mainpuri district.
Acknowledgement
The Department of Soil Science and Agricultural Chemistry at the Institute of Agricultural Sciences, Banaras Hindu University, Varanasi, is acknowledged by the authors for providing the facilities, infrastructure, and a favorable working environment that enabled this study.
Funding Sources
The author(s) received no financial support for the research, authorship, and/or publication of this article.
Conflict of Interest
The author(s) do not have any conflict of interest.
Data Availability Statement
The study's foundation is the physico-chemical data from the soil that was analyzed in a lab.
Ethics Statement
The study's participants' right to privacy was upheld, as evidenced by the fact that their names were withheld at their request.
Informed Consent Statement
This Study did not involve human participants and therefore informed consent was not required
Author Contributions
Pukhraj Kumawat; write original paper,
Prem Kumar Bharteey; valdation map, Y.V. Singh,
Surajyoti Pradhan, Rajesh Kumar, Ashok Kumar; write reviewing and editing
References
- Shrivastav, P., Prasad, M., Singh, T.B., Yadav, A., Goyal, D., Ali, A., Dantu, P.K. Role of Nutrients in Plant Growth and Development. Contaminants in Agriculture, 2020, 26, ISBN: 978-3-030-41551-8
- Singh, Y.V., Shashi, K., Singh, S.K., Sharma, P.K., Jat, L.K., Kumar, M., Shahi, S.K., Jatav, H.S. Assessment of Physico-Chemical Characteristics of the Soil of Lahar Block in Bhind District of Madhya Pradesh (India). Int J Curr Microbiol App Sci. 2017; 6(2):511-519.
- Bharteey, P.K., Singh, Y.V., Sukirtee, P.S., Kumar, M., Rai, A.K., Available Macro Nutrient Status and their Relationship with Soil Physico-Chemical Properties of Mirzapur District of Uttar-Pradesh, India. International Journal of Current Microbiology and Applied Sciences. 2017; 6(7):2829-2837.
- Sultana, J., Siddique, M.N.A. & Abdullah, M.R. (2015). Fertilizer recommendation for agriculture: practice, practicalities and adaptation in Bangladesh and Netherlands. International Indian, 1(1), 21-40.
- Hossain, M.A. and Siddique, M.N.A. (2015). Water-A limiting resource for sustainable agriculture in Bangladesh. EC Agriculture, 1(2), 124-137.
- Khan, M.A.S., Waliullah, M., Hossain, M., Mandal, B.H., Habiba, U. and Siddique, M.N. A. (2016). Safe water access, motivation and community participation at arsenic affected rural areas of Jessore, Bangladesh: insights and realism. Journal of Science, Technology and Environment Informatics, 04(01), 260-269. https://doi.org/10.18801/jstei.040116.29
- Siddique, M.N.A. (2015). Determination of N mineralization, total N and cation exchange capacity of soil through NIR spectroscopy for decision support in rice farming. International Journal of Business, Management and Social Research, 01(01), 47-50.
- Sahu, R.K., Thomas, T., Singh, A.K., Naga, I.R., Assessment of Physico-chemical Properties of Soil from Different Blocks of Visakhapatnam District, Andhra Pradesh. International Journal of Plant & Soil Science. 2023; 35(15):322-335.
- Mishra, A., Das, D., Saren, S., Dey, P., GPS and GIS based soil fertility maps of Nayagarh district, Odisha. Ann Plant Soil Res. 2016;18(1):23-28.
- Pappu, Y., Singh, P.K., Sharma, R.K., Singh, A., Latare, A.M., Srinath, I., Yogesh, Y.C., Physico-chemical analysis of soils in Madanapalle block, Chittor district of Andhra Pradesh. International Journal of Chemical Studies. 2020; 8(3):154-158.
- Bharteey, P.K., Deka, B., Dutta, M., Goswami, J., Saikia, R. Geospatial variability of soil physico-chemical properties of Moridhal watershed in Dhemaji district of Assam, India using remote sensing and GIS. Ann Plant Soil Res. 2023; 25(1):99-109.
- Prajapat, V., Singh, V.Y., Bharteey, K.P., Sarvajeet, Singh, K., Sharma, S., Saraswat, A., Assessment of Soil Fertility Status of Different Villages of Depalpur Block of Indore District, Madhya Pradesh, India. Environment and Ecology. 2023; 41:191-196.
- Black CA. Methods of Soil Analysis. 1st ed. Madison, WI: American Society of Agronomy; 1965:1-2, 1572.
- Piper, C.S. Soil and Plant Analysis. Bombay, India: Hans Publishers; 1966: 368-374.
- Jackson, M.L., Miller, R.H., Forkiln, R.E., Soil Chemical Analysis. 2nd Indian Rep. New Delhi, India: Prentice-Hall of India Pvt Ltd; 1973.
- Walkley, A., Black, I.A. An examination of the Degtjareff method for determining soil organic matter, and a proposed modification of the chromic acid titration method. Soil Sci. 1934; 37(1):29-38.
- Subbiah, B.V., Asija, L.L. A rapid procedure for estimation of available nitrogen in Soil. Currant Science. 1956; 25:259-260.
- Olsen, S.R., Cole, C.V., Watanabe, F.S., Dean, L.A. Estimation of available phosphorus in soil by extraction with sodium by carbonate. Circular United State Department of Agriculture Circular No 939; 1954.
- Hanway, J.J., Heidel, H., Soil analysis methods as used in Iowa State College soil testing laboratory. Iowa Agric. 1952; 57.
- Cheng, K.L., Bray, R.H., Determination of magnesium and calcium in soil and plant material. Soil Science. 1951; 72:44.
- Chesnin, L., Yien, C.H. Turbidimetric determination of available sulphur. Proceeding of Soil Science. 1950.
- Lindsay, W.L., Norvell, W.A. Development of DTPA soil test for zinc, iron, manganese and copper. Soil Science America Proceedings. 1978; 42:421-428.
- Parker, F.W., Nelson, W.L., Winters, E., Miles, I.E. The broad interpretation and application of soil test information. Agron J. 1951; 43(3):105-112.
- Ghosh, A.B., Hasan, R. Available potassium status of Indian soils. In: Potassium in soils, crops and fertilizers. Bulletin No. 10, Indian Society of Soil Science, New Delhi; 1976.
- Snedecor, G.W., Cochran, W.R. Statistical methods. 6th ed. Ames, IA: Iowa State University Press; 1967. p. 274.
- Pandey, V., Gautam, P., Singh, A.P. Assessment of physical properties of soil under different land use systems in a Mollisol. Journal of Pharmacognosy and Phytochemistry. 2018; 7(6):2645-2648.
- Ramamoorthy, B., Bajaj, J.C. Nitrogen, Phosphorous and Potash status of Indian soils. Fertilizer News. 1969; 14:25-28.
- Verma, C., Lal, A., David, M.D.A., Rao, S. Determination of Physicochemical Properties in Soil Samples of Prayagraj District, Uttar Pradesh, India. Asian Journal of Agriculture and Biology. 2019; 5(25):76.
- Maurya, S.K., Bharteey, P.K., Singh, G.R., Bahuguna, A., Luthra, N., Pal, S., Rai, S. Geospatial variability of soil properties of the different villages in Arajiline Block of Varanasi District of Uttar Pradesh. Int J Bio-resource Stress Manag. 2024; 15(1):1-14.
- Meena, H.B., Sharma, R.P., Rawat, U.S. Status of macro and micronutrients in some soils of Tonk district of Rajasthan. Journal of the Indian Society of Soil Science. 2006; 54:508-512.
- Kumar, R., Singh, M., Kumar, S., Singh, M., Kumar, P. Estimation of Soil Fertility Status under Sugar Cane-Wheat Farming System in Different Blocks of Rampur District of Uttar Pradesh. Journal of Krishi Vigyan. 2018; 6(2):101-104.
- Sharma, S., Hasan, A., Thomas, T., Kumar, T., Sharma, V., Sharma, A., David, A.A. Assessment of soil physical properties from different blocks of Jaipur District, Rajasthan, India. Int J Plant Soil Sci. 2022; 34:87-95.
- Srinidhi, P., Singh, Y.V., Sharma, P.K., Singh, R.K., Latare, A.M., Srinath, I., Yogesh, Y.C. Physico-chemical analysis of soils in Madanapalle block, Chittor district of Andhra Pradesh. IJCS. 2020; 8(3):154-158.
- Nayak, B.R., Manjappa, K., Patil, V.C. Influence of rainfall and topo situations on physic-chemical properties of rice soils in hill region of Uttara Kannada district. Karnataka J Agric Sci. 2010; 23(4):575-579.
- Jat, R.K., David, A.A., Thomas, T., Naga, I.R. Assessment of Physico-chemical Properties of Soil from Different Departments of NAI, SHUATS, Prayagraj, UP, India. International Journal of Plant & Soil Science. 2023; 35(15):311-316.
- Singh, Y.V., Singh, S.K., Sahi, S.K., Verma, S.K., Yadav, R.N., Singh, P.K. Evaluation of soil fertility status from Milkipur village, Arajiline block, Varanasi, district, Uttar Pradesh, in relation to soil characteristics. Journal of Pure and Applied Microbiology. 2016; 10(2):1455-1461.
- Nazif, W., Perveen, S., Saleem, I. Status of micronutrients in soils of district Bhimber (Azad Jammu and Kashmir). Journal of Agricultural and Biological Science. 2006; 1(2):35-40.
- Singh, Y.V. Available macro nutrient status and their relationship with soil physico-chemical properties of Chandauli District of Uttar Pradesh. Techofame-AJ Multi Adv Res. 2018; 7(1):21-25.
- Ahad, T., Kanth, T.A., Nabi, S. Soil bulk density as related to texture, organic matter content and porosity in kandi soils of district Kupwara (Kashmir Valley), India. Geography. 2015; 4:198-200.
- Ghosh, C., Mukherjee, M., Biswas, K. Physico-chemical Properties of Soil of Jaldapara National Park in West Bengal, India. International Journal of Advanced Research in Biological Sciences. 2020; 7(6):141-150.
- Deoli, B.K., Shefali, A., Madhuben, S., Anwar, S.N. Assessment of soil quality using physiochemical parameter of soil in Dehradun District of Uttarakhand. 2020; 1580-1590.


