Current Status of Man and Animal Conflict and e-Parihara in Different Forest Ranges of Karnataka
1
Department of Studies in Environmental Sciences,
University of Mysore, Manasagangotri,
Mysore,
Karnataka
India
Corresponding author Email: pavithrakesari@gmail.com
DOI: http://dx.doi.org/10.12944/CWE.19.3.38
Copy the following to cite this article:
Mantelingachar P. G. Current Status of Man and Animal Conflict and e-Parihara in Different Forest Ranges of Karnataka. Curr World Environ 2024;19(3). DOI:http://dx.doi.org/10.12944/CWE.19.3.38
Copy the following to cite this URL:
Mantelingachar P. G. Current Status of Man and Animal Conflict and e-Parihara in Different Forest Ranges of Karnataka. Curr World Environ 2024;19(3).
Download article (pdf)
Citation Manager
Publish History
Select type of program for download
| Endnote EndNote format (Mac & Win) | |
| Reference Manager Ris format (Win only) | |
| Procite Ris format (Win only) | |
| Medlars Format | |
| RefWorks Format RefWorks format (Mac & Win) | |
| BibTex Format BibTex format (Mac & Win) |
Article Publishing History
| Received: | 2024-11-25 |
|---|---|
| Accepted: | 2024-12-07 |
| Reviewed by: | 
 Deepak Malik
|
| Second Review by: |

 Pawan Kumar Yadav
|
| Final Approval by: | Dr. Hiren B Soni |
Introduction
Man-animal conflict (MAC) is a significant global issue, exacerbated by the growing overlap between human settlements and wildlife habitats. As human populations expand and encroach on natural environments, the frequency and intensity of these conflicts have increased, resulting in detrimental effects on both wildlife and human communities.1 The consequences of MAC are widespread, affecting biodiversity, human safety, and ecological balance. This issue is particularly evident in biodiversity-rich regions like Karnataka, India, which hosts iconic species such as the Indian elephant (Elephas maximus), tiger (Panthera tigris), and leopard (Panthera pardus). 2 In addition several other species in regions like Karnataka face significant challenges due to habitat fragmentation and human encroachment. Gaurs, or Indian bison, live in forested and hilly regions in the Western Ghats but habitat loss is reducing their range. Wild boars are adaptable and can be found in forests, grasslands, and agricultural areas, though they are now mainly confined to forest reserves due to encroachment. 3 Indian wolves are found in grasslands, scrublands, and forests in northern and central India, but their range is shrinking due to habitat fragmentation. Sloth bears prefer dense forests in tropical regions like the Western Ghats, but are increasingly limited to protected areas. 4 In such areas, conflicts often escalate in agricultural zones where wildlife habitats intersect with human settlements, causing destruction to crops, livestock, and infrastructure, alongside significant economic and social impacts on local communities. 5 Land-use changes and habitat fragmentation have further exacerbated these conflicts, particularly in Karnataka's protected areas. 6 Efforts to manage and mitigate human-wildlife conflict in Karnataka have included technological innovations and community-driven initiatives, which aim to reduce these tensions and promote sustainable coexistence 7 and initiatives in Karnataka, several platforms and initiatives have been developed to mitigate MAC and promote sustainable coexistence between humans and wildlife. To address the global context of MAC with the specific challenges governmental initiatives are the Wildlife Crime Control Bureau (WCCB) Portal 8, M-Stripe 9, e-Compensation System 10, iTrack Wildlife 11 , community-based platforms like Coorg Wildlife Society 12, and the global Forest Watch initiative. 13
Asaikutti et al. explored mitigation strategies such as elephant-proof trenches to reduce Human- Elephant conflict (HEC) in South India. 14 Similarly, Karanth et al. highlighted the role of compensation mechanisms in managing MAC in India. 15 Research by Madhusudan et al. provides insights into the distribution and conservation status of key species, such as the Asian elephant, underscoring the challenges posed by habitat fragmentation and human encroachment.16
Large carnivores such as tigers and leopards also contribute significantly to conflict scenarios. Ashish et al. examined the threats posed by these species in high-conflict areas 17, while Gulati et al. reported that human casualties remain a dominant cost of such conflicts in India. 18 Madhusudan and Karanth delved into the interplay between local hunting practices and the conservation of large mammals, stressing the importance of addressing these challenges holistically. 19 Remote sensing and GIS applications have proven instrumental in understanding and mitigating MAC. Gunawansa et al. demonstrated the use of Sentinel-2 imagery to assess greenery changes and their impact on human-elephant conflicts in Sri Lanka, offering valuable parallels to Karnataka's situation. 20 The traditional method of analysing filed data and digitised data signifies time consumption in data collection and accuracy. 21 The HEC as a major conflict issue in Karnataka among all wildlife species, the population distribution and the nature of conflicts were recorded till the previous year. 22, 23 Research by the Vidhi Centre for Legal Policy examined the causes and consequences of human-wildlife conflicts in Karnataka, linking them to issues such as deforestation, land-use changes, and agricultural expansion. The study underscored the importance of compensation schemes and community-led initiatives for effective conflict mitigation.24 From Joshi et al. emphasized the significance of spatial analysis in tracking land-use changes in Kodagu and Karnataka, further supporting the need for integrative conservation strategies.25 As Karnataka's biodiversity faces growing pressure, sustainable coexistence between humans and wildlife requires a multi-faceted approach, includes community engagement, technological interventions, and policy reforms.26, 27 Addressing MAC effectively will ensure the preservation of Karnataka's unique ecosystems while safeguarding the livelihoods of its inhabitants.28 Additionally, advancements in the e-Parihara platform, created by Sakala Portal, comprising real-time tracking of claims and increased transparency, could be an effective - conflict management tool, while significant strides have been made in addressing MAC in Karnataka, a multi-pronged approach involving technology, community engagement, and ecological planning is essential for sustainable conflict resolution.
Materials and methods
The Karnataka Forest Department (KFD) has been providing ex-gratia relief for human-animal conflict (MAC) cases since 2014. This relief is given to individuals affected by wildlife-related damage, such as crop loss, property damage, or injuries. This research was based on a systematic survey of conflict areas identified through recorded MAC cases by the KFD, which provided ex-gratia relief from 2019-20 to 2022-23. The e-Parihara platform, created by the Sakala Portal, offers a geo-tagged database. Data from 2014 was manually uploaded, while real-time data has been available since 2019. The e-Parihara mobile app allows forest officials to document conflict cases with geo-tagged photos and damage details. Access is restricted to forest officials to ensure accurate documentation (Fig. 1).29, 30
Quality flagging is implemented to ensure the accuracy, reliability, and consistency of data, particularly in datasets involving complex and critical issues like man-animal conflicts (MAC). Geo-Tagged Data: These attributes provide spatial information and are used for mapping and location-specific analysis, viz., Circle, Division, SubDivision, Ranges, District, Taluk, Hobli, Village, Latitude-Longitude.
Non-Geo-Tagged Data: These attributes focus on the details of the cases, such as the applicant's information, incident details, and financial aspects, such as Applicant Name, Applicant Mobile No, Case ID, Date of Event, Type of Damage, Animal Involved, Form Status, Amount, Financial Year, Damage Details.
Error Detection and Correction, Data Standardization, Verification of Key Attributes, Reduction of Redundancy, Facilitating Cross-Verification, Ranking MAC based on highest conflict occurrences and compensation paid. Annual reports cross checked with e-Parihara for decide renew the compensation amount payable to victim’s family.
Clean and flagged data leads to accurate analysis, supporting the development of targeted mitigation strategies, such as creating buffer zones or allocating resources for hotspot regions.
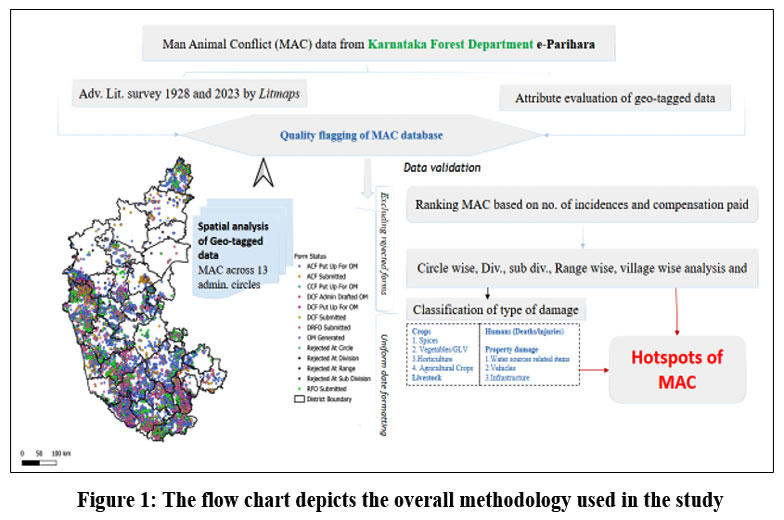 | Figure 1: The flow chart depicts the overall methodology used in the study
|
The Department developed and deployed the e-Parihara mobile app accessibility for forest officials only through the e-Parihara page on the Karnataka Government's app portal. This online web-application supports evidential documentation of geo-tagged Conflict Cases data and applicant details that enable transparency and efficiency in processing such claims for conflict issues. The Android app allows the inspecting officer to record details about the geo-tagged Conflict Cases of MAC, as well as geo-stamps and photographs of the damage caused by the conflict.31 The inspection report is sent for claim processing through a workflow on the web interface. The application calculates the ex-gratia to be sanctioned in accordance with Government Orders issued occasionally, and generates automated official memorandums (OM’s). The process is also integrated with SMS service, allowing automated SMS to be sent to the applicant regarding the status of his claim's progress during 2019 to 2023 (Table 1). For data analysis, a datasheet was designed by removing rejected cases at various hierarchy levels of application form submission. Accepted forms for compensation claims were selected to ensure data uniformity across parameters, such as dates and crop names, which were translated into English with their scientific names. To reduce errors and avoid repetition, a code was used to verify damage types in the inference column/remarks section, enabling cross-verification for both qualitative and quantitative validation. A pivot table was created to analyze data related to animals involved, compensation amounts, and the number of cases. The table includes columns such as Animal Name (e.g., elephant, leopard, wild boar), Compensation Amount (total compensation allocated per case), Number of Cases (count of cases per animal), Total Compensation (sum of all compensation amounts), and Total Cases (overall number of cases).
Figures 7 and 8 represent spatial mapping of incidents involving five key animals—elephant, wild boar, leopard, gaur, and tiger with the highest percentages of incidents and compensation paid. Additionally, bar graphs illustrate the compensation paid for each animal type, emphasizing the correlation between incident frequency and financial impact. A pie-chart visualizes the overall compensation distribution across four major categories over the nine-year period from 2014 to 2024, offering clear insights into the economic burden of human-wildlife conflicts (Fig. 9).
Percentage Calculations

Technology Integration for literature survey on MAC
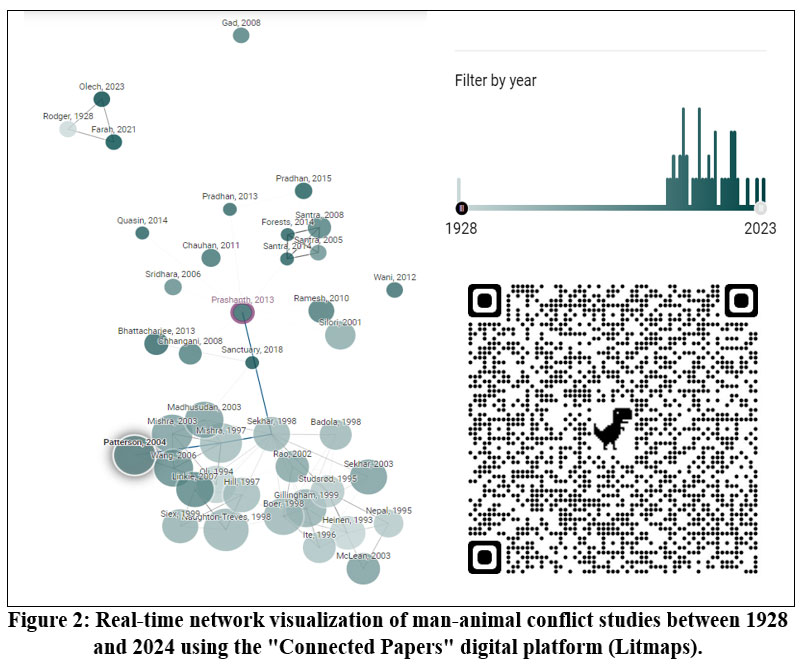
| Figure 2. Real-time network visualization of man-animal conflict studies between 1928 and 2024 using the "Connected Papers" digital platform (Litmaps).
|
Litmaps shows the global context of causes and trends on MAC literature. The QR code scan image represents the documentation on factors such as habitat fragmentation32,33,, competition for resources, climate change, agricultural practices, human population growth, poaching and illegal wildlife trade34, lack of awareness and education, this table contributes to understanding the complex interplay between human activities and wildlife habitats.35 To understand the history and use of geo-tagged Conflict Cases mapping on MAC and advocate the implementation of regulations that balance human needs and wildlife conservation (Fig. 2). Overall, the literature review underscores the complex interplay of various factors contributing to the decline in the minimum area occupied by species.36 In 2022 Becerra et al., studied these challenges requires comprehensive conservation strategies that address habitat loss, resource competition, climate change, unsustainable agricultural practices, human population growth, poaching, illegal wildlife trade, and lack of awareness and education. 37
Study Area
According to the administrative divisions of the forest department, Karnataka State was divided into 13 circles, 54 divisions, 107 subdivisions, and 297 ranges. Karnataka comprises 31 districts, 176 taluks, approximately 300 to 400 hoblis, and 29,000 villages. Considering the MAC issues, the mapping is illustrated in Fig. 3.
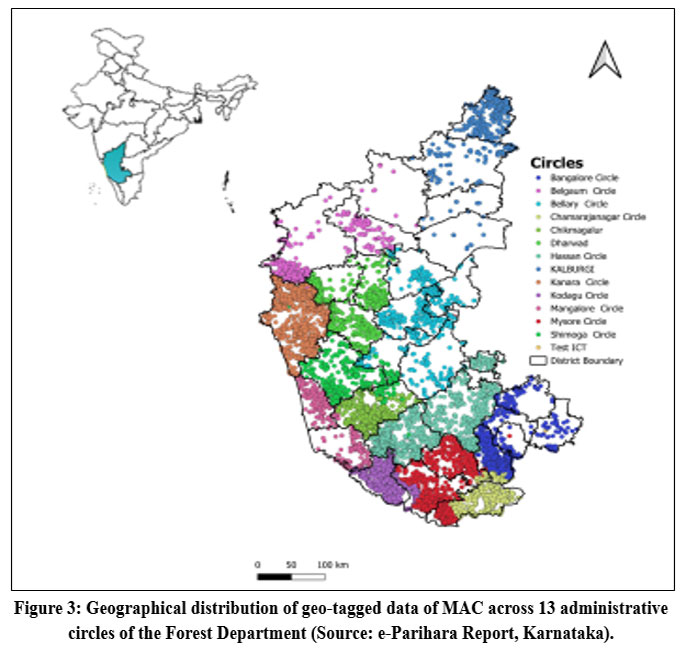 | Figure 3: Geographical distribution of geo-tagged data of MAC across 13 administrative circles of the Forest Department (Source: e-Parihara Report, Karnataka).
|
Results
From 2014 to 2018, the lowest number of cases was reported, investigated, and compensated. During this period, traditional documentation methods were predominantly employed, which were time-consuming and required frequent physical visits to the nearest forest department. This approach often results in delays and inconsistencies with favoritism, potentially influencing the outcomes. From 2014 to 2018, MAC cases were minimal, accounting for just 0.01% in 2014-2015, 0.0005% in 2015-2016, 0.0005% in 2017-2018, and 0.04% in 2018-2019. In contrast, from 2019 onwards, digital platforms boosted reporting, with 10.94% in 2019-2020, 18.64% in 2020-2021, and 21.13% in 2021-2022, highlighting improved efficiency and reduced delays. Consequently, some families incurred significant financial losses while seeking compensation, and in certain instances, were subjected to fraudulent practices. To address these challenges, 2019 marked a pivotal year, with a substantial increase in reported and efficiently investigated cases, resulting in improved compensation outcomes.38
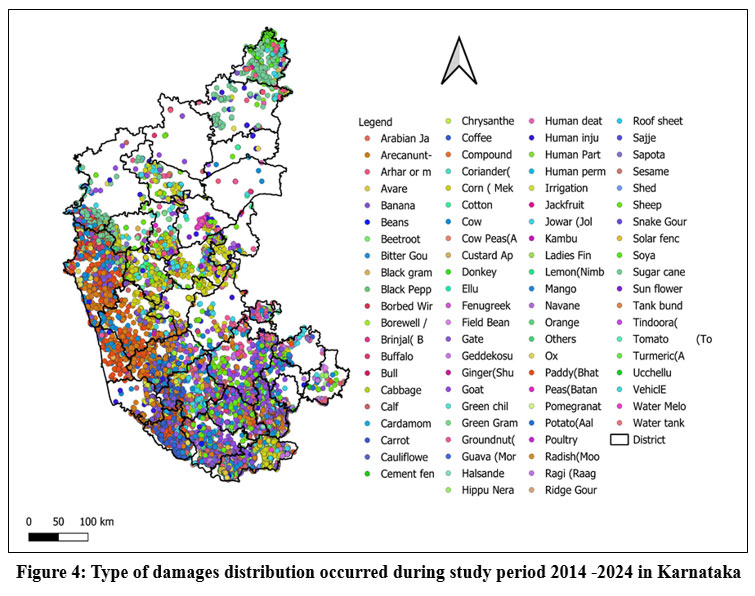 | Figure 4: Type of damages distribution occurred during study period 2014 -2024 in Karnataka
|
This map represents unclassified data on the types of damage recorded in the local language and lacks a quality-flagging process. Quality flagging is essential for ensuring data accuracy by identifying errors in key fields such as location coordinates, compensation amounts, and animal types. To enhance uniformity and simplify the analysis, local crop names were translated into English and aligned with the scientific names. Attributes such as Case ID, Date of Event, Animal Involved, and Type of Damage were validated against predefined criteria, whereas duplicates and inconsistencies were flagged to streamline datasets. Prioritizing high compensation or recurring conflict cases ensures focused attention, while cross-referencing claims with damage types and animal involvement enhances verification. This process supports targeted strategies, such as wildlife corridors, buffer zones, and resource allocation to conflict hotspots, ultimately improving the management of MAC. These ex gratia payments are intended to offer financial support to those affected by MAC incidents and help alleviate the socio-economic challenges faced by local communities (Fig. 4 and Fig. 5).
The KFD compensated for geotagged MAC conflict cases across 13 geographical and administrative circles. Between 2014 and 2024, the department handled a total of 203,297 cases, amounting to ?1,955.98 M. Of these, 19,046 cases (13.43%) were rejected, amounting to ?262.66 M, while 184,251 cases (86.57%) received compensation, amounting to ?1,693.32 M.
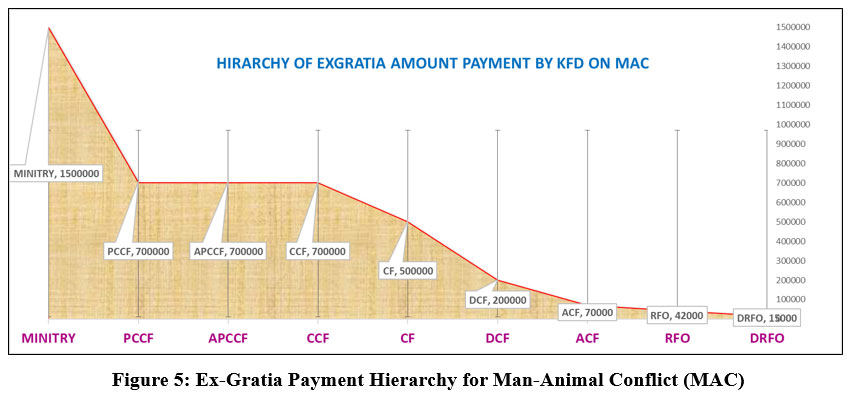 | Figure 5: Ex-Gratia Payment Hierarchy for Man-Animal Conflict (MAC)
|
The percentage of compensation for MAC in Karnataka among the 22 wild animals listed is shown in Table1.
Bangalore, Hassan, Mysore, Chikmagalur, Chamarajanagar, Kanara, Mangalore, Shimoga, Belgaum, Dharwad, Kalburgi, and, Bellary are the 13 circles, there is an additional wing as ICT which administrates division, subdivision, ranges wise MAC issues in terms of paying compensation by detailed documentation of the type of damage caused by the wildlife, by spot verification of forest official with the necessary expert or advisory team meant for type of conflict happened, at the earliest (Fig. 5).
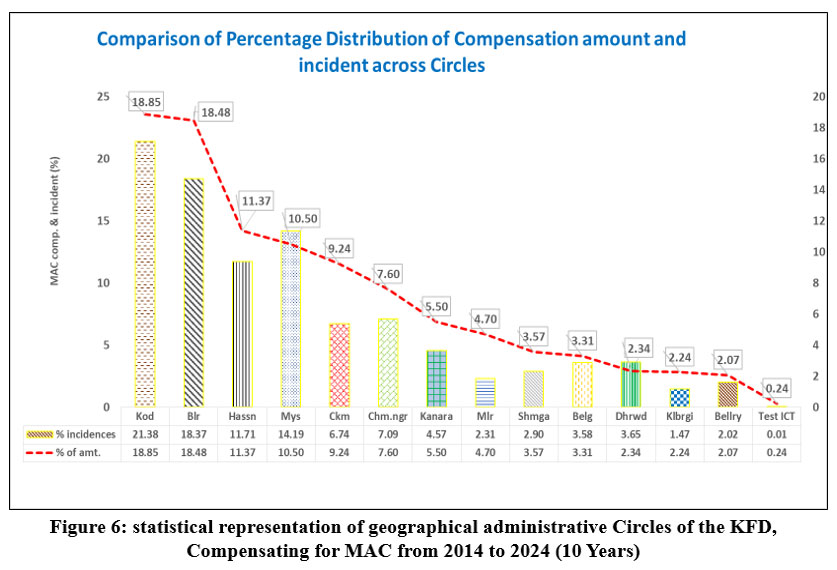 | Figure 6: statistical representation of geographical administrative Circles of the KFD, Compensating for MAC from 2014 to 2024 (10 Years)
|
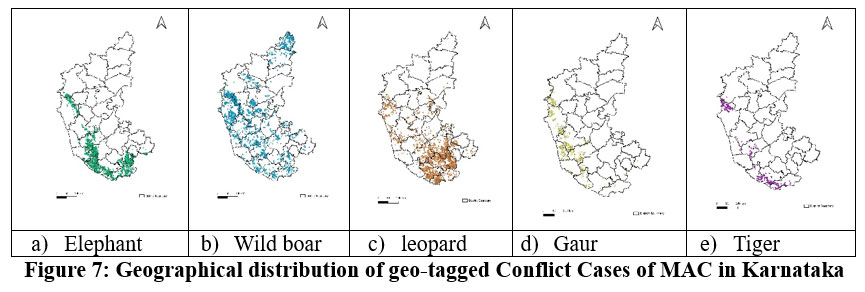 | Figure 7: Geographical distribution of geo-tagged Conflict Cases of MAC in Karnataka
|
The five major animals where the highest percentage of incidents occurred, and compensation was paid. Presenting the findings from the collected data and highlighting hotspots of conflicting circles based on these necessary steps can be planned. These circle comprises of 197 Taluks, analyse patterns and trends in MAC (Fig. 7) (Table 3).
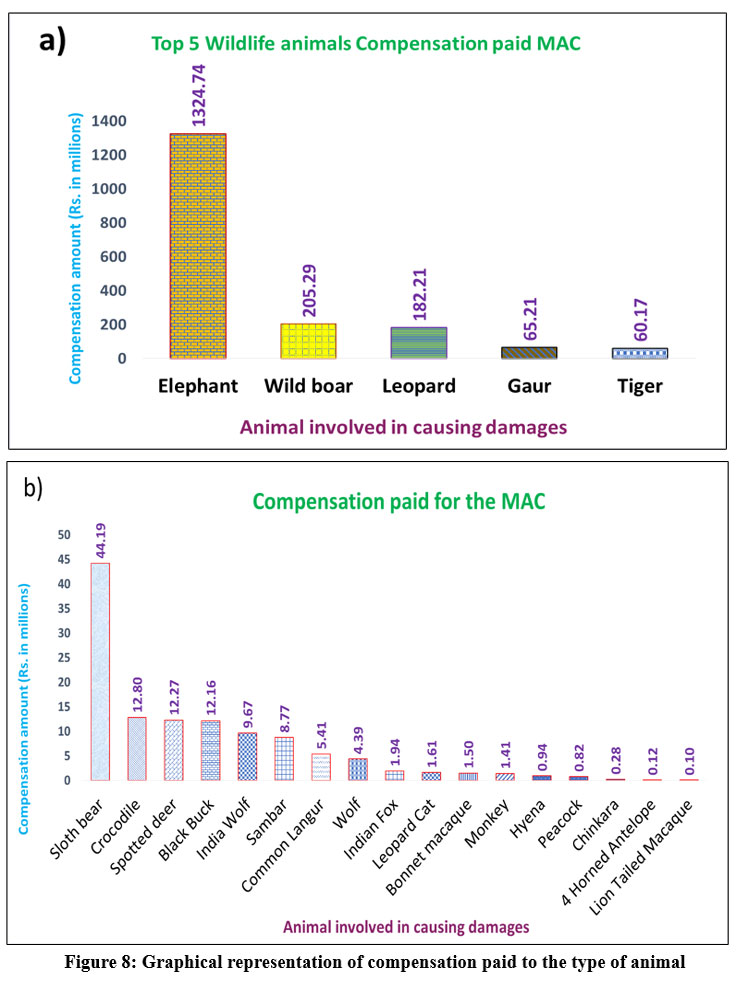 | Figure 8: Graphical representation of compensation paid to the type of animal.
|
Table 1: Percentage Distribution of Compensation Amount and Number of Cases for the Animals involved in the MAC
Sl No. | List of Animal involved | Compensation Amount (%) | No. of Cases (%) |
1 | Elephant | 74.82 | 68.18 |
2 | Wild Boar | 11.61 | 10.86 |
3 | Leopard | 10.3 | 8.09 |
4 | Gaur | 3.69 | 3.27 |
5 | Tiger | 3.41 | 1.34 |
6 | Sloth Bear | 2.5 | 1.18 |
7 | Crocodile | 0.73 | 0.05 |
8 | Spotted Deer | 0.7 | 0.67 |
9 | Black Buck | 0.69 | 1.17 |
10 | Indian Wolf | 0.55 | 0.13 |
11 | Sambar | 0.5 | 0.3 |
12 | Common Langur | 0.31 | 0.11 |
13 | Wolf | 0.25 | 0.06 |
14 | Indian Fox | 0.11 | 0.03 |
15 | Leopard Cat | 0.09 | 0.07 |
16 | Bonnet Macaque | 0.08 | 0.00 |
17 | Monkey | 0.08 | 0.01 |
18 | Hyena | 0.05 | 0.03 |
19 | Peacock | 0.05 | 0.06 |
20 | Chinkara | 0.02 | 0.01 |
21 | 4 Horned Antelope | 0.01 | 0.01 |
22 | Lion Tailed Macaque | 0.01 | 0.00 |
Elephants dominate the MAC compensation data, accounting for 74.82% of the amount and 68.18% of the cases. Wild boars (11.61%, 10.86%) and leopards (10.3%, 8.09%) follow as significant contributors. Moderate impacts are seen with gaur, tigers, and sloth bears, while species like crocodiles, deer, and wolves have a minimal share (less than 1%). Rare cases involve peacocks, chinkaras, and lion-tailed macaques, contributing less than 0.1%. This highlights elephants as the primary focus for conflict mitigation efforts (Table 1).
Table 2: Budget 2019 to 2023 for top 10 priority areas, 54 divisions, 107 subdivision, 297 Ranges, Districts for the loss of resources to the farmers.
sl no. | Division | Rs. in mil. | Subdivision | Rs. in mil. | Range | Rs. in mil. |
1 | Ramanagara | 214.36 | Ramanagara | 171.66 | Channapatna | 113.92 |
2 | Hassan | 120.29 | Sakaleshpura | 73.96 | Ramanagara | 44.16 |
3 | Madikeri | 83.01 | Mudigere | 57.73 | Sakaleshpura | 40.58 |
4 | Chikmagalur | 78.00 | Somwarpet | 53.47 | Mudigere | 39.64 |
5 | Virajpet | 73.17 | Thithimathi | 48.08 | Srimangala WL | 29.01 |
6 | Bandipura TR | 72.99 | Hunsur WL | 45.75 | Yeslur | 27.33 |
7 | Nagarhole TR | 70.60 | Madikeri WL | 43.68 | Ponnampet | 25.63 |
8 | Madikeri WL | 43.68 | Kanakapura | 42.70 | Virajpet | 25.10 |
9 | Cauvery WL | 42.34 | Hassan | 41.12 | Sathanur | 24.11 |
10 | Mangalore | 37.47 | Bannerghatta NP | 35.99 | Veeranahosahalli | 23.69 |
Total | 835.91 | 614.15 | 393.18 |
*mil. Represents millions (M)
Table 2: Divisional Breakdown, shows the Total budget: ?835.91 million across 54 divisions, 107 subdivisions, and 297 ranges.
Top Divisions: Ramanagara (?214.36M), Hassan (?120.29M), and Madikeri (?83.01M).
Top Subdivisions: Ramanagara (?171.66M), Sakaleshpura (?73.96M), and Mudigere (?57.73M). and Top Ranges: Channapatna (?113.92M), Ramanagara (?44.16M), and Sakaleshpura (?40.58M).
Table 3: Budget 2019 to 2023 for top 10 priority areas Districts, Taluks, Hobli, Villages for the loss of resources to the farmers.
District | Rs. in mil. | Taluk | Rs. in mil. | Hobli | Rs. in mil. | Village | Rs. in mil. |
Ramanagara | 258.44 | Virajpet | 128.56 | Kasaba | 166.32 | B V Halli | 15.69 |
Kodagu | 218.70 | Channapatna | 90.54 | Virupakshipura | 64.69 | Aralalasandra | 11.55 |
Chikmagalur | 121.68 | Kanakpura | 88.41 | Kailancha | 48.94 | Virupakshipura | 9.35 |
Mysore | 119.63 | Hd Kote | 78.42 | Ponnampete | 34.66 | Kunduru | 7.16 |
Hassan | 116.55 | Sakleshpura | 67.69 | H D kote | 34.30 | Doddanahalli | 7.13 |
Chamarajanagara | 107.59 | Ramanagar | 65.41 | Shreemangala | 32.07 | Urubage | 7.01 |
Uttar Kannada | 72.51 | Mudigere | 54.65 | Saraguru | 22.34 | Hosadoddi | 7.00 |
Dakshina Kannada | 38.45 | Somawarpet | 52.49 | Virajapete | 21.52 | Tenginakallu | 6.92 |
Belgaum | 34.92 | Madikeri | 37.66 | Kodihalli | 21.12 | Ketohalli | 6.52 |
Shimoga | 29.84 | Gundlupet | 36.22 | Hetturu | 20.17 | Hebbakodi | 6.30 |
1118.31 | 700.04 | 466.12 | 84.62 |
*mil. Represents millions (M)
The tables provide a detailed breakdown of budgets allocated from 2019 to 2023 for compensating farmers for resource losses caused by human-wildlife conflict. The data is categorized into different administrative levels, highlighting the priority areas for funding.
Table 3: District Breakdown
Total budget: ?1118.31 million across districts, taluks, hoblis, and villages.
Top Districts: Ramanagara (?258.44M), Kodagu (?218.70M), and Chikmagalur (?121.68M).
Top Taluks: Virajpet (?128.56M), Channapatna (?90.54M), and Kanakpura (?88.41M).
Top Hoblis: Kasaba (?166.32M), Virupakshipura (?64.69M), and Kailancha (?48.94M).
Top Villages: B.V. Halli (?15.69M), Aralalasandra (?11.55M), and Virupakshipura (?9.35M).
These allocations emphasize Ramanagara and Kodagu as high-priority areas across both tables, reflecting significant compensation needs for resource losses in these regions.
Outline the budget requirements for implementing the project, including personnel, equipment, and community outreach programs 2019 to 2023 (Table 3).
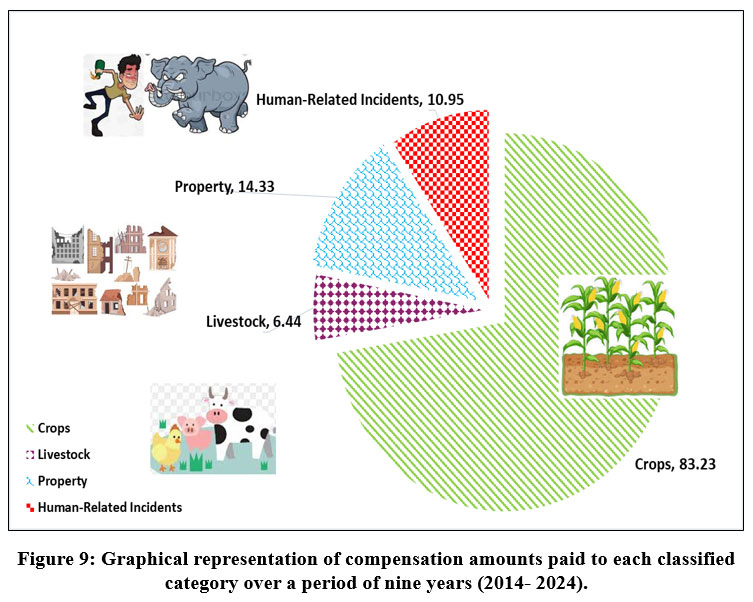 | Figure 9: Graphical representation of compensation amounts paid to each classified category over a period of nine years (2014- 2024).
|
Human-Related Incidents: There are 141 Human Deaths, 1150 Human Injuries, 115 cases of Human Partial Disability, and 50 cases of Human Permanent Disability.
Discussion
This study highlights the geo-tagged Conflict Cases dynamics of MAC across various forest ranges in Karnataka and emphasizes the necessity for comprehensive mitigation strategies. The findings reveal that crop depredation, livestock predation, and human casualties are the primary consequences of human-wildlife interactions in these regions. Elephants, leopards, and wild boars emerged as major contributors to conflict, correlating with their habitat preferences and movement patterns within forested and fringe areas. Interconnected Challenges reveals that the segmented approach emphasizes the complexity of human-animal conflict by highlighting interrelated factors, such as habitat loss, resource competition, and climate change. This insight aids stakeholders in developing comprehensive strategies to simultaneously address these challenges.
Quality Flagging in MAC Data Management is a crucial step in ensuring the reliability and accuracy of data used for managing Man-Animal Conflicts (MAC). By leveraging detailed attributes such as Circle, Division, Sub Division, Ranges, District, Taluk, Hobli, and Village, spatial data integrity can be maintained. Attributes like Case ID, Date of Event, Type of Damage, Animal Involved, and Form Status enable precise categorization and tracking of incidents. Geographic markers, including Latitude and Longitude, further enhance the ability to geo-tag incidents for spatial analysis. Personal identifiers such as Applicant Name and Applicant Mobile No ensure accountability while enabling follow-ups on claims or interventions. The financial component, including Amount and Financial Year, provides insight into the economic impact of MAC incidents. Quality flagging uses these data fields to detect and address inconsistencies, such as duplicate entries, missing information, or invalid geographic coordinates. For instance, ensuring that Damage Details align with the Type of Damage reported improves the accuracy of compensation claims. Flagging outliers in Amount based on patterns across Circle or Division can help detect anomalies in financial data. By incorporating robust flagging mechanisms, the system can improve data reliability, enabling better decision-making and more effective conflict mitigation strategies.
Claims for compensation may be rejected if the individual is involved in illegal activities such as theft, trespassing, poaching, illegal wildlife trade, or encroachment on forest land. Cases related to retaliatory killings of wildlife or violations of conservation laws, like setting illegal traps or using banned chemicals, are also disqualified. These exclusions aim to discourage unlawful actions, promote compliance with conservation laws, and ensure support is provided only to legitimate victims of MAC. The cleaned data of successfully claimed compensation cases allows for classification based on the type of damage caused and the animal species involved. Analysing this data can help prioritize mitigation strategies, allocate resources effectively, and design targeted interventions for species-specific conflicts.
The integration of technology for a literature survey by litmaps, as shown in Fig. 1, enabled the identification of trends and gaps in existing research on geo-tagged Cases and non-geo-tagged cases of MAC, with Fig. 2 providing a real-time network visualization of MAC studies from 1928 to 2024 created by litmaps tool on research literature survey. 39-42. This approach, combined with the geographic and temporal analysis of MAC incidents (Fig. 3 and 4), highlights the significant spatial and contextual variability in conflict occurrences. Geo-tagged data provides precise location-based information, enabling the mapping and spatial analysis of MAC incidents. By identifying conflict hotspots and tracking animal movement patterns, geo-tagged data allows for the correlation of these patterns with human settlements, agricultural areas, and forest boundaries. This spatial data is crucial for designing targeted mitigation strategies, such as creating wildlife corridors or buffer zones, and supports real-time monitoring and visualization. As a result, specific regions requiring immediate intervention can be easily pinpointed. The geo-tagged data requires accurate location information and can be limited by reporting inconsistencies or the availability of geo-tagging technology.
The key advantages of geo-tagged data is its ability to track animal movement within and around human settlements, agricultural zones, and forest boundaries. This insight helps understand the behaviour of conflict-causing species, such as elephants or leopards, which informs the creation of wildlife corridors, buffer zones, or early-warning systems to prevent future conflicts. Real-time data collection also allows for immediate response actions, such as deploying patrol teams or adjusting infrastructure, significantly reducing conflict incidents. Geo-tagged data supports long-term monitoring and trend analysis, enabling the identification of temporal patterns, such as seasonal variations or shifts in animal migration routes. This dynamic approach is essential for adapting mitigation strategies to changing environmental conditions or population dynamics. Furthermore, it enhances community involvement by providing actionable insights into where and when conflicts are most likely to occur, empowering local stakeholders to take preventive measures.
In contrast, non-geo-tagged data lacks specific location information and focuses on broader aspects of the conflicts, such as the types of animals involved, the severity of incidents, and the financial impact. While this data is easier to collect, it is more tedious for analysis and management. Non-geo-tagged data helps in identifying long-term trends, categorize animals causing conflicts, and evaluate the compensation on affected communities. Lack of spatial context makes it difficult to target specific regions for intervention, reducing its ability to analyse the relationship between animal movement and human activity.
The comparison between the two types of data highlights their distinct roles. Geo-tagged data excels in spatial analysis, enabling the identification of conflict hotspots and facilitating targeted interventions. It provides detailed information about specific locations and events, making it essential for location-specific actions. On the other hand, non-geo-tagged data offers a broader understanding of trends, such as the animals most commonly involved and the financial implications. While geo-tagged data is more effective in guiding specific interventions, non-geo-tagged data provides valuable insights into the overall scope of MAC. Both data types are essential for a comprehensive study of MAC, with geo-tagged data driving targeted actions and non-geo-tagged data offering a wider perspective on the conflict landscape.
The study examines the financial dimensions of MAC, with Fig. 5 and 6 illustrating the Ex-Gratia Payment Hierarchy and compensation distribution across administrative circles can lead to significant crop damage. To mitigate financial strain on farmers, compensation is provided for crop losses, with amounts determined based on the extent of the damage and type of crop. For instance, Banana (Musa spp.), which is highly susceptible to wildlife interference, has received a compensation amount of ?20.93 M, while Paddy (Oryza sativa), often grown in flood-prone areas, is compensated with ?16.48 M. Corn (Zea mays), Ragi (Eleusine coracana), and Sugar Cane (Saccharum officinarum), essential crops in the region, receive ?8.01 M, ?6.95 M, and ?6.16 M, respectively. Other crops such as jowar (Sorghum bicolor) and tomato (Solanum lycopersicum), which are grown under varying rainfall conditions, are compensated with ?5.21 M and ?2.36 M, respectively. Spices such as Black Pepper (Piper nigrum) and cardamom (Elettaria cardamomum), which are sensitive to both environmental conditions and wildlife foraging, receive compensation amounts of ?1.46 M and ?0.86 M. While Groundnut (Arachis hypogea) and cotton (Gossypium hirsutum) are also affected by wildlife activities, they are compensated with amounts of ?1.45 M and ?0.80 M, respectively. Crops such as mango (Mangifera indica) (6-10 years plants) and ginger (Zingiber officinale), which are crucial to local livelihoods, receive compensation amounts of ?1.34 M and ?1.14 M, respectively. Additionally, smaller crops such as Beans (Phaseolus vulgaris), Soya (Glycine max), and Potato (Solanum tuberosum) receive ?0.66 M, ?0.50 M, and ?0.49 M as compensation.
The e-Parihara system plays a crucial role in streamlining compensation claims through automated processes, ensuring timely compensation for farmers and raising awareness about the impact of wildlife on agriculture. This system is vital for managing the risks associated with MAC while promoting sustainable agricultural practices and protecting diverse forest ecosystems. The implementation of e-Parihara, alongside Karnataka's digital compensation platform, has significantly improved the efficiency of processing and disbursing compensation claims. The platform’s features, such as real-time tracking of claims and enhanced transparency through ground inspections by forest officials with victim evidence, strengthen its role as a conflict management tool. Additionally, local community involvement can further enhance its effectiveness. While progress has been made in addressing human-animal conflict in Karnataka, a comprehensive approach combining technology, community engagement, and ecological planning is essential for sustainable conflict resolution (Fig. 5 and Fig. 6). The compensation analysis, detailed in Fig. 7 and Table 2, provides insights of 2019 to 2023, types of animals involved and the financial implications of these conflicts. Additionally, the study evaluates resource allocation for mitigation efforts, with Tables 3 and 4 focusing on the prioritization of areas most affected by MAC, and Fig. 8 tracking compensation trends over a decade (2014-2024). The ex-gratia payment hierarchy for addressed MAC cases is as follows: The Forest Ministry has allocated ?1.5 M, typically for cases involving human death, injuries, or partial permanent impairment, covering a few hundred cases. At the next level, the Principal Chief Conservator of Forests (PCCF) and Additional Principal Chief Conservator of Forests (APCCF) are each entitled to ?0.7 M. This amount generally applies to incidents involving large-scale commercial crop damage, human injuries, and numerous cattle kills. The Chief Conservator of Forests (CCF) is also provided ?0.7 M, while the Conservator of Forests (CF) receives ?0.5 M. These payments are associated with incidents that involve less commercial crop damage but significant damage to horticultural and agricultural crops, human injuries, and cattle kills. Further down the hierarchy, the Deputy Conservator of Forests (DCF) is granted ?0.2 M, and the Assistant Conservator of Forests (ACF) is allocated ?0.07 M. Finally, the Range Forest Officer (RFO) and Deputy Range Forest Officer (DRFO) receive ?0.042 M and ?0.015 M, respectively, for damage to vegetables, cereals, and pulses. (Fig. 4 and Fig. 5).
Visual Representation of the diverse factors contributing to human-animal conflict can enhance the understanding and retention of complex information, making it easier for stakeholders, policymakers, and researchers to understand the multifaceted nature of the issue Segmented Presentation: Each factor is presented in a separate section, allowing for a clear and focused examination of its impact on human-animal conflict. The rise in MAC incidents during this period led to significant losses in various categories: Elephants are among the most significant contributors to crop damage due to their preference for high-calorie crops such as bananas, paddy, sugarcane, and maize. They are known to raid fields extensively in regions adjacent to forests, particularly in southern India. Studies by Sukumar have highlighted their impact on sugarcane and banana plantations, which are often located in their migratory corridors42. Wild boars are notorious for their rooting behaviour, which leads to extensive damage to paddy fields, maize crops, and tubers. They are especially problematic in areas near forest boundaries. Research by Chauhan et al. documents significant economic losses caused by wild boars in agricultural zones, particularly in Karnataka43, the study shows the highest conflict cases next to elephant, the results depicted in Fig.7.
Leopards are primarily associated with livestock predation near agricultural lands rather than direct crop damage. However, this often leads to secondary impacts, such as farmers abandoning fields due to fear of leopard attacks. Athreya et al. have reported such instances, linking leopard presence to indirect agricultural losses.44 Similarly, tigers are more involved in livestock predation, with their impact on crops being indirect through the abandonment of fields in conflict zones.45 Gaurs graze on sugarcane, maize, and paddy fields, particularly in areas adjoining forests. Studies in the Western Ghats document frequent instances of gaurs feeding on these crops.38 Likewise, sloth bears are known to feed on sugarcane due to its sweetness, causing significant losses in fields close to forested areas.46
Peacocks and spotted deer (Axis axis) are also frequent crop raiders. Peacocks damage grain crops like maize and paddy during the harvest season, while spotted deer graze on paddy and maize fields, particularly during lean seasons when forest resources are scarce.31 Blackbuck and chinkara are known to graze on standing crops such as Ragi, pulses, and cereals, especially in semi-arid and grassland-agriculture ecotones.47 Primates, including common Langur, bonnet macaques (Macaca radiata), and lion-tailed macaques frequently raid fruit crops such as bananas, jackfruit, and other cultivated produce. These species have been widely reported as major pests in southern India, particularly in regions with extensive fruit plantations.48 Other species, such as sambar deer, four-horned antelope, and hyenas, occasionally affect crops. While sambar deer browse on paddy and maize fields, four-horned antelope occasionally graze on crops near forest edges. Hyenas primarily scavenge near farmlands, indirectly contributing to conflict. Carnivores such as Indian wolves, Indian foxes, and leopard cats are typically associated with livestock predation, which can indirectly impact agriculture through retaliatory actions by farmers.49 In wetland and riparian areas, crocodiles occasionally impact agricultural communities by preying on livestock near paddy fields. Monkeys and Langur are widespread and target a variety of crops, leading to substantial economic losses for farmers in areas where these species coexist with humans. 50, 51 Together, these species represent a complex web of interactions that contribute to crop damage and man-animal conflict across agricultural landscapes (Fig. 9).
This emphasizes the value of learning from past experiences to identify successful strategies and lessons, guiding the development of more effective and sustainable human-animal conflict management approaches.33, 52 The statement underscores the need to understand the factors behind human-animal conflict and use existing knowledge to develop effective management strategies. Table 2 reveals that elephants account for the highest compensation and case numbers, primarily due to crop and property damage. Wild boars rank second for crop-raiding, while leopards are involved in livestock predation near settlements. Gaur and tigers cause conflicts at forest edges, while sloth bears and crocodiles are involved in localized conflicts. Species like spotted deer and black buck contribute to crop grazing, while others, such as the Indian wolf and common Langur, show minor involvement. Rare species, like the lion-tailed macaque, have minimal interaction with humans. These findings highlight the need for species-specific mitigation strategies, especially for elephants and wild boars. The spatial patterns of conflict suggest that agricultural fields and water sources, particularly near protected areas like Bandipur, Nagarhole, and Bannerghatta National Parks, and Bhadra Tiger reserves are the hotspots for human-animal interactions. 53, 54 Mitigation strategies should focus on integrating proactive measures, such as installing physical barriers (e.g., solar fencing, trenches) and promoting alternative livelihoods to reduce dependency on forest resources. Awareness campaigns and community involvement in conservation initiatives are crucial for fostering coexistence.
Conclusion
The findings reveal a significant increase in MAC incidents and compensation accountability, underscoring the urgent need for expanded wildlife habitats and targeted management strategies. To address environmental and socio-economic challenges, the following recommendations are proposed: a) Redesign protected areas based on wildlife density, with the possibility of expanding buffer zones. b) Implementation of site-specific, sustainable barrier, and fencing systems. c) Empower indigenous communities by integrating traditional knowledge with advanced management practices. Geospatial mapping of incident and compensation hotspots offers valuable insights for the development of effective management strategies. This Geo-tagged conflict cases help in the accurate assessment of mitigation measures through strategic planning, particularly by providing site-specific camera traps and enhancing the combination of fencing mechanisms. The location-based information is critical for key stakeholders, including local communities, wildlife experts, government agencies, and NGOs, to understand the diverse perspectives, concerns, and expectations surrounding MAC. Community Engagement and Education strategies should focus on involving local communities in conflict resolution and prevention while developing educational programs to promote coexistence and responsible behaviour.
Acknowledgement
The author would like to thank the Environmental Science Department for granting Ph.D. research work and OBC Cell, University of Mysore. Special thanks to the Karnataka forest department for their support.
Funding Sources
The author(s) received no financial support for the research, authorship, and/or publication of this article
Conflict of Interest
The author(s) do not have any conflict of interest.
Data Availability Statement
The authors confirm that the data supporting the findings of this study are available within the article.
Ethics Approval Statement
This research did not involve human participants, animal subjects, or any material that requires ethical approval.
Informed Consent Statement
This study did not involve human participants, and therefore, informed consent was not required.
Author Contributions
Pavithra, G. M and Venkataramana, G. V: Conceptualization, Methodology, Writing – Original Draft.
Pavithra, G. M: Data Collection, Analysis, Writing – Review & Editing.
Pavithra, G. M and Venkataramana, G. V: Visualization, Supervision, Project Administration.
Venkataramana, G. V: Funding Acquisition, Resources, Supervision.
References
- Sethi, S. A., & Ghosh, S. (2023). Human-wildlife conflict and its socio-economic implications in biodiversity-rich areas: A case study of Karnataka, India. Journal of Environmental Management, 308, 113557. https://doi.org/10.1016/j.jenvman.2022.113557
- Kumar, V., & Bhardwaj, A. (2021). The growing challenges of human-wildlife conflict in agricultural zones of India: Insights from Karnataka. Wildlife Research, 48(4), 354-365. https://doi.org/10.1071/WR20148
- Ghosh, S., & Sethi, S. A. (2022). Human-wildlife conflict and habitat fragmentation: A case study of the wild boar and gaur in South India. Environmental Conservation, 49(4), 377-386. https://doi.org/10.1017/S0376892922000273
CrossRef - Jhala, Y. V., Qureshi, Q., & Gopal, R. (2011). Status of the Indian wolf (Canis lupus pallipes) in India. Journal of Mammalogy, 92(6), 1211-1221. https://doi.org/10.1644/10-MAMM-A-348.1
- Ramesh, K., & Kaur, S. (2022). Managing human-elephant conflict: A review of recent mitigation strategies in South India. Global Ecology and Biodiversity, 31(1), 22-35. https://doi.org/10.1111/geb.13439
CrossRef - Sharma, P., & Prakash, V. (2022). Impact of land-use changes on human-wildlife conflict: A study in Karnataka's protected areas. Environmental Science and Policy, 128, 56-67. https://doi.org/10.1016/j.envsci.2021.11.011
CrossRef - Patel, M., & Karanth, K. U. (2021). Monitoring and mitigating human-wildlife conflict: Advances in technology and community engagement. Biological Conservation, 254, 108951. https://doi.org/10.1016/j.biocon.2021.108951
CrossRef - Wildlife Crime Control Bureau (WCCB) Portal. Retrieved from http://www.wccb.gov.in. Accessed 2021.
- M-Stripe (Monitoring System for Tigers, Rhinos, and Other Wildlife). Retrieved from https://www.wii.gov.in/. Accessed 2021.
- e-Compensation System, Madhya Pradesh Forest Department. Retrieved from http://forest.mp.gov.in/. Accessed 2021.
- iTrack Wildlife, Wildlife Conservation Trust. Retrieved from https://www.wctindia.org/. Accessed 2021.
- Community-based Platforms, Coorg Wildlife Society. Retrieved from http://www.coorgwildlifesociety.org/. Accessed 2021.
- Forest Watch (Global Initiative), World Resources Institute. Retrieved from https://www.globalforestwatch.org/. Accessed 2021.
- Asaikutti A, Gunasekaran C, Rajasekar P, Siva T. Annotations and suggestions on elephant-proof trenches to reduce human-elephant conflicts in Coimbatore forest division, South India: Effectiveness of EPT on Human Elephant Conflict. J Adv Appl Sci Res. 2022; 4(3).
CrossRef - Karanth KK, Gupta S, Vanamamalai A. Compensation payments, procedures, and policies towards human-wildlife conflict management: Insights from India. Biol Conserv. 2018; 227:383-389.
CrossRef - Madhusudan MD, Sharma N, Raghunath R, Gubbi S, Nanjappa H, Kumar A, Ramesh K, Vijayan V, Reddy P, Somashekar RK, Kumar S. Distribution, relative abundance, and conservation status of Asian elephants in Karnataka, southern India. Biological Conservation. 2015; 187:34-40. doi:10.1016/j.biocon.2015.04.011.
CrossRef - Ashish K, Ramesh T, Kalle R, Arumugam R. Generalization of threats attributed to large carnivores in areas of high human-wildlife conflict. Conserv Biol. 2022.
CrossRef - Gulati S, Karanth KK, Le NA, Noack F. Human casualties are the dominant cost of human-wildlife conflict in India. Proc Natl Acad Sci U S A. 2021; 118(8):e1921338118.
CrossRef - Madhusudan MD, Karanth KU. Local hunting and the conservation of large mammals in India. Conserv Biol. 2002.
CrossRef - Gunawansa TD, Perera K, Apan A, Hettiarachchi NK. Greenery change and its impact on human-elephant conflict in Sri Lanka: A model-based assessment using Sentinel-2 imagery. Int J Remote Sens. 2023;44 (16):5121-5146.
CrossRef - Joshi A, Datar M, Narain S, Shrivastava S. Assessing land-use and land-cover changes in Kodagu, Karnataka: A spatial analysis approach. Environ Dev Sustain. 2023.
- La Grange MM, Matema C, Nyamukure B, Hoare R. The virtual fence dynamic: A breakthrough for low-cost and sustainable mitigation of human-elephant conflict in subsistence agriculture. Front Conserv Sci. 2022;3: 863180.
CrossRef - Sukumar R. Ecology of the Asian elephant in southern India: Feeding habits and crop raiding patterns. J Trop Ecol. 1990;6(1):33-53. doi: 10.1017/S0266467400003800.
CrossRef - Chauhan NPS, Barwal KS, Kumar D. Human-wildlife conflict in India: A case study. Int J Trop Biodivers Conserv Res. 2009;1(1):1-12.
- Athreya V, Odden M, Linnell JDC, Karanth KU. Big cats in our backyards: Persistence of large carnivores in a human-dominated landscape in India. PLoS One. 2013;8(3):e57872. doi: 10.1371/journal.pone.0057872.
CrossRef - Srinivasan K, Johnsingh AJT, Madhusudan MD. Human-wildlife interaction in the Western Ghats: Impacts of crop raiding by wildlife on local communities. Biodivers Conserv. 2010;19(3):857-869. doi: 10.1007/s10531-009-9733-2.
- Bargali HS, Akhtar N, Chauhan NPS. Sloth bear habitat use and human-bear conflicts in India. Ursus. 2005;16(2):216-223. doi: 10.2192/1537-6176(2005)016[0216:SBHUHC]2.0.CO;2.
CrossRef - Bhatnagar YV, Mishra C, Bagchi S. Status and ecological observations on blackbuck (Antilope cervicapra) in India. J Bombay Nat Hist Soc. 2000;97(1):47-58.
- Karnataka Forest Department. (2022). Annual Report on Human-Wildlife Conflict Mitigation in Karnataka. Bangalore: Karnataka Forest Department. Retrieved from https://aranya.gov.in/
- Sakala Portal. (2023). e-Parihara Platform: Enhancing Transparency in Conflict Management. Karnataka Government Services. Retrieved from https://sakala.karnataka.gov.in/
- Imam E, Yahya HSA, Malik I. A perspective on primate crop-raiding behavior in India: Magnitude and farmer responses. Curr Sci. 2002;83(6):731-734.
- Jhala YV, Qureshi Q, Gopal R, Sinha PR. Status of tigers, co-predators, and prey in India. Natl Tiger Conserv Auth WII Tech Rep. 2003; 9:1-120.
- Júnior ECB, Rios VP, Dodonov P, Vilela B, Japyassú HF. Effect of behavioural plasticity and environmental properties on the resilience of communities under habitat loss and fragmentation. Ecol Model. 2022;472:110071.
CrossRef - International Fund for Animal Welfare (IFAW). The impact of climate change on animals. Retrieved December 14, 2024, from https://www.ifaw.org/journal/impact-climate-change-animals.
- BMC Ecology and Evolution. Human population growth and its effects on biodiversity. Retrieved December 14, 2024, from https://bmcecol.biomedcentral.com/articles/10.1186/s12898-020-00319-1.
- Litmaps. Real-time network visualization of man-animal conflict studies (1928-2023). Connected Papers. Retrieved December 14, 2024, from https://www.litmaps.com.
- Becerra S, Marinero J, Borghi CE. Poaching and illegal wildlife trade in western Argentina. Ethnobiology and Conserv. 2022; 11.
CrossRef - Srinivasan K, Johnsingh AJT, Madhusudan MD. Human-wildlife interaction in the Western Ghats: Impacts of crop raiding by wildlife on local communities. Biodivers Conserv. 2010; 19(3):857-869. doi: 10.1007/s10531-009-9733-2.
- Lions Tigers & Bears. Threats facing tigers today and our efforts to help. Retrieved December 14, 2024, from https://www.lionstigersandbears.org/threats-facing-tigers-today-and-our-efforts-to-help/.
- Frontiers in Ecology and Evolution. Mapping human-wildlife conflicts: Understanding and predicting spatial patterns. Retrieved December 14, 2024, from https://www.frontiersin.org/research-topics/55124/mapping-human-wildlife-conflicts-understanding-and-predicting-spatial-patterns.
- Agent-based modeling of elephant crop raiding in India. https://arxiv.org/abs/2404.09024. Accessed December 14, 2024.
- Frontiers in Ecology and Evolution. Conflict hotspot prediction in the Daba Mountains, China. Retrieved December 14, 2024, from https://www.frontiersin.org/journals/ecology-and-evolution/articles/10.3389/fevo.2024.1435811/full.
- Chauhan NPS, Barwal KS, Kumar D. Human-wildlife conflict in India: A case study. Int J Trop Biodivers Conserv Res. 2009; 1(1):1-12.
- Athreya V, Odden M, Linnell JDC, Karanth KU. Big cats in our backyards: Persistence of large carnivores in a human-dominated landscape in India. PLoS One. 2013; 8(3):e57872. doi:10.1371/journal.pone.0057872.
CrossRef - Bargali HS, Akhtar N, Chauhan NPS. Sloth bear habitat use and human-bear conflicts in India. Ursus. 2005; 16(2):216-223. Doi: 10.2192/1537-6176(2005)016[0216: SBHUHC] 2.0.CO; 2.
CrossRef - Bhatnagar YV, Mishra C, Bagchi S. Status and ecological observations on blackbuck (Antilope cervicapra) in India. J Bombay Nat Hist Soc. 2000; 97(1):47-58.
- Imam E, Yahya HSA, Malik I. A perspective on primate crop-raiding behavior in India: Magnitude and farmer responses. Curr Sci. 2002; 83(6):731-734.
- Madhusudan MD. Living amidst large wildlife: Livestock and crop depredation by large mammals in the interior villages of Bhadra Tiger Reserve, South India. Environ Manag. 2004; 314: 466-475.
CrossRef - Gouda KC, Nikhilasuma P, Benke M, Agnihotri G. Assessment of rainfall variability over Karnataka state in India. Natural Hazards Research. 2023
- Ramsay MS, Mercado Malabet F, Klass K, Ahmed T, Muzaffar S. Consequences of habitat loss and fragmentation for primate behavioral ecology. In: Primates in Anthropogenic Landscapes: Exploring Primate Behavioural Flexibility across Human Contexts. Cham: Springer International Publishing; 2023:9-28.
CrossRef - Smith TAH. Elucidating the effects of habitat loss, fragmentation, and the matrix across populations and communities using landscape-scale experiments. Doctoral dissertation, University of Florida. 2023.
- Pratchett MS, Coker DJ, Jones GP, Munday PL. Specialization in habitat use by coral reef damselfishes and their susceptibility to habitat loss. Ecol Evol. 2012; 2(9):2168-2180.
CrossRef - Karanth KK, Kudalkar S. History, location, and species matter: Insights for human-wildlife conflict mitigation from India. Hum Dimens Wildl. 2017; 22(4):331-346.
CrossRef - Ravenelle J, Nyhus PJ. Global patterns and trends in human-wildlife conflict compensation. Conserv Biol. 2017; 31(6):1247-1256.
CrossRef


