Post Occupancy Evaluation of Indoor Air Quality in Green Rated Commercial Interiors
Sujata Abhijit Karve
*
 and Rucha Nachane
1
Dr. Bhanuben Nanavati College of Architecture,
Pune,
Maharashtra
India
http://dx.doi.org/10.12944/CWE.18.1.27
Copy the following to cite this article:
Karve S. A, Nachane R. Post Occupancy Evaluation of Indoor Air Quality in Green Rated Commercial Interiors. Curr World Environ 2023;18(1). DOI:http://dx.doi.org/10.12944/CWE.18.1.27
Copy the following to cite this URL:
Karve S. A, Nachane R. Post Occupancy Evaluation of Indoor Air Quality in Green Rated Commercial Interiors. Curr World Environ 2023;18(1).
Download article (pdf)
Citation Manager
Publish History

Introduction
The nature of air within a space determines the air quality inside and is linked to the health, wellbeing, and comfort of the occupants1. Pollutant concentration within the standard limits renders the air quality as acceptable. Since we spend over 90% of our time inside, maintaining excellent indoor air quality is crucial2. Building characteristics like its design, construction, operation, and maintenance play a role in the building’s energy consumption as well as its indoor air quality. The buildings should be designed considering occupant’s health and well-being in-addition to functionality, aesthetics, energy efficiency and sustainability.
WHO defines Air Pollution as “contamination of the indoor or outdoor environment by any chemical, physical or biological agent that modifies the natural characteristics of the atmosphere.”3 Indoor pollution is defined as "the presence of physical, chemical or biological contaminants in the air."4
Internal sources that release chemicals are one of the primary causes of indoor air pollution. Sometimes due to these substances the quality of air inside may be worse than the air outside. The concentration of indoor contaminants may increase due to poor ventilation, and air circulation, lack of humidity control, off-gassing from interior materials and finishes like paints and coatings, adhesives and sealants, carpets, furniture, and cleaning reagents. The effects of pollution may be short term or long-term depending on the nature of pollutant and period of exposure. Long term effects are manifested through respiratory problems, heart conditions, and even cancer whereas short term effects can be seen in the form of fatigue, headache etc.5
The need for airconditioned spaces has led to the design of airtight buildings. Connection between indoor and outdoor for ventilation has diminished leading to an increase in pollutant levels within a building. The effect is seen on the occupant’s health, wellbeing, and productivity making it a matter of public concern. This led to the concept of "sick building syndrome" (SBS) which is a term used to describe circumstances in which building occupants have severe health problems that appear to be related to their stay in a building but for which no cause can be found6. According ASHRAE (62-1989), a building is termed as sick when more than 20% occupants complain of irritation, headache, etc. and feel relieved once they go out. There could be several reasons of air pollution inside a space other than biomass fuel burning and most of the people are under the impression that they are safe indoors7. Various studies have studied the effect of polluted air in various building typologies but not many studies are available on office interiors and academic buildings in India8. Though WHO (2002) mentions that the highest number of diseases in India are caused due to indoor air pollution exposure, less attention has been given to its study as compared to outdoor air pollution.
The sealed environments in office buildings aid in increasing the concentration of chemicals or compounds in the air. The indoor air can get contaminated due to interior materials and finishes like paints, adhesives and sealants, furniture, carpets; human activities; poor ventilation. Various green building rating systems award credits for the use of specified the VOC’s (volatile organic compounds) of interior materials with an intention to improve the indoor air quality. But there are insufficient studies related to analysing the effectiveness of this in achieving better indoor air quality. The purpose of this study was to analyse the indoor air quality of IGBC (Indian Green Building Council) certified green commercial interiors of office buildings through a post occupancy evaluation method. The study also tried to identify the factors that contributed to the indoor air pollution in these spaces.
Post Occupancy Evaluation
Post-occupancy evaluation is a diagnostic tool used to evaluate the quality of building in a systematic manner after the building is commissioned, used by the users, and occupied for some time9.
From an architectural perspective, the Royal Institute of British Architects defined Post-Occupancy Evaluation as “the process of obtaining feedback on a building’s performance in use after it has been built and occupied” 10. Post-occupancy evaluation (POE) allows facility manager to investigate the critical aspects of building for better performance and is related to the occupants of the building and their needs. POE can be carried out in three ways viz. indicative, investigative, and diagnostic.
Indoor Air Pollutants
Biological, chemical, and particulate pollutants make up the three main categories of air pollution. Indoor Air Quality guidelines as stated by WHO lists out the various sources of indoor pollution of which the following have been included in the current study, Total Volatile Organic Compounds, Formaldehyde, Particulate Matter (PM 2.5), Particulate Matter (PM10) and Carbon dioxide.
Volatile organic compounds
Organic chemicals having high vapour pressure and low boiling point and those that can vaporize easily at room temperature are known as Volatile Organic Compounds. Infiltration through the building envelope or intake through mechanical ventilation allows VOC’s from outside to enter the building 11. VOCs' indoor sources include Building supplies and furniture like paints, adhesives, carpets, etc.; cleaning supplies, disinfectants; insect repellents; carbonless copy paper; electronic devices like printers and copiers; craft supplies like permanent markers, glue, adhesives, and photography solutions; pesticides; aerosol sprays; and wood preservatives. A study conducted by Wensing et. al, (2008) found electronic devices can act as an emission source of VOC in indoor air 12. A study conducted by Chan & Chao, (2002) found that during the daytime, building material, occupants, and outdoor sources are the main contributors of TVOC . Temperature, relative humidity, strength of the source, ventilation rate, and other variables all affect TVOC concentrations. Emission rate and diffusion increases with increase in temperature. During summers, there is an increase in TVOC concentration as compared to winter. Lower temperature and less than 30% relative humidity reduces the TVOC concentration in newly built structures. The off gassing of VOCs from materials lasts for at least two years 13.
Formaldehyde:
Formaldehyde is a flammable, highly reactive, colourless, strong – smelling pungent gas. Products made of pressed wood, such as particleboard, plywood, and fibreboard, glues and adhesives, permanent-press textiles, paper product coatings, and specific insulation materials can all be sources of formaldehyde inside. Increase in ventilation rates does not fully resolve indoor formaldehyde pollution 14. There is an inverse correlation between the concentration of formaldehyde concentration in indoor air and the air exchange rate. It was concluded through experiments that emission factor increases with a rise in temperature and humidity 15.
Particulate Matter
A complex mixture of solid and/or liquid particles suspended in air is referred to as particulate matter (also known as PM or particle pollution). They are of various size, shape, and composition. Exposure to PM 2.5 is considered as the top ten risks which leads to a lower life expectancy across the world as assessed by ‘Global Burden of Disease’ (GBD) 16. The negative role of fitted carpets was highlighted in the studies conducted by Ragazzi, Rada, Zanoni & Andreottola (2014) where it was seen that these carpets captured the dust and released it during the transit of people walking over it 17. Large number of ultrafine particles (UFP) to fine particles are emitted by laser printers during the printing process which are maximum during initial cold start prints 18.
Carbon dioxide (CO2)
Carbon dioxide is a colourless, tasteless, odourless, and non- flammable gas. It is heavier than air and may cause oxygen deficiency as may accumulate at lower spaces. It is an indicator of inadequate air quality rather than as a specific indoor air pollutant. The outdoor air flow rate and the time spent by the occupant inside the building leads to higher indoor CO2 concentration than the outdoor concentration 19. The study by Azuma et. al (2018) was able to determine the ill effects on health due to short time exposure to carbon dioxide levels above 1000 ppm and prove that building related illness was linked to low-level exposure (700 ppm) of carbon dioxide 20.
Green Rating Systems
Indian Green Building Council (IGBC)is a rating system which promotes the construction of green and sustainable buildings. It provides guidelines for the construction of environment friendly buildings which perform better in terms of economic and environmental factors. IGBC also focuses on occupant health and well-being, a prime factor while designing any building. It provides guidelines to improve the quality of air inside any space. The credits prescribed by IGBC for improving indoor air quality in interior projects are related to fresh air ventilation, CO2 monitoring, provision of indoor plants, minimising indoor pollutant contamination, low emitting materials and interior flush out.
Indoor Air Monitoring Methods and Guidelines
Currently there are no protocols or guidelines for indoor air quality (IAQ) monitoring for indoor spaces in India, contrary to ambient air quality standards of 1988. There is an inconsistency in the quantity of indoor air contaminants to be measured. Additionally, there is a lack of information regarding the monitoring criteria, recommendations for the necessary instrument types, and sample analysis techniques 21. The bulk of techniques are determined by the chemicals of interest and the necessary sampling time. Each approach has a certain level of sensitivity and specificity. There is no single technique that can be used to monitor IAQ accurately 22. There are numerous methods to measure organic compounds in an indoor environment, and the selection depends on the objectives of the study and the available resources 23.
Standards for evaluating IAQ
Occupational Safety and Health Administration (OSHA) guidelines that provide information on how to manage IAQ effectively, including how to reduce airborne pollutants, introduce and disperse enough make-up air, and maintain a comfortable temperature and relative humidity, the WHO guidelines, the WELL Building Standard®, for buildings of commercial type and institutional nature, the WHO guidelines, and the National Institute for Occupational Safety and Health (NIOSH) guidelines are among the standards for evaluating IAQ in buildings.
Methodology and Methods
The study to ascertain the indoor air quality in office buildings used the investigative post-occupancy evaluation method. The guidelines prescribed by “European collaborative action: indoor air quality &its impact on man” (1993) have been adopted for the monitoring purpose 24.
Initially, office certified by IGBC were identified. Permission for the study was sought from the office through mail and official letter. Once the permission was received, the field study was carried out at the convenient date and time given by the office manager.
The monitoring and data collection was based on selection of spaces within the building, location within the selected spaces, sampling conditions and position of sampler. Spaces were selected based on the characteristics of the space like office spaces, cabins, conference rooms etc. Normal conditions of occupancy, activity of occupants, ventilation, temperature, and humidity were considered for the samples. The sampler was placed at the breathing zone position which is considered at 1m to 1.5m above floor level. Long-term sampling technique that lasts from several hours to few weeks was adopted for the study. The sampling duration was derived from "United States Environmental Protection Agency: Testing for Indoor Air Quality Section 01 81 09," which specifies three consecutive days for sampling and averaging the results of each three-day test cycle to determine compliance or noncompliance with regard to indoor air quality 25. The readings were taken in the month of March, 2019. Two readings were taken for three consecutive days, first when the office opened at 9:00 AM, second when the office was partly occupied (around 10% occupied) and third when there was full occupancy at 3:00 PM. The readings taken at different timings helped to analyze the changes in pollutant levels due to occupancy and time of the day. The averages of the data collected for three days was analyzed and compared with The Well Building Standard® v1. The areas where the measurements went over the threshold limit were noted, and the likely causes of the rise in pollutant levels were investigated.
The Extech Indoor Air Quality CO? Datalogger and Air Detector Air Quality Pollution Meter were used for measuring the selected parameters. The Indoor Air Quality CO? Datalogger was used to measure CO2, temperature, and humidity. The test range for CO2 was 0.000-9.999 ppm, for temperatures -10° C to 60° C and humidity range was 0.1 to 99.9 % RH. The Air Quality Pollution Meter was used to measure formaldehyde, TVOC, PM 2.5 and PM10. The detection mode for HCHO and TVOC was diffusion type and for PM 2.5 and PM10 it was density (per litre). The acceptable limit as prescribed by the Well Building Standard was adopted for evaluating the IAQ as seen in Table no. 1 below.
Table 1: Acceptable limits for each pollutant as per standards.
| Pollutant Name | Acceptable Limit | Reference Guide |
Total volatile organic compounds
| 500 or fewer µg/m3, or 0.5 mg/m3, | Building Design and Construction Reference Guide for LEED v4 by USGBC, 1.1.b For an indoor air quality assessment to receive credit, there must be evidence of total VOC levels below 500 g/m3. |
Formaldehyde
| Less than 27 ppb i.e. 0.03375 mg/m3 | Building Design and Construction Reference Guide for LEED v4 by USGBC, 1.1.a For the Indoor Air Quality Assessment to receive credit, formaldehyde levels must be fewer than 27 ppb. |
Particulate matter 2.5 | Less than 15 ?g/m3 | 1.2.a According to the EPA's 2012 NAAQS, PM2.5 concentrations must be less than 12 µg/m3 for the primary annual mean, 15 µg/m3 for the secondary annual mean, and 35 µg/m3 for the 24-hour averaged over three years. |
Particulate matter 10 | Less than 50 ?g/m3 | 1.2.c The 24-hour mean concentration limit for PM10 is 50 µg/m3, according to the Air Quality Guidelines for Particulate Matter, Ozone, Nitrogen Dioxide, and Sulfur by WHO |
Carbon dioxide | Below 800 ppm | According to the Indoor Air Quality Guidelines by IDPH, adequately ventilated buildings should have an average carbon dioxide level of 800 ppm or less on each floor. |
Results and Discussion
A case of an office interiors certified by Indian Green Building Council were selected. The chosen case has received the certification from IGBC around 2-3 years ago.
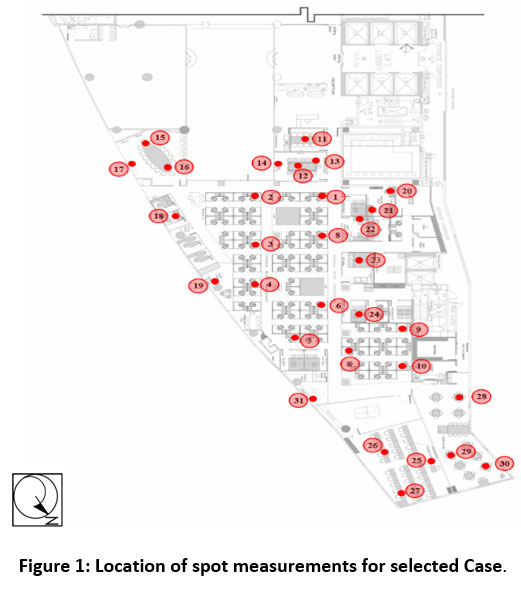
The selected case was an IGBC Certified Green Interiors office space in Pune with a total area of 9209.83 Sq. ft. Measurements were taken at 31 locations in the office. Fig. 1 shows the locations where measurements were taken. Each of the locations that were chosen had unique features, including varied materials, person counts, furniture layouts, office desk counts, printer, scanner, and photocopier counts, windows, and natural ventilation. The data provided by the office was analysed to understand the materials used and credits achieved for the rating. As required by the rating system low emitting materials were used for interior paint, interior work adhesive, HVAC duct insulation adhesive, carpets and composite wood for furniture. The office had received complete credits related to interior materials and indoor air quality. All regularly inhabited spaces were designed with fresh air ventilation that meets the minimum ventilation requirements outlined in ASHRAE* Standard 62.1 - 2010. A minimum of 12% increased fresh air ventilation was provided in most spaces even going upto 66% increase in admin rooms and cabins.
.jpg) | Figure 1: Location of spot measurements for selected Case.
|
Total Volatile Organic Compounds
From the analysis of the data as shown in fig 2 below, it was seen that the average concentration of TVOCs was within the limit prescribed under the WELL Building Standards except for spots 12-14 (conference room 1). As per standards the prescribed limit is less than 0.5 mg/m3 which is seen in Fig 2 as the red dotted line. 9.67% areas of all the measured spots experienced higher TVOCs levels. The average lowest concentration of TVOCs was observed at spot 29 (in the café) with 0.245 mg/m3 whereas the average highest concentration of TVOC was at spot 12 (conference room 1 at the center of the table) with 0.689 mg/m3.
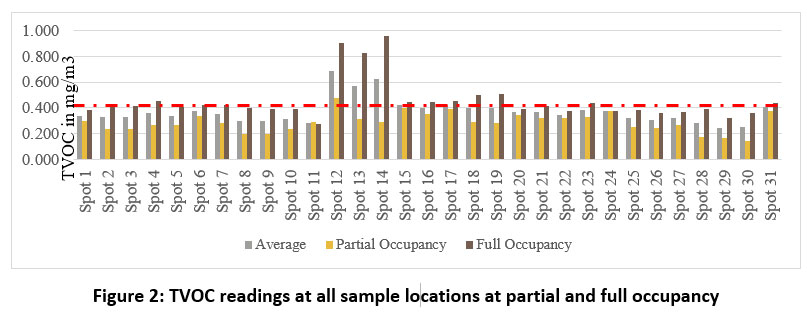 | Figure 2: TVOC readings at all sample locations at partial and full occupancy.
|
Based on the data collected as well as the observations conducted during field study, the probable factors responsible for increased TVOC levels in some of the areas were identified. Active computer processing leading to increased power use resulted in the increase of the total VOC emissions 12. As the HVAC system was controlled by the users, the switching on and off the air conditioner was solely dependent on the user. It was observed that the HVAC system was switched off for most of the day at spot 23 – VP room, by the user. Due to the low ventilation rate the TVOC levels could have exceeded the limit. Also, printers emit higher levels of TVOCs 12 during the printing sequence due to which spots 19 and 20 could have experienced higher TVOC level.
Formaldehyde
Formaldehyde concentration at partial and full occupancy were measured as seen in Fig.3 below. As seen from the figure, The HCHO concentration exceeded the limit set by The Well Building Standard which has to be less than 0.03375 mg/m3, at most of the locations on all the three days. The prescribed limit has been shown as a red dotted line in fig.3 below. The workstation areas experienced HCHO levels higher than the prescribed limit for all the three days. The full occupancy readings exceeded the limit set for formaldehyde in all the spaces except for spots 11-18 (meeting room 1, conference room 1 and 2, and cubicle). 74.19% areas of all the measured spots experienced higher HCHO levels during full occupancy.
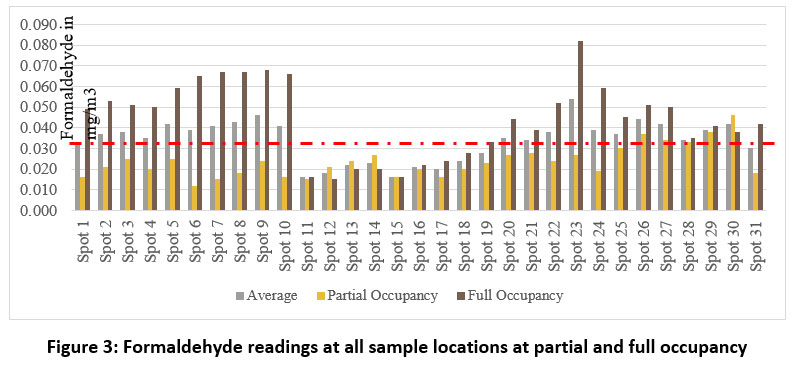 | Figure 3: Formaldehyde readings at all sample locations at partial and full occupancy
|
The findings were derived from the data collected and observations made on the field. It was observed that almost 90% of the occupants at the workstation were working on two computers which may have resulted in higher concentration levels at these locations. Emission rates of formaldehyde increase due to increase in temperature. The temperature observed at spots 28-30 were high and did not meet the standards set by ASHRAE 55-1-2010. High formaldehyde concentration at these spots could be due to the increase in temperature. Spots 11-17 were rarely occupied and hence the concentration in these spaces went higher only when there was occupancy and use of electronic equipment. Spot 11-18 are not frequently occupied so the HCHO emission from external factors are not seen in these areas. Only emissions from interior materials could be the probable source of formaldehyde. The formaldehyde concentration mainly depends on the materials used in the interior space. As low-emitting materials are used in the entire office, the emission from the materials would be low as compared to conventional materials. It is ambiguous to draw the conclusion that these factors influenced the low or high concentration levels of HCHO in Case 1 office spaces because the spot measurement did not really quantify the HCHO emissions from the office equipment and interior materials.
Particulate Matter – PM2.5
As seen in Fig 4. which shows the concentration levels of PM2.5 during partial and full occupancy, the average concentration of PM2.5 exceeded the limit prescribed under the WELL Building Standards except for spot 16 - conference room 2 – near the entrance during partial occupancy. The prescribed limit as per standard is less than 15 µg/m 3 which is shown as a red dotted line in fig.4 below. 100% areas of all the measured spots experienced higher PM2.5 levels. But readings taken at full occupancy were within the prescribed limits as per the standards. One of the factors that govern the particle concentration is ventilation. In the absence of ventilation, the particle concentration increases as it gets accumulated. When the office opens in the morning it could have accumulated dust, bacteria and allergens present in the indoor air. The HVAC system circulates fresh air within the building and exhausts stale air outside, thus particulate matter concentrations are higher at the beginning of an office day than they are after occupancy. The sweeping and mopping of the office during the working hours also result in the lower PM2.5levels.
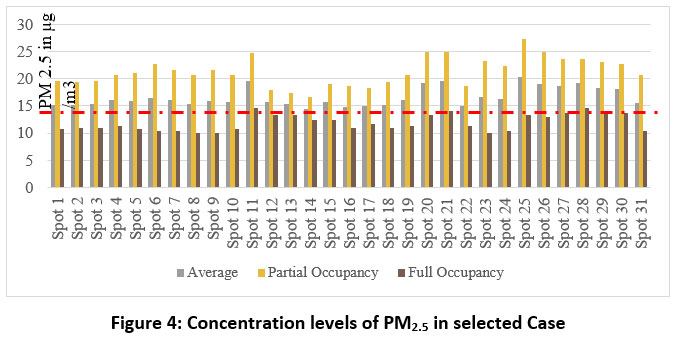 | Figure 4: Concentration levels of PM2.5 in selected Case
|
Particulate Matter 10 (PM10)
The average concentration as also concentration at partial and full occupancy of PM10 was within the limit prescribed under the WELL Building Standards for all the spaces as seen in Fig. 5 below. The prescribed limit as per standards is less than 50 µg/m 3. It was observed that due to the cleaning activities performed in the office, there was less accumulation of dust, bacteria and moulds inside the office.
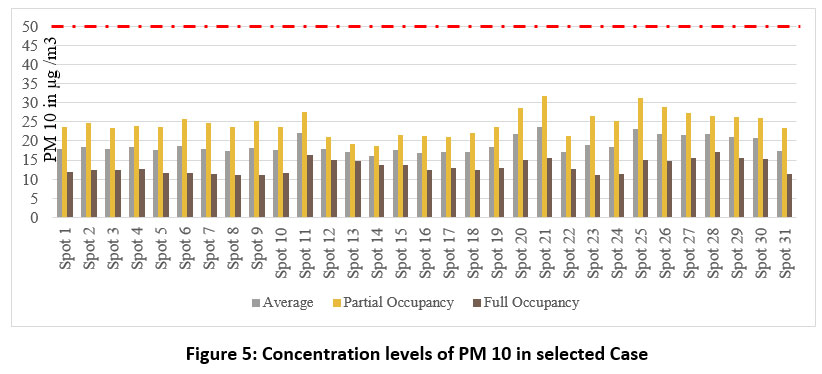 | Figure 5: Concentration levels of PM 10 in selected Case
|
Carbon dioxide (CO2)
The average concentrations in all the office spaces exceeds the limit prescribed by v1 of The Well Building Standard® and the concentrations at partial and full occupancy too exceed the prescribed limits (Fig. 6). Although the CO? level exceeds the limit prescribed by The Well Building Standard®, it meets the standards set by ASHRAE. The standard limit for CO2 is below 800ppm. 41.9% areas of all the measured spots experienced higher CO? levels. From the data, it could be seen that as carbon dioxide is an occupant related pollutant, the level of such pollutants rises in the afternoon. The maximum average and maximum post-occupancy average were both high in VP cabin as the HVAC which was user controlled was kept off most of the time resulting in poor ventilation and fresh air intake. Even though the provided outdoor air flow rate exceeds the required minimum ventilation rate, the concentration of carbon dioxide exceeded in office spaces.
The office did not have the provision of timely flush out of the indoor air which can cause the level of pollutants inside to increase.
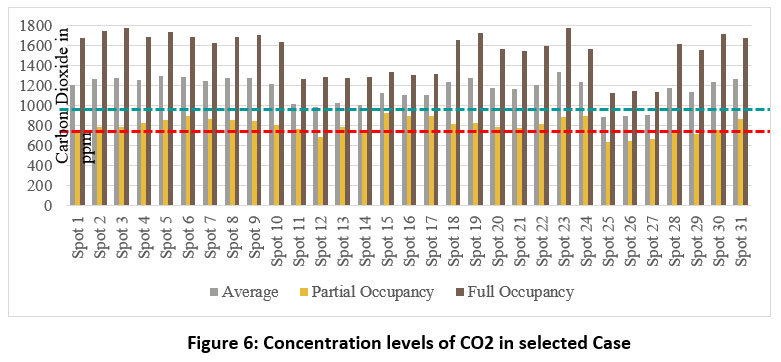 | Figure 6: Concentration levels of CO2 in selected Case
|
Post the analysis of individual pollutants, statistical analysis was conducted with the help of SPSS statistical analysis tool to determine whether any correlation existed between the various pollutants and other factors like occupancy, temperature and humidity. An analysis of variance (ANOVA) was also carried out to test the hypothesis which stated that there was no difference in the value of the pollutant’s pre-occupancy and post-occupancy.
A KMO and Bartletts test was conducted to check the sample adequacy. As seen in Table 2, the sample is just adequate (.551) with a significance of .000.
Table 2: KMO and Bartlett’s Test for sample adequacy
KMO and Bartlett's Test | ||
Kaiser-Meyer-Olkin Measure of Sampling Adequacy. | .551 | |
Bartlett's Test of Sphericity | Approx. Chi-Square | 184.563 |
df | 28 | |
Sig. | .000 | |
The ANOVA test was conducted as a paired sample T-Test which tried to analyse the values of pollutants pre-occupancy and post-occupancy. As seen in Table 3, there is a significant difference seen for volatile organic compounds (p< .05 =.024), PM2.5 (p< .05 =.036), PM10 (p< .05 =.048) and CO2 (p< .05 =.007) values pre-occupancy and post-occupancy. Hence the null hypothesis was rejected and an alternative hypothesis stating that there is a difference in the values of volatile organic compounds, PM2.5, PM10 and CO2 pre and post occupancy.
Table 3: Paired sample T-Test
Paired Samples Correlations | ||||
N | Correlation | Sig. | ||
Pair 1 | TVOC_pre_occupancy & TVOC_post_occupancy | 31 | .405 | .024 |
Pair 2 | FRML_pre_occ & FRML_post_occ | 31 | -.033 | .858 |
Pair 3 | PM2.5_pre_occ & PM2.5_post_occ | 31 | .378 | .036 |
Pair 4 | PM10_pre_occ & PM10_post_occ | 31 | .358 | .048 |
Pair 5 | CO2_pre_occ & CO2_post_occ | 31 | .478 | .007 |
Pair 6 | Temperature_pre_occ & Temperature_post_occ | 31 | .039 | .835 |
A correlation was also conducted to understand correlations between the various pollutants and factors like occupancy, temperature, and humidity. The average values of all the pollutants and factors were considered for this analysis. The analysis revealed that temperature was positively correlated with formaldehyde (p<.05 = .004), PM2.5 (p<.05 = .001), PM10 (p<.05 = .001) and negatively correlated with total volatile organic compounds (p<.05 = .002) as seen in Figure 9 below. It was also seen that humidity was significantly correlated positively with total volatile organic compounds (p<.05 = .001)and negatively correlated with formaldehyde (p<.05 = .024). Occupancy did not have any significant correlation with any of the pollutants.
Table 4: Correlation Analysis
| Correlations | |||||||||
| TVOC _avg | FRML_avg | PM2.5_avg | PM10_avg | CO2_avg | Temperature _avg | Humidity | Occupancy | ||
| TVOC_avg | Pearson Correlation | 1 | -.673** | -.446* | -.463** | -.269 | -.534** | .552** | -.336 |
| Sig. (2-tailed) | .000 | .012 | .009 | .143 | .002 | .001 | .064 | ||
| N | 31 | 31 | 31 | 31 | 31 | 31 | 31 | 31 | |
| FRML_avg | Pearson Correlation | 1 | .210 | .233 | .401* | .505** | -.406* | .260 | |
| Sig. (2-tailed) | .256 | .208 | .025 | .004 | .024 | .157 | |||
| N | 31 | 31 | 31 | 31 | 31 | 31 | 31 | ||
| PM2.5_avg | Pearson Correlation | 1 | .968** | -.430* | .556** | -.343 | .053 | ||
| Sig. (2-tailed) | .000 | .016 | .001 | .059 | .776 | ||||
| N | 31 | 31 | 31 | 31 | 31 | 31 | |||
| PM10_avg | Pearson Correlation | 1 | -.392* | .565** | -.311 | .146 | |||
| Sig. (2-tailed) | .029 | .001 | .089 | .433 | |||||
| N | 31 | 31 | 31 | 31 | 31 | ||||
| CO2_avg | Pearson Correlation | 1 | .054 | .252 | .120 | ||||
| Sig. (2-tailed) | .775 | .171 | .520 | ||||||
| N | 31 | 31 | 31 | 31 | |||||
| Temperature_avg | Pearson Correlation | 1 | -.621** | .393* | |||||
| Sig. (2-tailed) | .000 | .029 | |||||||
| N | 31 | 31 | 31 | ||||||
| Humidity | Pearson Correlation | 1 | -.298 | ||||||
| Sig. (2-tailed) | .104 | ||||||||
| N | 31 | 31 | |||||||
| Occupancy | Pearson Correlation | 1 | |||||||
| Sig. (2-tailed) | |||||||||
| N | 31 | ||||||||
| **. Correlation is significant at the 0.01 level (2-tailed). | |||||||||
Conclusions
The analysis of the case study from data collected through on-site measurements and site observations indicate high levels of CO2 concentrations despite enhanced ventilation provisions. The fresh air ventilation should adhere to ASHRAE standard 62.1-2010's minimum ventilation rates. As the office was an IGBC certified for Green Interiors, most of the spaces had been provided enhanced ventilation with a percentage increase ranging from 12% to 65%. User controlled HVAC systems if kept shut may lead to ineffective ventilation leading to higher CO2 concentrations. Ventilation also plays a role in regulating the level of concentration of PM2.5 in the indoor spaces. Thus, the concentration levels of PM2.5 are higher during partial occupancy i.e during mornings when the HVAC systems have still not been started. Concentration of formaldehyde was observed to be dependent on temperature and thus the areas of higher temperature showed higher measurements of formaldehyde concentrations. The volatile organic compounds (TVOC’s) were well within the prescribed limits which can be attributed to the use of low emitting materials specified by the IGBC rating system. The increased values seen in some areas could be attributed to the higher use of electronic equipment like computers and printers.
The statistical analysis also reinforced earlier research which mentioned that lower humidity results in lower TVOC values but contrary to prior research, higher temperatures resulted in lower TVOC values. Similarly, higher temperature and humidity values resulted in higher emissions of formaldehyde was also as seen in earlier studies.
From the above case study, it could be concluded that low-emitting materials and finishes used in the office interiors helped to lower the concentration of pollutants in the indoor environment but the concentrations of these various pollutants depended also on several other factors like the ventilation system, use of electronic equipment, frequency of cleaning practices, occupancy etc. It should be mentioned that improving indoor air quality depends in large part on the ventilation system. Good air quality in indoor environments can enhance the health and wellbeing of the occupants. The study helped to prove that providing low-emitting materials was an insufficient strategy to improve the quality of indoor air if not supplemented with factors like effective and efficient ventilation systems as well as better cleaning practices.
Acknowledgement
No separate one as the author was the research team.
Conflict of Interest
The Author(s) declares no conflict of interest between authors.
Funding Sources
The author(s) received no financial support for the research, authorship, and/or publication of this article.
References
- Sundell J. On the history of indoor air quality and health. Indoor Air. 2004; 14(s7), 51–58. https://doi.org/10.1111/J.1600-0668.2004.00273.X
CrossRef - Theakston F. WHO guidelines for Indoor Air Quality: Selected Pollutants. Germany: World Health Organization Regional Office for Europe; 2010. 444.https://apps.who.int/iris/bitstream/handle/ 10665/260127/9789289002134-eng.pdf.
- Glossary of Environment Statistics, Studies in Methods, Series F, No. 67, United Nations, New York, 1997. https://stats.oecd.org/glossary/detail.asp?ID=1336
- EPA United States Environmental Protection Agency. Indoor Air Quality. Epa.gov. https://www.epa.gov/report-environment/indoor-air-quality#:~:text=Health%20effects%20associated %20with%20indoor, %2C%20heart%20disease%2C%20and%20cancer. September 7 2021. 15/11/2022.
- Erdmann C. A., Steiner K. C., Apte M. G. Indoor carbon dioxide concentrations and sick building syndrome symptoms in the BASE study revisited: Analyses of the 100 building dataset. A compilation of papers for the Indoor Air 2002 Conference in memory of Joan M. Daisey. 2002;129-134
- 21- Goyal R., Khare M., P, K. Indoor Air Quality: Current Status, Missing Links and Future Road Map for India. Journal of Civil & Environmental Engineering.2012; 02(04).
- Datta A, R. Suresh, Gupta A, Singh D, Kulshrestha P. Indoor Air Quality of Non-Residential Urban Buildings in Delhi, India. International Journal of Sustainable Built Environment. 2017; 6(2): 412-420.
CrossRef - Peixian Li, Froese T.M., Brager G. Post-Occupancy Evaluation: State-of-the-Art Analysis and State-of-the-Practice Review. Building and Environment. 2018; 133: 187-202.
CrossRef - MacDonald P. Post Occupancy Evaluation – An Essential Tool to Improve the Built Environment. RIBA Architecture.com. 2020
- Chan G. Y., & Chao C. Y. Quantification of Indoor TVOC Levels from Different Sources in Mechanically Ventilated Buildings. Indoor Built Environment. 2002; 340-350.
CrossRef - Wensing M., Schripp T., Uhde E., Salthammer T. Ultra-fine particles release from hardcopy devices: Sources, real-room measurements and efficiency of filter accessories. Science of the Total Environment. 2008; 407(1): 418-427.
CrossRef - Holøs S. B., Yang A., Lind M., Thunshelle K., Schild P., & Mysen M. VOC emission rates in newly built and renovated buildings, and the influence of ventilation – a review and meta-analysis. International Journal of Ventilation. 2018.
- Wu X., Apte M. G., Maddalena R., & Bennett D. H. Volatile Organic Compounds in Small- and Medium-Sized Commercial Buildings in California. Environmental Science and Technology. 2011: 9075-9083
CrossRef - Parthasarathy S., Maddalena R. L., Russell M. L., & Michael. Effect of Temperature and Humidity on Formaldehyde Emissions in Temporary Housing Units. Journal of the Air & Waste Management Association. 2011; 689-695.
- L. Morawska, G. A. Airborne particles in indoor environment of homes, schools, offices and aged care facilities: The main routes of exposure. Elsevier - Environment International. 2017; 75-83.
- Ragazzi M., Rada E. C., Zanoni S., & Andreottol, G. The role of particulate matter in offices for urban air quality management. The Sustainable City IX. 2014; 1403-1412.
- McKone T., Maddalena R., Destaillats H., Hammond S. K., Hodgson A., Russell M., Perrino C. Indoor Pollutant Emissions from Electronic Office Equipment. 2009.
- Apte M. G., Fisk W. J., & Daisey J. M. Associations Between Indoor Carbon Dioxide Concentrations and Sick Building Syndromes in US Office Buildings. Munksgaard. 2000; 246-257.
CrossRef - Azuma K., Kagi N., Yanagi U., & Osawa H. Effects of low-level inhalation exposure to carbon dioxide in indoor: A short review on human health and psychomotor. Environment International. 2018; 121, 51-56.
- Panagiotaras D., Nikolopoulos D., Petraki E., Kottou S., Koulougliotis D., Yannakopoulos P., & Kaplanis S. Comprehensive Experience for Indoor Air Quality Assessment: A Review on the Determination of Volatile Organic Compounds (VOCs). Physical Chemistry & Biophysics. 2014.
- Crump D. (2001). Strategies and Protocols for Indoor Air Monitoring of Pollutants. Indoor Built Environ. 2001; 125-131.
CrossRef - Colombo A., De Bortoli M. European Collaborative Action ‘Indoor Air Quality & Its Impact on Man’ (formerly COST Project 613) : Determination of VOCs Emmitted from Indoor Materials and Products: Interlaboratory Comparison of Small Chamber Measurements. OPOCE. 1993
- Testing for Indoor Air Quality Section 01 81 09. United States Environmental Protection Agency. 2007. https://www.epa.gov/sites/default/files/2014-03/documents/018109.pdf https://www.who.int/health-topics/air-pollution (accessed on 8/11/2021).


