An Overview of Atmospheric Reactive Nitrogen Research: South Asian Perspective
Moh Naseem1 and Umesh Chandra Kulshrestha1 *
http://dx.doi.org/10.12944/CWE.14.1.04
Copy the following to cite this article:
Naseem M, Kulshrestha U. C. An Overview of Atmospheric Reactive Nitrogen Research: South Asian Perspective. Curr World Environ 2019;14(1).
DOI:http://dx.doi.org/10.12944/CWE.14.1.04Copy the following to cite this URL:
Naseem M, Kulshrestha U. C. An Overview of Atmospheric Reactive Nitrogen Research: South Asian Perspective. Curr World Environ 2019;14(1). Available from: https://bit.ly/2CZ49OU
Download article (pdf) Citation Manager Publish History


Introduction
In spite of frequent and significant alterations in the past, the earth’s environment has been amazingly constant for the past ten thousand years.1,2 This period is known as Holocene. In the Holocene epoch, nature driven the environmental change, by virtue of that regular temperature, biogeochemical flow, and freshwater availability, all confined within a comparatively narrow range, which allowed human development. But ever since the industrial revolution, the activities of the Anthropocene era significantly affected the global environment.3,4,5 The addition of nitrogen, phosphorus and carbon accelerated by the anthropogenic activities, are now so massive that they have the potential to significantly perturb global cycles of these biogeochemically important elements.6,7 It is important to mention that the earliest Earth’s nitrogen cycle was controlled by the sluggish geological processes and the atmospheric reactions, but by 2700 million years ago in the Archean aeon, the microbial activities were evolved which shaped the modern nitrogen cycle with strong natural controls and feedback.8
In the present era, the anthropogenic activities are constantly transforming the global nitrogen cycle at an unprecedented speed. This transformation is attributed to the proliferating demand of nitrogen for intensive agriculture, industrial activities burning of fossil fuels and ubiquitous inefficiencies in its use. The large emission of anthropogenic nitrogen makes its way to the air, water and land resulting in environmental degradation and human health problems.9 Diatomic nitrogen (N2) is an inert gas which comprises 78% of the atmosphere. Only certain bacteria and cyano bacteria, those are able to synthesise nitrogenase enzyme, can break the triple bond – a strong bond which holds both atoms of molecular nitrogen together. In spite of having the ability to produce nitrogenase enzyme, these nitrogen fixers are not able to readily fix the atmospheric nitrogen. The constraints behind this inefficiency are the high energy cost of running nitrogen nase and the massive requirement of other elements to produce this enzyme. This is why that productivity of many ecosystems and plant and algal biomass limited by nitrogen.10,11
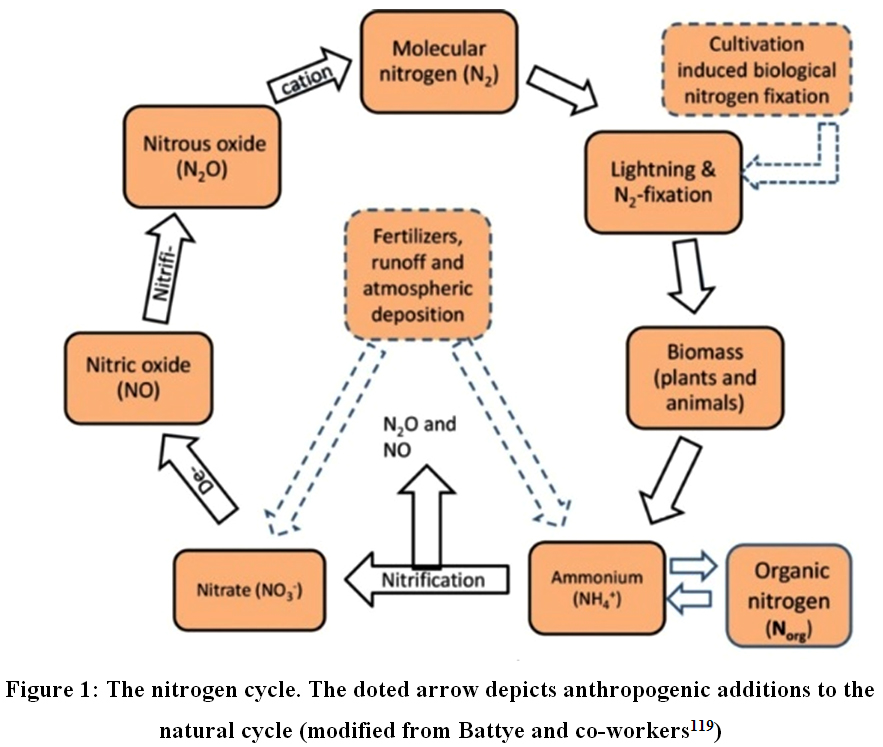 |
Figure 1: The nitrogen cycle. The doted arrow depicts anthropogenic additions to the natural cycle (modified from Battye and co-workers26) Click here to view Figure |
Agricultural productivity and nitrogen cycle
During early periods of agricultural practices, human returned human and animal waste to the field thus adding nitrogen (and phosphorus) and enhanced crop production. At the beginning of the 20th century, Fritz Harber and Carl Bosch developed an industrial process to remove synthesize reactive nitrogen (Nr) from atmospheric N2. This process soon became a mean to synthesize nitrogen-rich fertilizers. At the same time, the industrial processes and adoption of the internal combustion engine led to the ubiquitous emissions of oxidized nitrogen (NOx) to the atmosphere.12 Very soon promotion of food production through intensive agricultural practices using synthetic fertilizers became a source of environmental deterioration. It is surprising to note that since the 1970s, the increase in world population is 78% while the creation of reactive nitrogen has enhanced by 120% and every year it is continued to increase. Anthropogenic activities, primarily manufacturing of fertilizer for intensive agriculture and farming of leguminous crops transform ~ 120 million tonnes of atmospheric N2 per year into Nr which is very huge quantity. Much of this newly produced Nr makes its way to the environment, accumulating in land system, polluting waterways and coastal zones and adding a number of gases to the atmosphere.13
Sources of reactive nitrogen
Natural sources
Biological nitrogen fixation (BNF) in marine ecosystems
BNF is the microbial-mediated group of reactions which transform diatomic Nitrogen (N2) into ammonia (NH3). BNF act as input process by which Nr enters into the ocean and land environment. With a suggested range of 60-200 TgN/yr,14 BNF in global marine ecosystems has been calculated as 125 TgN/yr.15 In addition to this, other estimates show its rate as 140 TgN/yr16 and 145 TgN/yr.17 In the same flow Voss et al.,18 suggested this value of 140 (±50) TgN/yr for global marine BNF.
Biological nitrogen fixation (BNF) in terrestrial ecosystems
BNF is considered as a primary, non-anthropogenic input of fixed nitrogen, making it an important reference in the quantification of the magnitude of anthropogenic inputs to global nitrogen cycle.19 Since its identification in late 19th century, BNF has been considered as a topic of ecological interest.17 In a review, Vitousek et al.,20 estimated that the pre-industrial terrestrial BNF was 58 (the range of 40-100) TgN/yr. However the range of uncertainty is broad and there is the scope of more work on BNF estimates.20
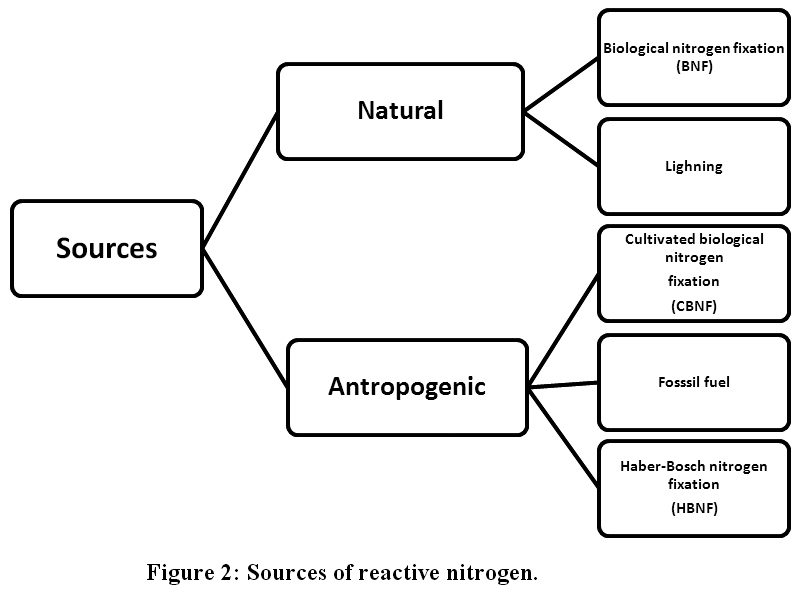 |
Figure 2: Sources of reactive nitrogen. Click here to view Figure |
Lightning
Lightning represents a crucial source of Nr species (NOx) in the troposphere.21-22 Levy et al.,23 bracketed the global annual NOx emission in the range of 2-6 TgNy/yr, with most the probable range between 3-5 TgN/yr, with the more latest value of closer to 5 TgN/yr.
Anthropogenic sources
In spite of being uncertain, human-induced nitrogen fixation is well known than natural nitrogen fixation.24 The Anthropogenic creation of reactive nitrogen is mainly attributed to three sources.
The Harber-Bosch industrial synthesis
Haber-Bosch synthesis used to reduce N2into NH3, primarily for the synthesis of nitrogen fertilizers and also as feedstock for some industrial processes. From the beginning of this century, each year 120 TgN/yr or NH3 is produced by the Harber-Bosch process has produced. Eighty per cent of this NH3 has been utilized in the synthesis of nitrogen fertilizer and reaming 20% is utilized for industrial processes as feedstock.9
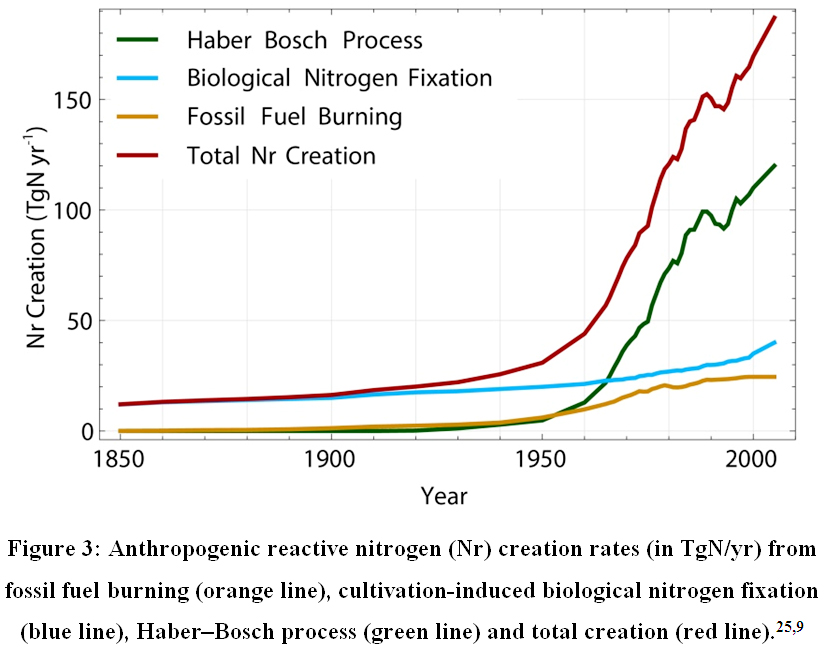 |
Figure 3: Anthropogenic reactive nitrogen (Nr) creation rates (in TgN/yr) from fossil fuel burning (orange line), cultivation-induced biological nitrogen fixation (blue line), Haber–Bosch process (green line) and total creation (red line).32,9 Click here to view Figure |
Note that updates are given in Table 6.9. The data are only reported since 1850, as no published estimate is available since 1750.38
Cultivated biological nitrogen fixation (CBNF)
In the latest review, Herridge et al.,25 have reported Nr creation by CBNF in the range between 50 and 70 TgN/yr. The central value of this range is 60 TgN/yr. These authors have used, combined unpublished and published data reporting the fixation of nitrogen with the data on the yields and areas of cereals and legumes from the FAO database on agricultural production (FAOSTAT).25 It is apparent that the value of CBNF(60TgN/yr.) is very near to BNF(58 TgN/yr.) in the pre-industrial period.24
The burning of fossil fuels
Combustion of fossil fuel is attributed to release nitrogen into the atmosphere from the coal and petroleum which are the long term geological reservoir of fixed nitrogen. Moreover, the high-temperature combustion processes fixe a tiny fraction of atmospheric nitrogen. Combustion of fossil fuels within internal combustion engines and in power plants particularly for electricity generation is the most prevalent processes attributed to the creation of oxidized nitrogen compounds. The commonly generated compounds are mainly NO and NO2, which come into existence when atmospheric N2is oxidized, albeit nitrogen compounds in the fuel also contribute additionally to the formation of these compounds.27 An estimate from van Vuuren et al.,28 suggests that, for the year 2000, global production and emission of NOx is ~ 40 TgN/yr. Out of this total~ 40 TgN/yr, 30 TgN/yr is contributed by the combustion of fossil fuels, 5 TgN/yr comes from NO emission of soil, and 5 TgNy/r comes from burning of biomass. It is assumed, although with a large uncertainty, that, in spite of continued industrial development, control measures for emission in Africa and Asia, will reduce the emission approximately to a value of 30 TgN/yr, by the mid of 21st century.24
Other sources
Worldwide biosphere contains 1019 g of N in a fixed form that is considerably less than the 1021g of fixed nitrogen in total sedimentary rocks.17 This nitrogen is present in sedimentary rocks and particularly emanates when organic matter buried in freshwater and marine sediments. During this burial N is incorporated within sedimentary strata in the form of ammonium silicate minerals or in the form of organic nitrogen29 Moreover, biologically available nitrogen in the form of nitrate also found in arid regions in subsoil zones. It has been accumulating there throughout the Holocene epoch of the quaternary period.30
Limitations and the typical example of nutrient cycling postulated that terrestrial ecosystems gain new nitrogen only from the atmosphere, but Morford et al.,31 have shown that a tiny flux of Nr is also released from the sedimentary rocks rich in nitrogen (not shown in figure 2). This source of ecologically available nitrogen has been overlooked for a long time.
Impacts of Nr
Unprecedentedly increasing demand for more food and energy production massively leading to an increase in fertilizer use and fossil fuel combustion that are ultimately leading to intensified loss of Nr to the environment. The adverse impacts of these nitrogen additions are ubiquitous and manifolds, for example, degrading water (increasing nitrate concentration) and air quality (smog, ground-level ozone, particulate matters), biodiversity loss, climate change, fresh water eutrophication, stratospheric ozone depletion, and creation of dead zones in costal ecosystems.32,33 The impacts of Nrunder different categories have been discussed below.
Impacts on the atmosphere
Unlike atmospheric CO2 which has increased ~40% above its pre-industrial level,34 the amount of nitrogen in the environment has been increased by more than 100%. This increase is mainly attributed to anthropogenic activities.9 Only ¼ fraction of anthropogenically produced nitrogen by fossil fuel burning and industrial nitrogen fixation, per year makes its way to inert N2 gas,6 while most of the remaining ¾ fraction remain as reactive nitrogen and continues to recycle and accumulated through the environment for years or decades9consequently many trace gases including N2O, NO and NH3 liberated to the atmosphere.35 Nitrous oxide (N2O) is a very potent greenhouse gas.36 Emission of N2O directly affects global warming and its warming effects are long terms since its residence time in the atmosphere is >100 years.37 N2O enters in the troposphere primarily by soil microbial activities such as nitrification and denitrification. In the troposphere, N2O is unreactive while in the stratosphere, it is destroyed by reaction with excited oxygen atoms or by photolysis, where it can catalyse the process of the stratospheric ozone destruction. During the time interval from 1750 to 2011, N2O emission has increased by 20%, from 271 ppb to 324.2 ppb. Over the last three decades, atmospheric concentrations of N2O are increased at a rate of 0.73 ± 0.03 ppb/yr and its emissions by anthropogenic activities increased steadily over the last two decades and were 6.9 Tg/yr. The main emission sources of N2O are nitrification and denitrification reaction (see figure1) of Nr in the ocean and the soil environment.40,38
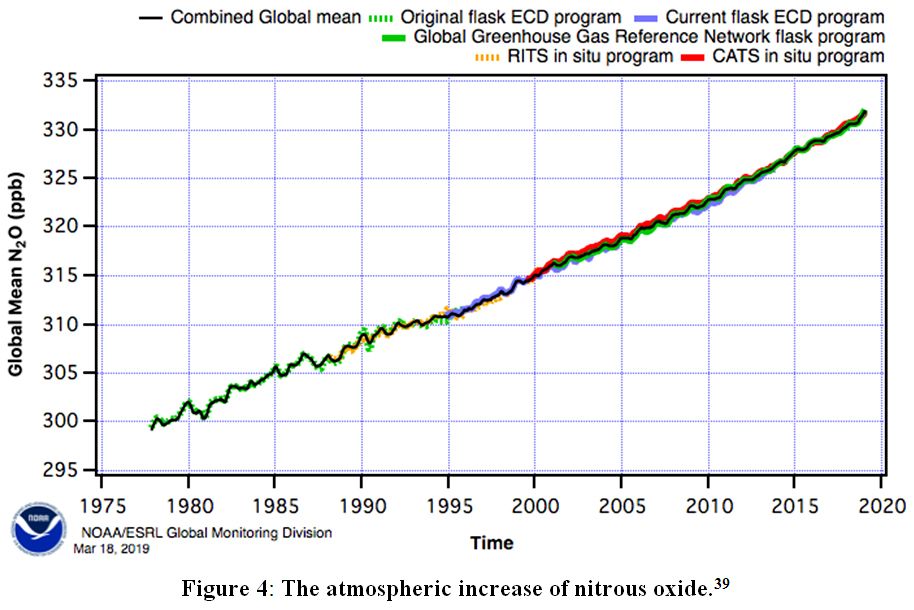 |
Figure 4: The atmospheric increase of nitrous oxide.39 Click here to view Figure |
Change in the concentration of NO and NH3needs to be evaluated at local, regional and sub-continental scales because the reason behind this fact is that both these gases are more reactive than N2O in the atmosphere. In fact, NO plays a very crucial role in many atmospheric reactions. It affects the concentration of OH radical- the main oxidizing agent- in the atmosphere.41 In addition to this, NO plays a key role in the photochemical formation of tropospheric ozone (O3), the most important gaseous pollutant that adversely affects the plant productivity and human health.41,42 When there are high concentrations of NO, the oxidation of methane, non-methane hydrocarbons and carbon monoxide, leads to net production of ozone,43,44 but during the time of low concentrations of NO, oxidation of these compounds acts as a sink for ozone. Finally, the oxidation of NO leads to the formation of HNO3, which is the principal component of acid rain. NO is emitted from a number of sources including microbial activities in fertilized soil but combustion is the largest source of NO emission.45
A study conducted by Crutzen46 and Johnston47 revealed that the nitrogen oxides (NOx = NO +NO2) catalytically destroy ozone via
NO + O3→ NO2 + O2
O + NO2→ NO + O2
Net: O + O3→ 2O2
The surface emission of N2O is the primary source of stratospheric NOX.48 The N2O is emitted in the troposphere where it is very stable and is transported to the stratosphere where it releases the active chemicals that destroy stratospheric ozone through nitrogen oxide–catalysed processes.49
In the atmosphere, ammonia acts as a primary acid neutralizer and influences the pH of rain water, cloud and aerosols. Akin to NO, after being emitted from its sources, ammonia is transported into the atmosphere and makes its way to ecosystems via dry deposition, gas absorption or in solution form. There are many studies which have demonstrated the volatilization of NH3 from nitrogenous fertilizers.50,51 Almost 70% of all global ammonia emissions come from anthropogenic sources.52 An accelerated deposition of nitrogen on land and in the ocean is concomitant to the accelerated emissions of nitrogen to the atmosphere.53
Impacts on human health
It is obvious that a sustained and active biosphere requires the addition of nitrogen into biologically important molecules.54 For example, the synthesis of protein and nucleic acid requires nitrogen.55 Presumably, 40% of the world’s dietary protein currently comes from syntactic fertilizers56 and in the absence of nitrogenous fertilizer -synthesized by the Haber-Bosch process- current food production would not be sufficient to sustain the unprecedentedly increasing world population.25 Although, products obtained from intensive agricultural practices in many developed countries, lead to unhealthy diets yet elsewhere depleted soil nutrient reserve, coupled with lack of synthetic fertilizers ultimately leads to widespread malnutrition.57 After entering the environment, Nr affects terrestrial, atmospheric and aquatic realms, and can affect human health and welfare in different ways.58 Creation of reactive nitrogen by humans can influence health in both negative and positive ways, but health benefits presumably saturate when the creation of reactive nitrogen increase, while negative impacts prevail and diversify. The increasing reactive nitrogen negatively affects human health both directly (e.g. air and water pollution) and indirectly (e.g. ecological feedback to disease).
The anthropogenic increase of reactive nitrogen in the environment leads to some direct and clear health consequence for a human. The term “direct” means health consequences due to the consumption of Nr particulates and other compounds e.g. nitrate in drinking water. Both in the developed as well as in the developing regions, ground water nitrate contamination is attributed to the fertilizer use. WHO has set a maximum standard concentration of 10 ppm nitrate-N in the safe drinking water.59,60 Several potential health consequences are attributed to the high nitrate level including cancer, methemoglobinemia or blue baby syndrome- infant is more prone to it- and reproductive system related problems.61,62
Increasing NOx level due to fossil fuel and biomass burning and the use of fertilizers leads to the production of tropospheric ozone.63 Moreover, NOx and O3 exposure can cause severe health effects such as eye irritation, cough, asthma, and induces inflammation of the respiratory tract etc.64 NO2 at high levels may be responsible for almost 2 million deaths per year due its indoor pollution effect,65 A positive correlation between fine particulate air pollution and respiratory disease, cardiovascular disease, overall mortality and asthma has been shown by multiple studies.66
Fixed inorganic nitrogen, most commonly nitrate (NO3-) and ammonium (NH4+) have very critical role in controlling the primary productivity of the biosphere67,25 and the anthropogenic augmentation of N to the environment can cause a substantial range of changes in ecology which almost certainly comprises the dynamic of some disease.68 There are now some evidence which suggest that the distribution and abundance of many crucial vectors, including the West Neil River and mosquito host of malaria, may be affected by the variation in nitrogen availability. A substantial number of studies have suggested that there is a positive correlation between the larval abundance of malaria Anopheles sp. mosquitoes and concentration of inorganic nitrogen in surface water.69,70 Positive correlations between the larval abundance of Anopheles and indices of algal productivity in Africa and Latin America have also been found69,71 but not such all correlation is positive.71 Eutrophication of marine and costal ecosystem is also a ubiquitous and clear effect of the proliferated nitrogen cycle.72 As an ecological change eutrophication may also affect human health since the ubiquitous increase in harmful algal blooms (HABs) has been attributed to nutrient loading caused by human activities.73,72 HABs may include toxins synthesized by the Pfiesteria Shumway and P. piscicida -the estuarine dinoflagellates- and by various cyanobacteria as well as amnesic, neurological, paralytic and/or diarrheic shellfish poisoning.73 Moreover, HABs can disrupt the source of nutrition and the ecosystem. In such a way they can indirectly affect humans.72 Ultimately, outbreaks of cholera have long been associated with algal bloom in coastal areas and the Vibrio cholera is associated with a broad range of marine life.74,75
How Nr affects to the natural ecosystem?
Several factors, including the form and the total amount of nitrogen, the duration of exposure, the intrinsic ecosystem properties such as acid neutralizing capacity and fertility and sensitivity of the species, determine the impact of Nr on the species.76 Organisms that uptake elements directly from the environment such as sensitive algae, bryophytes or lichens, can face toxicity at high concentrations of Nr (especially reduced N).77 Generally, Nr affects living creature through routes such as water or soil acidification, nutrient enrichment, oxygen depletion (in aquatic ecosystems), intensifying the effect of other stressors such as climate change or pathogens, or altering nutrient ratios.
The Eutrophication
The supply of essential nutrients such as N and P to the waters bodies from anthropogenic sources can provoke intensive production of algal biomass. This process is known as eutrophication. When microbes consume this organic matter, oxygen level plummets in water. Moreover, CO2 is produced when microbes respirate, which enhance the acidity of water.78-80 Usually surface sources such as fertilizer run-off, erosion of nutrient-rich sediments or sewage discharge emanate nutrient enrichment of coastal and freshwater ecosystems. Diversity or biomass may proliferate with the increasing nutrient load in an oligotrophic ecosystem.81 However, when there is an increase in the availability of Nr and phosphorus, phytoplankton those are efficient assimilator of these nutrients progressively favoured over species more limited by other factors (e.g. benthic primary producers, requiring light, or diatoms, requiring silica). It can result in algal and cyanobacteria bloom of low diversity which can lead to the release of toxic compounds and surface water hypoxia. Consequently, this can adversely affect the organism of a high trophic levels such as invertebrates and fish.82,83 Surface sediments and bottom waters particularly in ecosystems having low rates of water turnover, can be oxygen depleted due to the sedimentation and decomposition of phytoplankton bloom biomass.84 This again places the benthic community towards less tolerant species. This change in nutrient cycling, feedbacks to further alteration of the ecosystem. Alteration in the benthic community alters the cycling of nutrients in the sediment and overlying water.85
The terrestrial ecosystem
The high concentrations of reactive nitrogen directly lead to foliar damage and especially lower plant species are at high risk. Some reactive nitrogen species are particularly toxic to plants.86
In many terrestrial ecosystems, nitrogen act as limiting nutrient for the growth of plants87 and reactive nitrogen deposited through atmospheric deposition, potentially attenuates the plant species richness- considered as an important component of biodiversity- which can be defined as “the number of species in a given community”.88 Chronic nitrogen enrichment is attributed to the gradual increase of nitrogen availability to several types of vegetation. This increased availability of Nr leads to competitive exclusion –that is two or more species cannot coexist on a single resource, which is scare relative to the demand for this resource- of characteristics species by the plants which are hydrophilic in nature, especially where soil conditions are oligo to mesotrophic.6 When plant roots get bountiful amount of reactive nitrogen from nitrogen fertilization, they are less rely on the mycorrhizal fungi for their reactive nitrogen requirement which can lead to reduction in organic carbon allocation from plant to mycorrhizal fungi within the soil.89 Reactive nitrogen also affects to free-living bacteria and nitrogen-fixing fungi which can adversely affect important physical process of soil, like nutrient cycling and mineralization of organic matter. Change in microbial processes, microbial community or composition and growth of vegetation are the ways in which fauna present in soil react with nitrogen.90,91 When there is any alteration in the macrobiota of soil occurs, it causes a concomitant alteration in important physical properties of soil such as organic matter turnover, water infiltration and soil aggregation.92,93
South Asian scenario
Almost one-fourth population of the world lives in South Asia while it shares only 4.9% land of the total global landmass with 2.98% world’s forested land, 15.4% arable land of the world and 4% coastline of the world and comprises countries like Bangladesh, Afghanistan, Bhutan, Maldives, Nepal, Pakistan, Sri Lanka and India. Since Asia is agriculture dominated land, over the last three decades, it has witnessed the unprecedented hike in the consumption of nitrogenous chemical fertilizer that resulted in the degradation of environment and impairment of the ecological functioning. In spite of low external nitrogen use efficiency (as low as 30–35%), the South Asian region consumes 60% of the total global fertilizer nutrient. Satellite pictures for global ammonia column (mg m–2) taken by IASI (Infrared atmospheric sounding interferometer) emanate that Indo-Gangetic Plains (IGP) and it surrounding regions manifested by a massive atmospheric column of ammonia.94
Moreover, as one of the largest consumer of synthetically produced nitrogenous fertilizer, India consumes ~ 17 million tonnes N/yr(figure5).In India, the fate of the bountiful amount of anthropogenically released nitrogen to the environment is not completely known.95
It is worthy to notice that in 2015-2016 India consumed 15.5% of global fertilizer nitrogen production. Between 1970 and 2010 consumption of fertilizer nitrogen has witnessed a hike of 11 times and concomitantly Nr lost to the environment raised by ~4% and fertilizer nitrogen consumption by crops raised by 3 times for the same time duration. In addition to this CBNF is also an input pathway for nitrogen in the biosphere. Global CBNF has been estimated from 50-70 Tg/Nyr. Out of this 5.20TgN/yr to 5.76 TgN/yr is contributed by India alone out of this 43% is contributed by legumes and 32% by grains.
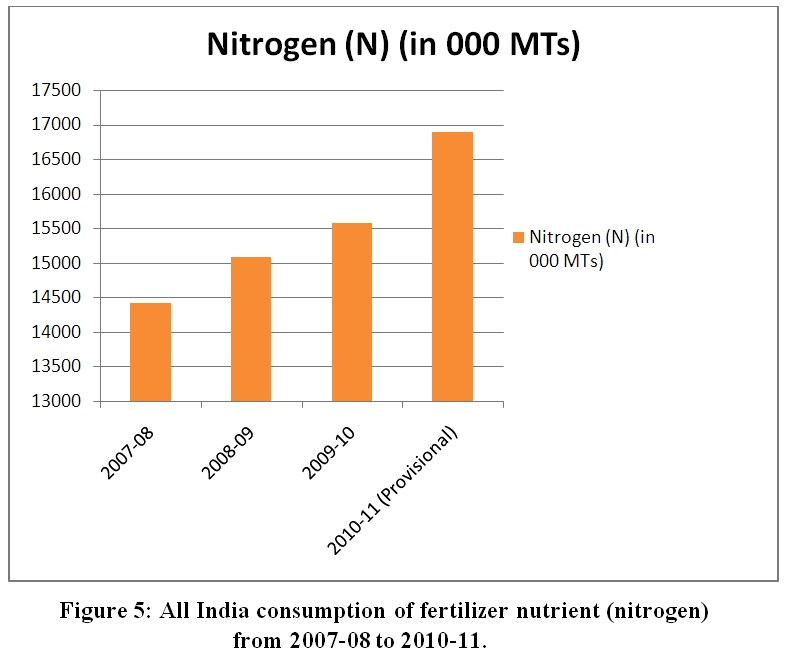 |
Figure 5: All India consumption of fertilizer nutrient (nitrogen) from 2007â€08 to 2010â€11. Click here to view Figure |
Mineral dust and its interaction with HNO3
Mineral dust affects atmospheric process both directly and indirectly. Moreover, soil particulates, blown by wind also significantly affect nutrient cycle or biogeochemical cycles. Soil receiving this deposition may become enriched with nutrients those otherwise were not present in these soils. Unlike temperate, tropical atmosphere has been attributed with high loading of mineral dust.96,97 The transport of nutrients through mineral dust can affect the primary production of terrestrial systems.98-100 Those regions where atmospheric dust is in abundance, almost all of the atmospheric nitrate is in the form of nitrate on dust. In addition to this, in both northern and southern hemisphere, more than 40% concentration of nitrate is associated with mineral dust. Since calcium shows high buffering capacity for nitric acid, the presence of calcium in mineral dust consolidates the fact that major components of total atmospheric nitrate are in the form of dust-associated nitrate. Transportation of nitric acid in the form of gas- phase is improbable to the longer distances but, adsorbing on the surface of mineral dust from source locations, nitric acid may reach in remote locations those initially do not have significant concentrations of HNO3. When associated with a large particle of mineral dust, HNO3 removed from atmosphere more faster in comparison of its dry deposition.101
In the troposphere, involving liquid phase (rain water, fog and cloud), gas phase and possibly certain suspended particles, there are many chemical pathways by which oxides of nitrogen and sulphur and organic compounds converted into acids. Reaction kinetics and the rate at which oxidizing species generated in the troposphere, critically affect the rate of acid generation.102 Figure 6 is depicting the mechanisms of wet and dry deposition in the troposphere.
The particle of mineral dust collected from the various part of the world shows association with nitrate as a result of heterogenous reaction and maximum peak intensity of nitrate ion found to be higher during the late afternoon, a time when the peak of gas-phase nitric acid was also highest.103 Several studies emanate the relation between nitrate and calcium ions. One such study is conducted by Pakkanen104 in southern Finland, which suggest that ambient nitric acid is neutralized by CaCo3 present in the dust particles. A study conducted by Hanke et al.,105 buttresses the fact that particles of mineral dust efficiently uptake the gas phase HNO3. This type of uptake may be significant for tropical countries like India.
Application of fertilizer nitrogen and dry and wet deposition NH3 and NO3 per hectare in India
Since 1950-51, fertilizer-N consumption in India has increased exponentially which is attributed to the intensive agricultural practices performed to feed the rapidly increasing population. A 314 fold increase in fertilizer N has been observed during a period of 64 years. It has increased from a value of only 0.055 Mt in 1950-51 to 16.75 Mt in 2013-14. Moreover, in 1951-52 per hectare fertilizer N consumption was 0.44 kgha-1 while it was 86.2 kgha-1in 2013-14. Currently, after China and the United States, India ranks third for fertilizer N consumption in the world. In India, agricultural consumption of total nitrogen has increased 3.58 in 1961 to 23.17 Tg in 2010.106
Deposition of atmospheric reactive nitrogen
Once emitted in the atmosphere, in atmosphere gas-phase, Nr species begin to transform and transport in the atmosphere and deposited away from the source region. These Nr species removed from the atmosphere through dry and wet deposition mechanisms. Weather dry or wet deposition will prevail; it depends on the climatological condition. In temperate regions, precipitation is the main mechanism for the scavenging of atmospheric pollutants, including Nr species throughout the year. But in the regions where dry conditions persist for a long period of time (having no or less precipitation), dry deposition is the key mechanism responsible for the removal of atmospheric pollutants. The last mechanism dominates in India since in India, ~ 90% precipitation takes place only during the monsoon period that extends from June to September month. In the rest months of the year, dry deposition is the dominating mechanism responsible for the removal of atmospheric pollutants. Since the tropical regions are dominated by ubiquitous solar radiation and atmospheric water vapour content, consequently there is a high rate of gas-phase to the particle-phase transformation of Nr species. Moreover, the fate of Nr species is determined by atmospheric acidity, particulate loading, land use dynamics, and photochemistry of the atmosphere.107 Mineral and soil dust suspended in the atmosphere, act as the primary scavenger for acidic nitrogenous species by heterogeneous chemical reactions.108-110
Wet deposition flux of Nr over the Indian subcontinent
Atmospheric deposition of Nitrate and ammonium aerosols can lead to eutrophication and acid deposition in the receiving environment. Moreover, gaseous Nr species like NO2 and NH3 can adversely affect ecosystem functioning. Kulshrestha et al.,111 reported NH4+and NO3- depositional flux at four sites of different land-use pattern like industrial, urban, sub-urban and rural. In this study, the highest NO3-N depositional flux found on urban and highest NH4-N depositional flux found to be on industrial site. The annual deposition of NO3-N at the urban, suburban, rural and industrial site found to be 4.48, 2.10, 4.06 and 3.92 kgha-1respectively. On the other hand, the annual deposition of NH4-N at the urban, suburban, rural and industrial site found to be 2.38, 2.10, 2.38 and 5.05 kgha-1respectively111. A multimodal evaluation of nitrogen deposition on regional and global scales has been reported by Dentener et al.,112 The wet flux of total average NO3-N and NH4-N are estimated to be a 6.01kgha-1 nitrogen deposition. For India, this value is equivalent to the wet deposition of 1.97 Tg N/yr. This depositional flux is far less than the amount nitrogenous fertilizer applied in agricultural practices.113
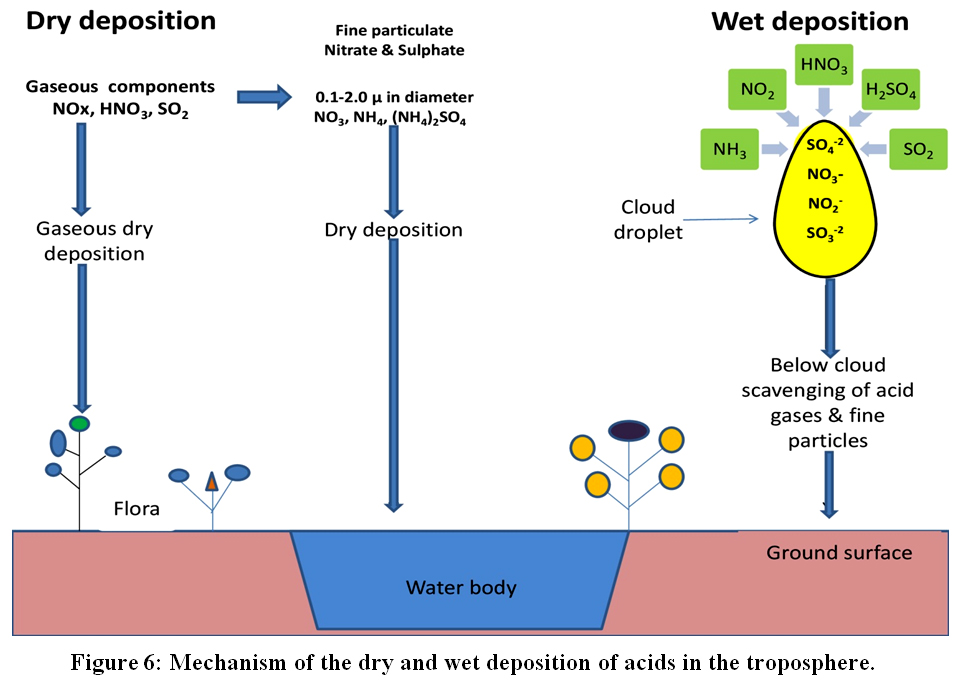 |
Figure 6: Mechanism of the dry and wet deposition of acids in the troposphere. Click here to view Figure |
Dry deposition flux of Nr over the Indian subcontinent
The processes “Dry deposition” act as a crucial agent in the removal of Nr from the atmosphere.114 In India, together with wet deposition, dry deposition of particles and gases is also equally significant and atmospheric dust play a key role in the dry deposition of Nr species. Depending upon the particle chemistry and atmospheric conditions, dust provides a crucial sink for gaseous HNO3, NO3- and NO2. Moreover, dust fall of NO3 and NH4 emanates crucial information regarding how gases and coarse particles interact. Study conducted by Tiwari et al.,115 on six sites of Delhi NCR showed that the dust fall NO3- flux ranged from 1.24 mg/m2/day at Chuchchak was village to 16.45 mg/m2/day at SMA industrial state while dust fall NH4+ flux ranges from 0 mg/m2/day at Chuchchak was village to 16.33 mg/m2/day at SMA industrial state, clearly showing that the industrial state site has the highest amount of dry deposition of NO3- and NH4+ in dust fall flux while lowest at Chuchchak was village. These results indicate that as a significant contributor of different Nr species, the dust fall plays a crucial role in the dry deposition of these species.
The dry deposition velocities of NH4+ and NO3- on a natural surface (Cassia leaf) found to be 1.60 cm s-1and 1.09 cm s-1 respectively.116 These relatively high deposition velocities of NH4+ and NO3- clearly indicate that the dry deposition of nitrogenous particles is a significant mechanism to remove these species from the atmosphere. In India, the average total deposition of NH4-N and NO3-N through dust fall found to be 0.37 kg ha-1 and 0.84 kg ha-1respectively. Deposition of NH4-N and NO3-N in the form of aerosols found to be 0.28 and 1.65 kg ha-1 while through gaseous dry deposition it found to 4.72 kg ha-1and 0.28 kg ha-1for NH4-N and NO3-N respectively.117
According to the estimates given by Kulshrestha,117 India emits 6.24 TgN, as major Nr but the average total Nr deposition (NH4-N and NO3-N) is found to be 3.61 TgN/yr indicating a gap which is probably because all the nitrogenous species not included in the deposition calculation. The average total dry and wet deposition of (NH4-N and NO3-N) found to be 1.64 and 1.97 Tg N/yr respectively, indicating that both dry and wet deposition processes are of equal importance.
Long range Trans-boundary movement of pollutants
As with the different regions of the world, long-range transport and trans-boundary movement of air pollutants have threats to South Asian ecosystems too. As a function of seasons, air masses from different regions like the Middle East, the Indian Ocean, Africa, and Europe and so on, reach to south Asia. As revealed by trajectory analysis associated with wet deposition events, the air masses having their origin from the Middle East and Europe transfer the high amount of acidic pollutants in the Himalayan region.118 Similarly, long-distance transport of pollutants over Hude gadde in north Karnataka is an indicator of threat to the sensitive ecosystem of Western Ghats.119 Hence, the policy makers should focus on this issue of long-range transport and trans-boundary pollution coming from far Europe, the Middle East as well as from nearby countries.
Conclusion
1. Anthropogenic acceleration in the atmospheric nitrogen fixation is significantly perturbing the normal flow of the global nitrogen cycle at an unprecedented speed due to the increasing demand of fixed nitrogen in agriculture and industrial sectors, combustion of fossil fuel and cultivated biological nitrogen fixation.
2. India is the largest tropical country of the South Asian region consuming ~ 17 million tonnes N/yr which makes it a significant hot spot of the sources and transformations of Nr species. However, the region has high dust loading than temperate regions and heterogeneous chemistry of dust particles affecting the abundance of Nr species in the atmosphere. Moreover, there is a high rate of gas phase to particle phase conversion in tropical regions due to the presence of much solar radiation and ubiquitous water vapour content.
3. Most of the studies have been carried out on a short term basis, hence, there are several gaps and queries about budgets. Hence, the South Asian region needs very robust emission and deposition budgets for various reactive nitrogen species for which a systematic network required. Based on relatively long term monitoring, an integrated assessment can be attempted which can be the basis for the recommendations of new policies.
4. In this region, dry deposition is the key mechanism responsible for the removal of Nr species from the atmosphere. This is because the wet deposition in India prevails mostly during the monsoon period which extends July to September. During the rest eight months of the year, there is no or very little precipitation. The annual depositions of NO3-N found to be higher at the urban site while annual depositions of NH4-N found to be the higher at the industrial site out of for sites of different land use pattern.
5. Deposition of Nr species is also affected by the long-range transport and trans-boundary movement of pollutants. Increased deposition of Nr species has been reported at Himalayans due to air masses coming from western regions.
Acknowledgements
We sincerely thank the University Grants Commission, India for financial assistance to conduct this study. We also thank Prof Dr. Wim de Vries for his valuable suggestions and IPCC for providing copyright permission.
References
- Dansgaard, W., Johnsen, S. J., Clausen, H. B., Dahl-Jensen, D., Gundestrup, N. S., Hammer, C. U., ... & Bond, G. (1993). Evidence for general instability of past climate from a 250-kyr ice-core record. Nature, 364(6434): 218.
CrossRef - Rioual, P., Andrieu-Ponel, V., Rietti-Shati, M., Battarbee, R. W., de Beaulieu, J. L., Cheddadi, R., ... & Shemesh, A. (2001). High-resolution record of climate stability in France during the last interglacial period. Nature, 413(6853): 293.
CrossRef - Steffen, W., Sanderson, R. A., Tyson, P. D., Jäger, J., Matson, P. A., Moore III, B., ... & Wasson, R. J. (2006). Global change and the earth system: a planet under pressure. Springer Science & Business Media.
- Steffen, W., Crutzen, P. J., & McNeill, J. R. (2007). The Anthropocene: are humans now overwhelming the great forces of nature. AMBIO: A Journal of the Human Environment, 36(8): 614-621.
CrossRef - Crutzen, P. J. (2002). Geology of mankind. Nature, 415(6867): 23.
CrossRef - Gruber, N., & Galloway, J. N. (2008). An Earth-system perspective of the global nitrogen cycle. Nature, 451(7176): 293.
CrossRef - Mackenzie, F. T., Ver, L. M., & Lerman, A. (2002). Century-scale nitrogen and phosphorus controls of the carbon cycle. Chemical Geology, 190(1-4): 13-32.
CrossRef - Canfield, D. E., Glazer, A. N., & Falkowski, P. G. (2010). The evolution and future of Earth’s nitrogen cycle. science, 330(6001): 192-196.
- Galloway, J. N., Townsend, A. R., Erisman, J. W., Bekunda, M., Cai, Z., Freney, J. R., ... & Sutton, M. A. (2008). Transformation of the nitrogen cycle: recent trends, questions, and potential solutions. Science, 320(5878): 889-892.
CrossRef - Lutgens, F. K., and Tarbuck, E. J, (2001). The atmosphere: an introduction to meteorology (pp.88-98). New Jersey: Prentice Hall.
- Elser, J. J., Bracken, M. E., Cleland, E. E., Gruner, D. S., Harpole, W. S., Hillebrand, H., ... & Smith, J. E. (2007). Global analysis of nitrogen and phosphorus limitation of primary producers in freshwater, marine and terrestrial ecosystems. Ecology Letters, 10(12): 1135-1142.
CrossRef - Vitousek, P. M., Aber, J. D., Howarth, R. W., Likens, G. E., Matson, P. A., Schindler, D. W., ... & Tilman, D. G. (1997). Human alteration of the global nitrogen cycle: sources and consequences. Ecological Applications, 7(3): 737-750.
CrossRef - Carpenter, S. R., &Kinne, O. (2003). Regime shifts in lake ecosystems: pattern and variation (Vol. 15). Oldendorf/Luhe: International Ecology Institute.
- Duce, R. A., LaRoche, J., Altieri, K., Arrigo, K. R., Baker, A. R., Capone, D. G., ... &Geider, R. J. (2008). Impacts of atmospheric anthropogenic nitrogen on the open ocean. science, 320(5878): 893-897.
- Gruber, N., & Sarmiento, J. L. (1997). Global patterns of marine nitrogen fixation and denitrification. Global Biogeochemical Cycles, 11(2): 235-266.
CrossRef - Canfield, D. E., Glazer, A. N., &Falkowski, P. G. (2010). The evolution and future of Earth’s nitrogen cycle. science, 330(6001): 192-196
CrossRef - Galloway, J. N., Dentener, F. J., Capone, D. G., Boyer, E. W., Howarth, R. W., Seitzinger, S. P., ... & Karl, D. M. (2004). Nitrogen cycles: past, present, and future. Biogeochemistry, 70(2): 153-226.
CrossRef - Voss, M., Bange, H. W., Dippner, J. W., Middelburg, J. J., Montoya, J. P., & Ward, B. (2013). The marine nitrogen cycle: recent discoveries, uncertainties and the potential relevance of climate change. Philosophical Transactions of the Royal Society B: Biological Sciences, 368(1621).
CrossRef - Vitousek, P. M., Cassman, K. E. N., Cleveland, C., Crews, T., Field, C. B., Grimm, N. B., ... & Sprent, J. I. (2002). Towards an ecological understanding of biological nitrogen fixation. In The Nitrogen Cycle at Regional to Global Scales (pp. 1-45). Springer, Dordrecht.
CrossRef - Vitousek, P. M., Menge, D. N., Reed, S. C., & Cleveland, C. C. (2013). Biological nitrogen fixation: rates, patterns and ecological controls in terrestrial ecosystems. Philosophical Transactions of the Royal Society B: Biological Sciences, 368(1621).
CrossRef - Gu, B., Chang, J., Min, Y., Ge, Y., Zhu, Q., Galloway, J. N., & Peng, C. (2013). The role of industrial nitrogen in the global nitrogen biogeochemical cycle. Scientific Reports, 3, 2579.
CrossRef - Tie, X., Zhang, R., Brasseur, G., & Lei, W. (2002). Global NO x production by lightning. Journal of Atmospheric Chemistry, 43(1), 61-74.
CrossRef - Levy, H. I. R. A. M., Moxim, W. J., Kasibhatla, P. S., & Logan, J. A. (1991). The global impact of biomass burning on tropospheric reactive nitrogen. In Global biomass burning. Atmospheric, climatic, and biospheric implications.
- Fowler, D., Coyle, M., Skiba, U., Sutton, M. A., Cape, J. N., Reis, S., ... &Vitousek, P. (2013). The global nitrogen cycle in the twenty-first century. Philosophical Transactions of the Royal Society B: Biological Sciences, 368(1621).
- Herridge, D. F., Peoples, M. B., & Boddey, R. M. (2008). Global inputs of biological nitrogen fixation in agricultural systems. Plant and soil, 311(1-2): 1-18.
CrossRef - Batty W., Aneja V. P.,& Schlesinger W. H (2017). Is nitrogen the next carbon? Earth's future, 5(9): 894-904.
CrossRef - Wayne, R. P. (1991). The Chemistry of the Atmosphere, 2nd edn. Clarendon.
- van Vuuren, D. P., Bouwman, L. F., Smith, S. J., & Dentener, F. (2011). Global projections for anthropogenic reactive nitrogen emissions to the atmosphere: an assessment of scenarios in the scientific literature. Current Opinion in Environmental Sustainability, 3(5): 359-369.
CrossRef - Holloway, J. M., & Dahlgren, R. A. (2002). Nitrogen in rock: occurrences and biogeochemical implications. Global Biogeochemical Cycles, 16(4).
CrossRef - Walvoord, M. A., Phillips, F. M., Stonestrom, D. A., Evans, R. D., Hartsough, P. C., Newman, B. D., &Striegl, R. G. (2003). A reservoir of nitrate beneath desert soils. Science, 302(5647): 1021-1024.
CrossRef - Morford, S. L., Houlton, B. Z., & Dahlgren, R. A. (2011). Increased forest ecosystem carbon and nitrogen storage from nitrogen-rich bedrock. Nature, 477(7362): 78.
CrossRef - Galloway, J. N., Aber, J. D., Erisman, J. W., Seitzinger, S. P., Howarth, R. W., Cowling, E. B., & Cosby, B. J. (2003). The nitrogen cascade. AIBS Bulletin, 53(4): 341-356.
- Siegenthaler, U., Stocker, T. F., Monnin, E., Lüthi, D., Schwander, J., Stauffer, B., ... &Jouzel, J. (2005). Stable carbon cycle-climate relationship during the late Pleistocene. Science, 310(5752): 1313-1317.
CrossRef - Stocker, T. (Ed.). (2014). Climate change 2013: the physical science basis: Working Group I contribution to the Fifth assessment report of the Intergovernmental Panel on Climate Change. Cambridge University Press.
- Eichner, M. J. (1990). Nitrous oxide emissions from fertilized soils: summary of available data. Journal of environmental quality, 19(2): 272-280.
CrossRef - Albritton, D. L., Derwent, R. G., Isaksen, I. S. A., Lal, M., &Wuebbles, D. J. (1994). Trace gas radiative forcing indices. Climate change, 994: 163-203.
- US-EPA (U.S. Environmental Protection Agency) (2011) Inventory of U.S. greenhouse gas emissions and sinks: 1990–2009. Report EPA 430-R-11-005. Washington, DC, USA.
- Ciais, P., Sabine, C., Bala, G., Bopp, L., Brovkin, V., Canadell, J., ... & Jones, C. (2014). Carbon and other biogeochemical cycles. In Climate change 2013: the physical science basis. The contribution of Working Group I to the Fifth Assessment Report of the Intergovernmental Panel on Climate Change (pp. 465-570). Cambridge University Press.
- https://www.pmel.noaa.gov/cfc/nitrous-oxide)14/8/17.
- Dalal, R. C., Wang, W., Robertson, G. P., & Parton, W. J. (2003). Nitrous oxide emission from Australian agricultural lands and mitigation options: a review. Soil Research, 41(2): 165-195.
CrossRef - Reich, P. B., & Amundson, R. G. (1985). Ambient levels of ozone reduce net photosynthesis in tree and crop species. Science (Washington), 230(4725): 566-570.
CrossRef - Chameides, W. L., Kasibhatla, P. S., Yienger, J., & H Levy, I. I. (1994). The growth of continental-scale metro-agro-plexes, regional ozone pollution, and world food production. Science, 264(5155): 74-78.
CrossRef - Jacob, D. J., & Wofsy, S. C. (1990). Budgets of reactive nitrogen, hydrocarbons, and ozone over the Amazon forest during the wet season. Journal of Geophysical Research: Atmospheres, 95(D10): 16737-16754.
CrossRef - Williams, E. J., Hutchinson, G. L., & Fehsenfeld, F. C. (1992). NOx and N2O emissions from soil. Global Biogeochemical Cycles, 6(4): 351-388.
CrossRef - Levy, H. I. R. A. M., Moxim, W. J., Kasibhatla, P. S., & Logan, J. A. (1991). The global impact of biomass burning on tropospheric reactive nitrogen. In Global biomass burning. Atmospheric, climatic, and biospheric implications.
- Crutzen, P. J. (1970). The influence of nitrogen oxides on the atmospheric ozone content. Quarterly Journal of the Royal Meteorological Society, 96(408): 320-325.
CrossRef - Johnston, H. (1971). Reduction of stratospheric ozone by nitrogen oxide Levy The Vienna Convention for the Protection of the Ozone Layer (1985).
- R. P. Wayne, Chemistry of Atmosphere (Oxford Univ. Press, Oxford, ed. 3, 2000), p. 775.
- The Vienna Convention for the Protection of the Ozone Layer, 1985.
- Fenn, L. B., & Hossner, L. R. (1985). Ammonia volatilization from ammonium or ammonium-forming nitrogen fertilizers. In Advances in Soil Science (pp. 123-169). Springer New York.
CrossRef - Denmead, O. T. (1990). An ammonia budget for Australia. Soil Research, 28(6): 887-900.
CrossRef - Schlesinger, W. H., & Hartley, A. E. (1992). A global budget for atmospheric NH 3. Biogeochemistry, 15(3): 191-211.
CrossRef - Galloway, J. N., Likens, G. E., Keene, W. C., & Miller, J. M. (1982). The composition of precipitation in remote areas of the world. Journal of Geophysical Research: Oceans, 87(C11): 8771-8786.
CrossRef - Howard, J. B., & Rees, D. C. (2006). How many metals does it take to fix N2? A mechanistic overview of biological nitrogen fixation. Proceedings of the National Academy of Sciences, 103(46): 17088-17093.
CrossRef - Likens, G. E., Bormann, F. H., & Johnson, N. M. (1981). Interactions between major biogeochemical cycles in terrestrial ecosystems. Some perspectives of the major biogeochemical cycles, 93-112.
- Smil, V. (2004). Enriching the earth: Fritz Haber, Carl Bosch, and the transformation of world food production. MIT press.
- Townsend, A. R., Howarth, R. W., Bazzaz, F. A., Booth, M. S., Cleveland, C. C., Collinge, S. K., ... &Mallin, M. A. (2003). Human health effects of a changing global nitrogen cycle. Frontiers in Ecology and the Environment, 1(5): 240-246.
CrossRef - Volk, M., Bungener, P., Contat, F., Montani, M., & Fuhrer, J. (2006). Grassland yield declined by a quarter in 5 years of freeâ€air ozone fumigation. Global Change Biology, 12(1): 74-83.
CrossRef - Agrawal, G. D., Lunkad, S. K., &Malkhed, T. (1999). Diffuse agricultural nitrate pollution of groundwaters in India. Water science and technology, 39(3): 67-75.
CrossRef - Oenema, O., Boers, P. C. M., Van Eerdt, M. M., Fraters, B., Van der Meer, H. G., Roest, C. W. J., ... & Willems, W. J. (1998). Leaching of nitrate from agriculture to groundwater: the effect of policies and measures in the Netherlands. Environmental Pollution, 102(1): 471-478.
CrossRef - Gupta, S. K., Gupta, R. C., Seth, A. K., Gupta, A. B., Bassin, J. K., & GUPTA, A. (2000). Methaemoglobinaemia in areas with high nitrate concentration in drinking water. National Medical Journal of India, 13(2): 58-60.
- Kramer, M. H., Herwaldt, B. L., Craun, G. F., Calderon, R. L., &Juranek, D. D. (1996). Surveillance for waterborne-disease outbreaks-United States, 1993-1994.
- Chameides, W. L., Kasibhatla, P. S., Yienger, J., & H Levy, I. I. (1994). The growth of continental-scale metro-agro-plexes, regional ozone pollution, and world food production. Science, 264(5155): 74-78.
CrossRef - von Mutius, E., Pearce, N., Beasley, R., Cheng, S., von Ehrenstein, O., Björkstén, B., & Weiland, S. (2000). International patterns of tuberculosis and the prevalence of symptoms of asthma, rhinitis, and eczema. Thorax, 55(6): 449-453.
CrossRef - Wolfe, A. H., & Patz, J. A. (2002). Reactive nitrogen and human health: acute and long-term implications. Ambio: A Journal of the human environment, 31(2): 120-125.
CrossRef - Pope III, C. A., Burnett, R. T., Thun, M. J., Calle, E. E., Krewski, D., Ito, K., & Thurston, G. D. (2002). Lung cancer, cardiopulmonary mortality, and long-term exposure to fine particulate air pollution. Jama, 287(9): 1132-1141.
CrossRef - Falkowski, P. G., Fenchel, T., & Delong, E. F. (2008). The microbial engines that drive Earth's biogeochemical cycles. science, 320(5879): 1034-1039.
- World health organization (WHO). 2001. World health report. Geneva, Switzerland:WHO
- Rejmankova, E., Savage, H. M., Rejmanek, M., Arredondo-Jimenez, J. I., & Roberts, D. R. (1991). Multivariate analysis of relationships between habitats, environmental factors and occurrence of anopheline mosquito larvae Anopheles albimanus and A. pseudopunctipennis in southern Chiapas, Mexico. Journal of Applied Ecology, 827-841.
CrossRef - Teng, H. J., Wu, Y. L., Wang, S. J., & Lin, C. (1998). Effects of environmental factors on the abundance of Anopheles minimus (Diptera: Culicidae) larvae and their seasonal fluctuation in Taiwan. Environmental Entomology, 27(2): 324-328.
CrossRef - Gimnig, J. E., Ombok, M., Kamau, L., & Hawley, W. A. (2001). Characteristics of larval anopheline (Diptera: Culicidae) habitats in Western Kenya. Journal of Medical Entomology, 38(2): 282-288.
CrossRef - National research council (NRC). 2000. Clean coastal waters. Washington, DC: National Academy of science.
- Burkholder, J. M. (1998). Implications of harmful microalgae and heterotrophic dinoflagellates in the management of sustainable marine fisheries. Ecological Applications, 8(sp1).
CrossRef - Cottingham, K. L., Chiavelli, D. A., & Taylor, R. K. (2003). Environmental microbe and human pathogen: the ecology and microbiology of Vibrio cholerae. Frontiers in Ecology and the Environment, 1(2): 80-86.
CrossRef - Colwell, R., & Huq, A. (2001). Marine ecosystems and cholera. In The Ecology and Etiology of Newly Emerging Marine Diseases (pp. 141-145). Springer Netherlands.
CrossRef - Bobbink, R., Hicks, K., Galloway, J., Spranger, T., Alkemade, R., Ashmore, M., ... & Emmett, B. (2010). Global assessment of nitrogen deposition effects on terrestrial plant diversity: a synthesis. Ecological Applications, 20(1): 30-59.
CrossRef - Camargo, J. A., & Alonso, Á. (2006). Ecological and toxicological effects of inorganic nitrogen pollution in aquatic ecosystems: a global assessment. Environment international, 32(6): 831-849.
CrossRef - Diaz, R. J., & Rosenberg, R. (2008). Spreading dead zones and consequences for marine ecosystems. science, 321(5891): 926-929.
- Doney, S. C. (2010). The growing human footprint on coastal and open-ocean biogeochemistry. science, 328(5985): 1512-1516.
- Gilbert, D., Rabalais, N. N., Diaz, R. J., & Zhang, J. (2010). Evidence for greater oxygen decline rates in the coastal ocean than in the open ocean. Biogeosciences, 7(7): 2283-2296.
CrossRef - Oczkowski, A., & Nixon, S. (2008). Increasing nutrient concentrations and the rise and fall of a coastal fishery; a review of data from the Nile Delta, Egypt. Estuarine, Coastal and Shelf Science, 77(3): 309-319.
CrossRef - Camargo, J. A., & Alonso, Á. (2006). Ecological and toxicological effects of inorganic nitrogen pollution in aquatic ecosystems: a global assessment. Environment international, 32(6): 831-849.
CrossRef - Rabalais, N. N., Turner, R. E., & Scavia, D. (2002). Beyond Science into Policy: Gulf of Mexico Hypoxia and the Mississippi River: Nutrient policy development for the Mississippi River watershed reflects the accumulated scientific evidence that the increase in nitrogen loading is the primary factor in the worsening of hypoxia in the northern Gulf of Mexico. AIBS Bulletin, 52(2): 129-142.
- Sinha, E., Michalak, A. M., & Balaji, V. (2017). Eutrophication will increase during the 21st century as a result of precipitation changes. Science, 357(6349): 405-408.
CrossRef - Grizzetti, B., Bouraoui, F., Billen, G., van Grinsven, H., Cardoso, A. C., Thieu, V., ... &Johnes, P. (2011). Nitrogen as a threat to European water quality.
- Van Herk, C. M., Mathijssen-Spiekman, E. A. M., & De Zwart, D. (2003). Long distance nitrogen air pollution effects on lichens in Europe. The Lichenologist, 35(4): 347-359.
CrossRef - Vitousek, P. M., & Howarth, R. W. (1991). Nitrogen limitation on land and in the sea: how can it occur?. Biogeochemistry, 13(2): 87-115.
CrossRef - Bobbink, R., Hornung, M., &Roelofs, J. G. (1998). The effects of airâ€borne nitrogen pollutants on species diversity in natural and semiâ€natural European vegetation. Journal of Ecology, 86(5): 717-738.
CrossRef - Treseder, K. K. (2004). A metaâ€analysis of mycorrhizal responses to nitrogen, phosphorus, and atmospheric CO2 in field studies. New Phytologist, 164(2): 347-355.
CrossRef - Payne, R. J., Thompson, A. M., Standen, V., Field, C. D., & Caporn, S. J. (2012). Impact of simulated nitrogen pollution on heathland microfauna, mesofauna and plants. European Journal of Soil Biology, 49: 73-79.
CrossRef - Bardgett, R. (2005). The biology of soil: a community and ecosystem approach. Oxford University Press.
CrossRef - Velthof, G., Barot, S., Bloem, J., Butterbach-Bahl, K., de Vries, W., Kros, J., ... &Oenema, O. (2011). Nitrogen as a threat to European soil quality. In European Nitrogen Assessment (pp. 495-512). Cambridge University Press.
CrossRef - Toet, S., Ineson, P., Peacock, S., & Ashmore, M. (2011). Elevated ozone reduces methane emissions from peatland mesocosms. Global Change Biology, 17(1): 288-296.
CrossRef - Adhya, T. K., Pathak, H., Raghuram, N., &Abrol, Y. P. (2016). Reactive nitrogen assessment in South Asia.
- Naqvi, S. W. A., Lam, P., Narvenkar, G., Sarkar, A., Naik, H., Pratihary, A., ... &Duret, M. (2018). Methane stimulates massive nitrogen loss from freshwater reservoirs in India. Nature communications, 9(1): 1265.
CrossRef - Kulshrestha, U. C., & Sharma, D. (2015). Importance of atmospheric dust in India: future scope of research. Journal of Indian Geophysical Union, 19(2): 205-209.
- Singh, S., Sharma, A., Kumar, B., & Kulshrestha, U. C. (2017). Wet deposition fluxes of atmospheric inorganic reactive nitrogen at an urban and rural site in the Indo-Gangetic Plain. Atmospheric Pollution Research, 8(4): 669-677.
CrossRef - Muhs, D. R., Bush, C. A., Stewart, K. C., Rowland, T. R., & Crittenden, R. C. (1990). Geochemical evidence of Saharan dust parent material for soils developed on Quaternary limestones of the Caribbean and western Atlantic islands. Quaternary Research, 33(2): 157-177.
CrossRef - Tiwari, R., Kulshrestha, U. C., 2016 Reactive nitrogen species in the atmospheric dust over the megacity of Delhi (India). In: Proceedings the National Conference On Environmental Pollutants: Impact Assessment and Remediation “(NCEPIAR-2016), held at Jawaharlal Nehru University, New Delhi on 18-19 March 2016.
- Kylander, M. E., Martínez-Cortizas, A., Bindler, R., Kaal, J., Sjöström, J. K., Hansson, S. V., ... &Mörth, C. M. (2018). Mineral dust as a driver of carbon accumulation in northern latitudes. Scientific reports, 8(1): 6876.
CrossRef - Dentener, F. J., Carmichael, G. R., Zhang, Y., Lelieveld, J., &Crutzen, P. J. (1996). Role of mineral aerosol as a reactive surface in the global troposphere. Journal of Geophysical Research: Atmospheres, 101(D17): 22869-22889.
CrossRef - Calvert, J. G., Lazrus, A., Kok, G. L., Heikes, B. G., Walega, J. G., Lind, J., & Cantrell, C. A. (1985). Chemical mechanisms of acid generation in the troposphere. Nature, 317(6032): 27.
CrossRef - Wu, P. M., & Okada, K. (1994). Nature of coarse nitrate particles in the atmosphere—a single particle approach. Atmospheric Environment, 28(12): 2053-2060.
CrossRef - Pakkanen, T. A. (1996). Study of formation of coarse particle nitrate aerosol. Atmospheric Environment, 30(14): 2475-2482.
CrossRef - Hanke, M., Umann, B., Uecker, J., Arnold, F., &Bunz, H. (2003). Atmospheric measurements of gas-phase HNO 3 and SO 2 using chemical ionization mass spectrometry during the MINATROC field campaign 2000 on Monte Cimone. Atmospheric Chemistry and Physics, 3(2): 417-436.
CrossRef - Fertilizer Statistic, 2015. Fertilizer association of India, New Delhi.
- Vet, R., Artz, R. S., Carou, S., Shaw, M., Ro, C. U., Aas, W., ... & Hou, A. (2014). A global assessment of precipitation chemistry and deposition of sulfur, nitrogen, sea salt, base cations, organic acids, acidity and pH, and phosphorus. Atmospheric Environment, 93: 3-100.
CrossRef - Singh, S., & Kulshrestha, U. C. (2012). Abundance and distribution of gaseous ammonia and particulate ammonium at Delhi, India. Biogeosciences, 9(12): 5023.
CrossRef - Kulshrestha, U. C., Kulshrestha, M. J., Sekar, R., Sastry, G. S. R., &Vairamani, M. (2003). Chemical characteristics of rainwater at an urban site of south-central India. Atmospheric Environment, 37(21): 3019-3026.
CrossRef - Kulshrestha, U. C.Mutius,, Reddy, L. A. K., Satyanarayana, J., & Kulshrestha, M. J. (2009). Real-time wet scavenging of major chemical constituents of aerosols and the role of rain intensity in the Indian region. Atmospheric Environment, 43(32): 5123-5127.uu
CrossRef - Kulshrestha, U. C., Granat, L., Engardt, M., & Rodhe, H. (2005). Review of precipitation monitoring studies in India—a search for regional patterns. Atmospheric Environment, 39(38): 7403-7419.
CrossRef - Dentener, F., Drevet, J., Lamarque, J. F., Bey, I., Eickhout, B., Fiore, A. M., ... & Lawrence, M. (2006). Nitrogen and sulfur deposition on regional and global scales: A multimodel evaluation. Global biogeochemical cycles, 20(4).
CrossRef - Singh, S., Gupta, G. P., Kumar, B., & Kulshrestha, U. C. (2014). Comparative study of indoor air pollution using traditional and improved cooking stoves in rural households of Northern India. Energy for sustainable development, 19: 1-6.
- Voldner, E. C., Barrie, L. A., & Sirois, A. (1986). A literature review of dry deposition of oxides of sulphur and nitrogen with emphasis on long-range transport modelling in North America. Atmospheric Environment (1967); 20(11): 2101-2123.
- Tiwari, R., Gupta, G. P., & Kulshrestha, U. C. (2016). Summer Time Dust fall Fluxes of Reactive Nitrogen and Other Inorganic Species over the Tropical Megacity of Indo-Gangetic Plains. Earth Interactions, 20(23): 1-20.
CrossRef - Kumar, R., Rani, A., Kumari, K. M., & Srivastava, S. S. (2003). Direct measurement of atmospheric dry deposition to natural surfaces in a semiarid region of north-central India. Journal of Geophysical Research: Atmospheres, 108(D20).
CrossRef - Kulshrestha U. (2017). Assessment of Atmospheric Emission and Deposition of Major Nr Species in Indian Region. InAbrol, Y. P., Adhya, T. K., Aneja, V. P., Raghuram, N., Pathak, H., Kulshrestha, U., ... & Singh, B. (Eds.). (2017). The Indian Nitrogen Assessment: Sources of Reactive Nitrogen, Environmental and Climate Effects, Management Options, and Policies. Elsevier.
CrossRef - Kulshrestha, U., & Kumar, B. (2014). Airmass trajectories and long-range transport of pollutants: a review of wet deposition scenario in South Asia. Advances in Meteorology, 2014.
CrossRef - Satyanarayana J. Reddy, L.A.K., Kulshrestha, M.J. Rao, R.N. and Kulshrestha, U.C. (2010). The chemical composition of rain water and influence of airmass trajectories at a rural site in an ecological sensitive area of Western Ghats (India). J. Atmos. Chem., 66: 101-116.
CrossRef


