Carbon Footprint of a Beverage Bottling Plant in Lahore, Pakistan
Sana Akhtar 1 * , Namra Ibrar Sahibzada 1 , Samia Saif 2 , Shamaila Inayat 1 and Sajid Rashid Ahmad 3
1
Department of Environmental Sciences,
Kinnaird College for Women,
Lahore,
54000
Pakistan
2
Environmental Consultancies and Options,
Cavalry Ground,
Lahore,
54000
Pakistan
3
College of Earth and Environmental Sciences,
Quaid-e-Azam Campus , University of the Punjab,
54900
Pakistan
DOI: http://dx.doi.org/10.12944/CWE.12.2.05
Climate change is amongst the priority and most challenging issues for developing economies like Pakistan. The current study focuses on estimating and calculating carbon footprint of a beverage bottling unit as well as monitoring of major greenhouse gases, unfolding the industrial unit’s contribution in greenhouse gas emissions as a preliminary part to combat the climate change. The methodological approach was based on GHG Protocol guidelines and IPCC guidelines. March 2015 to March 2016 was selected as the base year for calculations. The total carbon footprint of the industry came out to be 29880.26177 tCO2e. The highest emissions of CO2 were indirect sources as calculated per GHG Protocol and IPCC guidelines. This study will enable industries to calculate their own carbon foot print thus providing the government a course of action to combat climate change.
Copy the following to cite this article:
Akhtar S, Sahibzada N. I, Saif S, Inayat S, Ahmad S. R. Carbon Footprint of a Beverage Bottling Plant in Lahore, Pakistan. Curr World Environ 2017;12(2). DOI:http://dx.doi.org/10.12944/CWE.12.2.05
Copy the following to cite this URL:
Akhtar S, Sahibzada N. I, Saif S, Inayat S, Ahmad S. R. Carbon Footprint of a Beverage Bottling Plant in Lahore, Pakistan. Curr World Environ 2017;12(2). Available from: http://www.cwejournal.org/?p=17413
Download article (pdf) Citation Manager Publish History
Select type of program for download
| Endnote EndNote format (Mac & Win) | |
| Reference Manager Ris format (Win only) | |
| Procite Ris format (Win only) | |
| Medlars Format | |
| RefWorks Format RefWorks format (Mac & Win) | |
| BibTex Format BibTex format (Mac & Win) |
Article Publishing History
| Received: | 2017-06-24 |
|---|---|
| Accepted: | 2017-07-26 |
Introduction
The term carbon footprint was not familiar few years back but now it is being widely used by the government and business world. Carbon footprint is a term that can lead to reduced carbon emissions by altering the activities or processes or products to those which are environmental friendly in order to decrease the global climate change1.
Climate change has now become a major concern leading to serious issues such as increase in earth’s temperature, increased flood and drought risk, changes in sea level and increased risk of health impacts including skin diseases, vector borne diseases etc. The problem can be solved by controlling the activities resulting in greenhouse gas emissions2.
Greenhouse gases comprise of different gases among which the most important one is Carbon dioxide produced from different human activities 1.
Carbon Footprint
“A ‘carbon footprint’ is a measure of the greenhouse gas emissions associated with an activity, group of activities or a product”. According to Carbon Trust (2007) “Carbon footprint is a methodology to estimate the total emission of greenhouse gases (GHG) in carbon equivalents from a product across its life cycle from the production of raw material used in its manufacture, to disposal of the finished product (excluding in-use emissions)” 3. According to Grub & Ellis (2007), “A carbon footprint is a measure of the amount of carbon dioxide emitted through the combustion of fossil fuels. In the case of a business organization, it is the amount of CO2 emitted either directly or indirectly as a result of its everyday operations. It also might reflect the fossil energy represented in a product or commodity reaching market”3.
The best suited definition of Carbon footprint is given by Wright et al in 2011: “A measure of the total amount of carbon dioxide (CO2) and methane (CH4) emissions of a defined population, system or activity, considering all relevant sources, sinks and storage within the spatial and temporal boundary of the population, system or activity of interest. Calculated as carbon dioxide equivalents (CO2e) using the relevant 100 year global warming potential (GWP100)” 4.
Importance of calculating carbon footprint
The first step for abatement of GHG’s is to know how much a person or organization contributes in the emissions and global warming i.e. calculation of carbon footprint. Nations, industries, organizations, businesses and individuals can reduce their emissions once they know how much they are contributing in global warming. Carbon footprint calculations will not only increase savings but also reduce climate change impact. Carbon footprint calculation is a step towards making quantifiable emissions reductions 5. Carbon footprint studies have previously been conducted in Textile 4 and Paint 6 sector in Pakistan.
Carbon footprint aids in making climate change policies, determining the sectors or activities responsible for GHG emissions. Carbon footprint is getting more interest because of growing public awareness about global warming. Due to growing public awareness, the global community now recognizes the need to reduce GHG emissions 5. The foundation of Intergovernmental Panel on Climate Change (IPCC) led in 1988 on the need of minimizing activities contributing towards climate change 7. The establishment of United Nations Framework Convention on Climate Change (UNFCCC) was also based on the purpose of controlling GHG emissions. Kyoto Protocol is an international agreement that has introduced specific targets to be achieved by the countries for reduced carbon emissions 8.
Six greenhouse gases were identified in the Kyoto Protocol: Carbon dioxide, Methane, Nitrous oxide, Sulphur Hexafluoride, Perfluorocarbons and Hydrofluorocarbons. Among these carbon dioxide is the most important. The global warming potential (GWP) of each greenhouse gas can be expressed in carbon dioxide equivalents. Small emissions can have larger impact if the gas has high global warming potential 9.
On 11th January 2005, Pakistan became a party to the Kyoto Protocol and it came into force the same day 7. Pakistan has 135th position in contributing GHG emissions7. This worldwide position makes easier to understand Pakistan’s greenhouse emission contribution which is not a major contribution. Pakistan only contributes 0.8% of the total worldwide emissions10. The total GHG emissions by Pakistan were calculated to be three hundred and nine million tons of Carbon dioxide equivalents in 2008, consisting of about 54% Carbon dioxide, 36% Methane, 9% Nitrous Oxide and 1% of other gases 10.
Study Area
The study area is a Beverage Bottling Plant located 23 Km Raiwind Road Lahore that is selected for the estimation and calculation of the carbon footprint. It is well known for its carbonated drinks and juices. The beverage bottling plant uses glass bottles and PET bottles. Glass bottles from different sources are brought to the industry and are palletized in a store room. At the time of usage, the pallets containing bottles are de-palletized, de-cased mechanically, washed appropriately and inspected. Similarly, the pre-form of PET bottles made through resins are transferred to hopper by crane and are sent to dryer through suction. In the dryer, resins melt and move to a barrel where they are molded. Chilled water is used at the molding stage and bottles then move to Bromax where they are again molded depending on the required size and washed thoroughly. When the glass and PET bottles are ready they are filled with the syrup and are carbonated. The bottles are then sealed and moved for data coding with manufacturing and expiry dates.
The Plant is committed to environmental compliance and to work with quality. They have taken steps to improve its activities and processes to be environmental friendly. The Plant is ISO certified and has considered calculating its carbon footprint to know its contribution towards greenhouse gas emissions and to make efforts in offsetting these emissions.
Materials and Methods
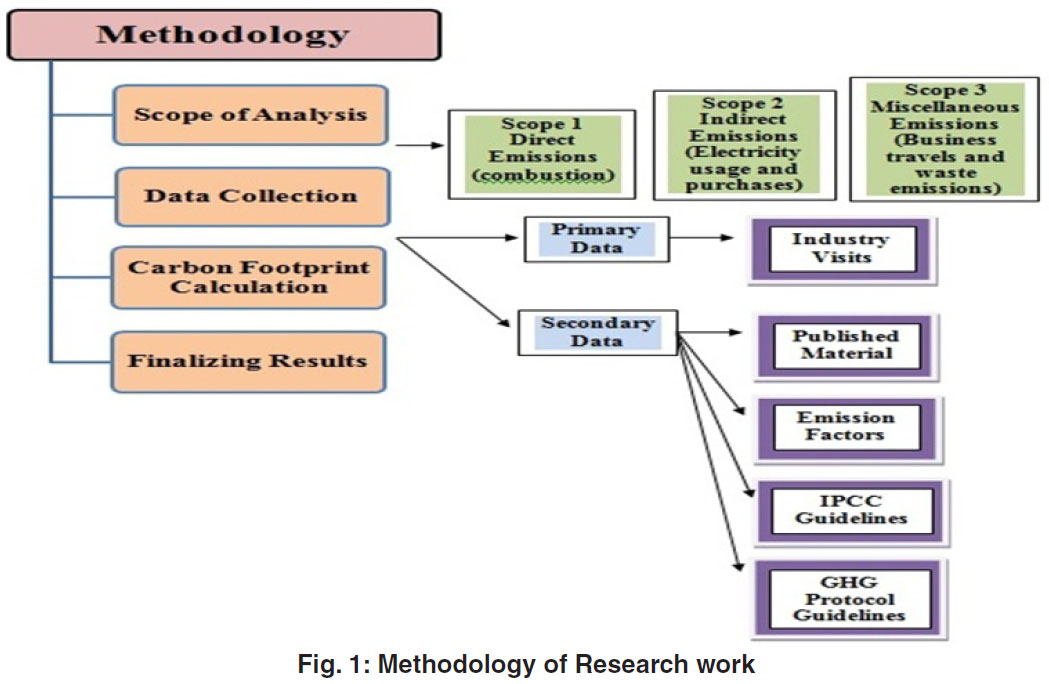
Carbon footprint methodologies range from simple online calculators to complex life-cycle analysis. BP calculators and BSkyB household calculators are automated web-based calculators that are made only to measure carbon dioxide emissions. GHG protocol and IPCC guidelines have been taken into account for this research 11. A layout of the complete methodology is given in Fig.1.
 |
|
Goal Identification
A beverage industrial unit has been chosen for this study, in order to monitor carbon emissions and to successfully achieve an accurate carbon footprint by the help of activity data collected through checklist.
Selection of a Base Year
The base year selected was March 2015-March 2016.
Scope of analysis
According to GHG Protocol 11 the boundaries of the study area were aligned with respect to these three scopes:
Scope 2: Indirect GHG emissions
Scope 3: Miscellaneous GHG emissions
Data Collection
Primary and secondary data was collected according to the work plan that includes checklist preparation, industrial visits and secondary sources i.e. GHG Protocol guidelines and IPCC guidelines respectively. Data calculation is based on the emissions from industry. CO2, N2O and CH4 have been taken into account whereas other gases are in exclusion from calculations because the industry is having no such emissions.
Carbon Footprint Calculation
For accurate calculation of carbon footprint, the data gathered in the earlier steps was used. Carbon footprint’s results are expressed in terms of carbon dioxide equivalents CO2e for which it was necessary to convert GHGs into CO2e figure 12.
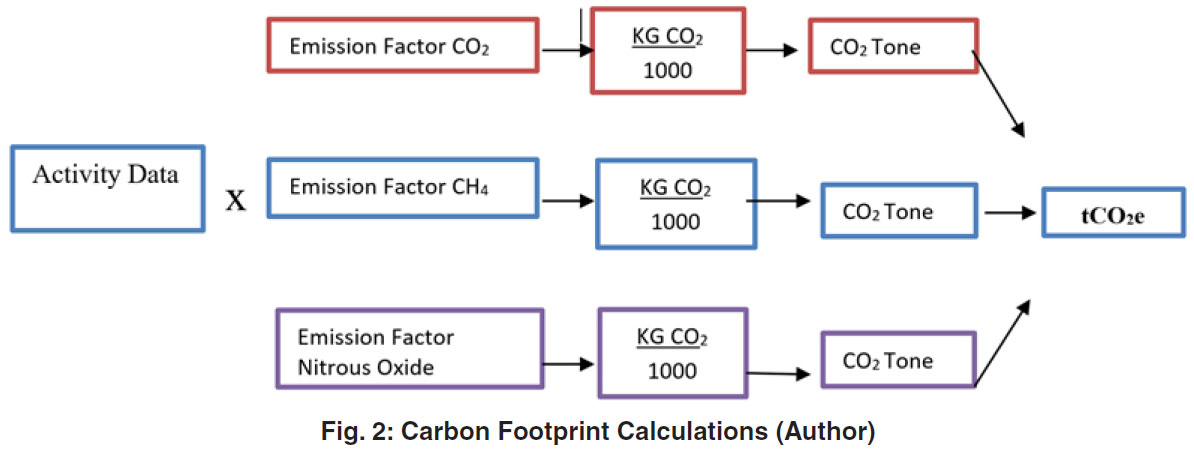
IPCC guidelines were consulted for a formula to calculate the carbon footprint. These guidelines provide a common approach for calculating carbon footprints as shown in Fig.2
 |
|
For the calculation of carbon footprint, the method adopted was 4:
Multiplication of emission factor with the activity data, the data was converted into greenhouse gas emission.In order to get calculations in the form of CO2e emissions, the individual figures of GHG emissions were multiplied by the relevant global warming potential (GWP) factor.
Results and Discussion
Scope 1 Emissions
According to GHG Protocol, emissions that occur directly from industry from sources which are owned or controlled by the industry that include combustion in the Industry owned or controlled vehicles, furnaces, generators, boilers etc. The direct emissions were classified into stationary and mobile combustion sources.
Generators and boilers are the stationary sources that were used for electricity production. The industry owns 9 generators and 2 boilers to fulfill facility’s energy requirements. Diesel is the only fuel being used by the industry for the stationary sources of combustion for an amount of 3250709 liters which forms the activity data. The fuel amount used in generators and boilers is not much as the industry mainly uses direct electricity from WAPDA. The emission factor for diesel is however low as compared to emission factors of other fuels thus it is an environmentally favorable fuel.
The emissions resulting from mobile combustion sources also lie under this scope and these are emitted by the industry owned vehicles. According to the data provided, the industry owns 155 trucks and 34 fork lifters. The trucks are used for transportation of products within and outside the city. Fork lifters are used within the industry boundary to carry wooden crates, plastic crates and other materials like plastic wrappings.
Table 1 shows two types of fuels being consumed by the vehicles and their quantity. The fuels used are diesel and LPG. Diesel is being used in the trucks while Fork lifters are low weight vehicles and LPG is being used in them. The amount of diesel used from March 2015 to March 2016 is 339,995 liters and that of LPG is 778358.9073 liters. Diesel consumption in trucks varies over the months owing to the usage of trucks. The quantity of diesel being consumed represents the growth and demand of industry through transportation activities.
Table 1 represent the estimation a total of scope 1, scope 2 and scope 3 emissions i.e. from stationary and mobile sources of combustion along with the emission factors for CO2, CH4 and N2O.The emission factors for stationary and mobile sources were taken in liquids as the activity data was in liters. Adding up the tonnes of CO2 for both stationary and mobile sources gave tCO2e to be 11093.56842.
Scope 2 Emissions
Scope 2 is the indirect emissions which result from electricity and natural gas. The facility purchases electricity from Water and Power Development Authority (WAPDA). From March 2015 to March 2016 the purchased electricity by the industry is 38,148,719 KW/h and the natural gas consumption is 9111.31829 MMBTU. The electricity consumption within the facility is higher as compared to natural gas as the facility has 7 lines for beverage production and all of them require great amount of energy consumption whereas natural gas is only utilized in the canteen areas. Electricity is used for the beverage production and bottling units as well as other activities involving heating, cooling during the bottling and production processes. Emissions resulting from scope 2 are represented in Table 1. The emission factors for these were taken from 2015 Default Factors. The electricity emissions in tCO2e were calculated to be 15908.01582 and tCO2e for natural gas was 483.4465485. Total scope 2 emissions were 16391.46237 tCO2e.
 |
|
Scope 3 Emissions
These emissions result from upstream and downstream activities. This is an optional reporting category which shows rest of the indirect emissions i.e. emissions from waste disposal or business travels.
The facility’s waste includes wood and sludge as shown in Table 1. From March 2015 to March 2016, 1345.68 tons of wood waste was produced by the facility and it was multiplied with the emission factor for wood to calculate the emissions resulting from wood waste. After multiplication the same formula was applied for Kg to Tonne conversion. The wood emissions came out to be 2357.553849 tCO2.
The industry owns a waste water treatment plant through which sludge generates. Most of the water in industry is used for the beverage production therefore less water is sent to the treatment plant and less sludge is generated. The amount of sludge generated from March 2015 to March 2016 was 7.93 tons and as the sludge generation is low therefore the biogas release is also minor. The only source of biogas in the facility is the waste water treatment plant that was revealed by the data collected through checklist.
The CO2 emissions for air travel scope is optional to report and is calculated by considering various factors including number of return flights, number of passengers, origin and destination. The emissions for each relevant flight from 2015-2016 were calculated by the help of online carbon emission calculator. Carbon emissions in Kg CO2 were obtained by the online calculator which is based on the UK DEFRA specifications for domestic, short haul and long haul international flights 4,13.
Emission values in Kg CO2e for one return flight were obtained by using the online carbon emission calculator 13. These emissions were then multiplied with the total number of return flights concerning the origin and destination. The emission values of one return flight multiplied with total number of flights to a country gave total carbon emission values for that country. Same procedure was done for flights to all other countries and CO2 Kg values were obtained. The obtained emissions were then divided by 1000 for conversion to tCO2e. The total emissions from air travel came out to be 15.853 tCO2e. Table 1 shows the carbon emissions from business travels.
Total Carbon Footprint Calculations
Table 1 represents the total carbon dioxide emissions resulting from all the scopes including scope 1, scope 2 and scope 3. The total carbon footprint of each scope is added to give the carbon footprint of the facility. Major emissions result from scope 2 i.e. from electricity as the facility’s whole production is dependent on the electricity therefore this scope is responsible for most of the carbon emissions that is from the indirect source. The yearly beverage production of the facility is 100,000,000 million liters and the yearly total carbon footprint of the facility was calculated to be 29880.26177 tCO2e. Total carbon emissions by source are mentioned in the Table 1 which also shows electricity is the major source contributing in greenhouse gases followed by diesel, wood waste, LPG, natural gas and waste water treated sludge.
 |
|
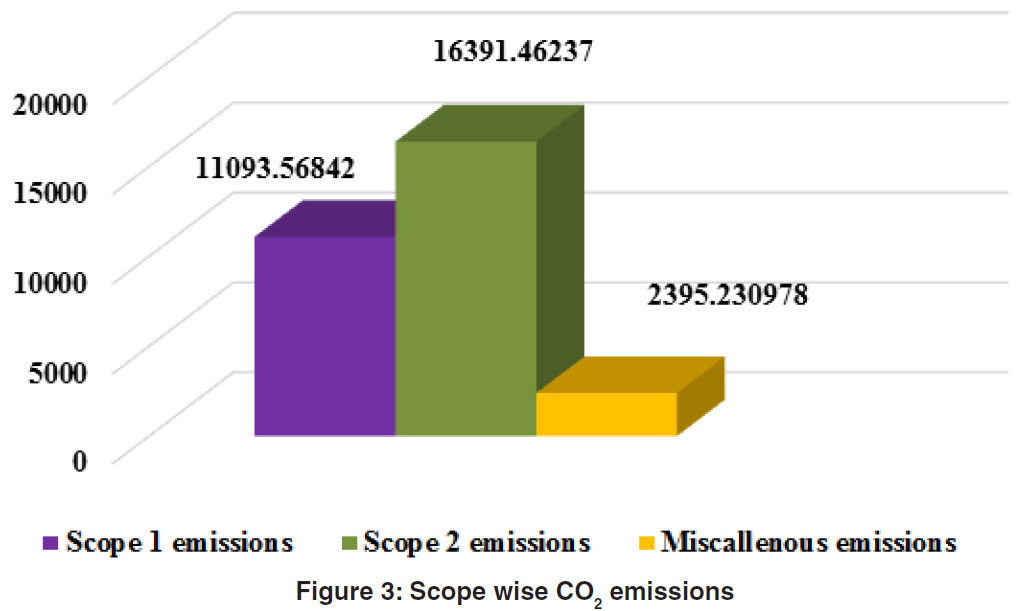
The yearly carbon footprint of the selected beverage industry was estimated to be 29880.26177 tCO2e. Scope 2 emissions are majorly responsible in the large carbon footprint with contribution of 16391.46237 tCO2e due to the dependence of industry majorly on electricity for beverage bottling process. Scope 1 emissions come next with a contribution of 11093.56842 tCO2e to the total carbon footprint. Miscellaneous emissions contribute 2395.230978 tCO2.
The respective beverage industrial unit can reduce its carbon footprint by making efforts in reducing its direct and indirect emission sources by switching towards environment friendly fuels and renewable energy resources and calculating carbon footprint every year and making efforts in reducing the footprint each year. In spite of less consumption of electricity or reduced use of fuels, switching to renewable resources with low emission factors is a wise option.
Recycled material usage can reduce the waste and lower environmental burden. The industrial unit can also re-design its PET bottles and glass bottles such that they become lighter in weight.
Acknowledgment
The authors would like to acknowledge the Department of Environmental Sciences and Environmental Consultancies and Options (ECO) for facilitating the study.
References
- Karjalainen, P. The carbon footprint of the Finnish beverage industry for years 2000-2012 as calculated with CCaLC, Master Thesis, University of Helsinki, (2013).
- Sayed, A.H. Climate change and its realities for Pakistan, in Changing environmental pattern and its impact with special focus on Pakistan, (2010).
- Wiedmann, T., and Minx J. A Definition of Carbon Footprint in C. C. Pertsova, Ecological Economics Research Trends (Nova Science Publishers, New York), 1-11 (2008).
- Akhtar, S,, Azhar, T., Mehmood., A, Samia S., and Hamid A. Status of carbon footprint of a textile industry, N.a and Environ. Sci, 127: 302-308 (2013).
- Bhatia P, Methodologies for measuring the Carbon Footprint (BT Centre Auditorium, London) 17-18 June 2008.
- Saif, S., Feroz, A., Khan, A.M., Akhtar, S., and Mehmood, A., Calculation and estimation of the carbon footprint of paint industry, Environ. &Poll. Tech, 14:633-638 (2015).
- Inter Academy Council, Climate change assessments, Review of the processes and procedures of the IPCC (FSC-certified paper, Netherlands) (2010).
- Ahmad, A., and Salman, A., Clean development mechanism (CDM) business in Pakistan: perceptions and realities (Pakistan Institute of Development Economics, Islamabad) (2012).
- Abbott, J. What is a Carbon Footprint? (The Edinburgh Centre for Carbon Management, UK) (2008).
- Shamsul, mulk, H.J., and Ishfaq, N.I., Final report of the task force on climate change. Planning commission government of Pakistan, (2010).
- “GHG Protocol”, [Internet] Retrieved on October 12, 2015. Available from www.ghgprotocol.org
- “IPCC”, [Internet] Retrieved on October 12, 2015. Available from www.ipcc.ch.
- “Flight emissions”, [Internet] Retrieved on January 12, 2016. Available from www.travelnav.com. /flight-emissions/


