Simultaneous Desalination of Sea Water and Electricity Production with New Membrane Technology, Air-Cathode Microbial Desalination Cells
Mahdi Asadi-Ghalhari1 * , Nasser Mehrdadi1 and Gholamreza Nabi-Bidhendi1
1
Department of Environmental Engineering,
Faculty of Environment,
University of Tehran,
Iran
DOI: http://dx.doi.org/10.12944/CWE.10.1.14
Copy the following to cite this article:
Asadi-Ghalhari M, Mehrdadi N, Nabi-Bidhendi G. Simultaneous Desalination of Sea Water and Electricity Production with New Membrane Technology, Air-Cathode Microbial Desalination Cells. Curr World Environ 2015;10(1) DOI:http://dx.doi.org/10.12944/CWE.10.1.14
Copy the following to cite this URL:
Asadi-Ghalhari M, Mehrdadi N, Nabi-Bidhendi G. Simultaneous Desalination of Sea Water and Electricity Production with New Membrane Technology, Air-Cathode Microbial Desalination Cells. Curr World Environ 2015;10(1). Available from: http://cwejournal.org?p=596/
Download article (pdf) Citation Manager Publish History
Select type of program for download
| Endnote EndNote format (Mac & Win) | |
| Reference Manager Ris format (Win only) | |
| Procite Ris format (Win only) | |
| Medlars Format | |
| RefWorks Format RefWorks format (Mac & Win) | |
| BibTex Format BibTex format (Mac & Win) |
Article Publishing History
| Received: | 2014-12-20 |
|---|---|
| Accepted: | 2015-01-09 |
In recent decades, water scarcity is a global problem. To protect fresh water resources and supplies, a great deal of work has been done by humans(Goh, Ismail et al. 2013). If the current population growth trends continue, many populations over the coming decades will face water shortages. Currently, about 1 billion people in the worldwide do not have adequate access to drinking water. Also, about a third of the world's population lives in areas where water supply in these areas is very difficult. By 2025 the population is forecast to increase by two-thirds(Elimelech and Phillip 2011). For this reason, the use of treated wastewater and sea water is an important goal in the management of water resources(Logan 2008; Wen, Zhang et al. 2012). Sea water, which makes up more than 97 percent of water resources, can be used as an important source of water in the ground (Kalogirou 2005; Zhao, van Soestbergen et al. 2012). This type of water should be treated. Reverse osmosis is One of the most important technologies for treating this water(Chun, Ha et al. 2012). In recent years, much progress has been made in this process(Blanco Gálvez, García-Rodríguez et al. 2009). This process consumes a lot of energy(Elimelech and Phillip 2011). The theoretical energy required for the desalination of sea water with 35 grams per liter of total dissolved solids and water recycling at least 50 percent is 1.06 kwh / m3(Werner, Logan et al. 2013). In practice, the amount of energy required for the desalination system, is equal to 1.8-2.2 kwh/m3. By adding the amount of energy required to pump water and pre-treatment, the amount of energy in the process of reverse osmosis is increased to 3kwh/m3. It seems that, Advances in reverse osmosis technology cannot reduce the amount of energy less than this value. So now a lot of research on the use of desalination with lower power consumption is considered(Wen, Zhang et al. 2012). The electrical power need for desalination can reduce by the microbial desalination cell (MDC)(Kim and Logan 2013). This process is a newly developed bio electrochemical technology that offers a sustainable approach for simultaneous water desalination, renewable energy production, and wastewater treatment(Luo, Xu et al. 2012). In the MDC, exoelectrogenic microorganisms produce electrical potential from the degradation of organic matter, which can then be used to desalinate water by driving ion transport through ion exchange membranes (IEMs)(Kim and Logan 2013). Degradation of organic matter by microorganisms Generate electrons. (Forrestal, Xu et al. 2012). These electrons transfer through an external circuit and reduce terminal electron acceptors(e.g., ferricyanide or oxygen) in the cathode chamber(Ping, Cohen et al. 2013). In conventional MDC, aeration is often used in the cathode chamber, but in the new MDC, Air-cathode MDC (ACMDC) is used to reduce the energy requirements. Then in this study we evaluated the performance of the ACMDC in the desalination of seawater.
Material and Methods MDC Reactor Construction
In order to build the main body of the pilot, sheets of Plexiglas(7×7 cm) were used in thicknesses 0.5-2 cm. Inside these sheets were created holes with a diameter of 5 cm and were clamped together. After inserting the electrodes and other equipment's, useful volume of wastewater, desalination and Catholyte chamber, were 40, 10 and 20 mL, respectively. Wastewater and middle chambers were separated using an AEM (AMI-7001, Membrane International, Inc. USA) and catholyte and middle chamber were separated using a CEM (Ultrex CMI7000, Membrane International). All chambers clamped together with gaskets. Carbon graphite flat was used as anode electrode (with dimension of 3×3×0.5 cm). This electrode was heat treated (450 oC, 30 min). To remove impurities, the electrode was put in the 1M HCl solution for 1 hour. The cathode (3cm in diameter) was carbon cloth (30% wet proofed, BASF, US) with four PTFE diffusion layers on the air side and 0.5 mg/cm2 of Pt on the water side. To connect the electrodes to the external circuit, Titanium wire was used(Qu, Feng et al. 2011).
Operating Conditions
Synthetic wastewater used for the anode chamber contained: sodium acetate (1.6 gL-1) in a nutrient buffer solution containing (per liter in deionized water): 4.4 g KH2PO4, 3.4 g K2HPO4.3H2O( for 50mM and 2.2 g KH2PO4, 1.7 g K2HPO4.3H2O for 25mM) , 1.5 g NH4Cl, 0.1 g MgCl2.6H2O, 0.1 g CaCl2.2H2O, 0.1 g yeast extract, and 10 mL of trace mineral metals solution which contains (per liter in deionized water): H3BO3 0.3 g, CoCl2.6H2O 0.2 g, ZnSO4.7H2O 0.1 g, MnCl2.4H2O 30 mg, NaMoO4.2H2O 30 mg, NiCl2.6H2O 20 mg, CuSO4.5H2O 10 mg(Wen, Zhang et al. 2012). The cathode chamber was fed with 25 and 50 mM KH2PO4/K2HPO4 buffer solution(PBS) and in the middle chamber (desalination chamber) solution of 35 gL-1 NaCl in deionized water was used.(Forrestal, Xu et al. 2012; Wen, Zhang et al. 2012) All three solutions were replaced when the voltage decreased to <80 mV, forming one complete cycle. At first, synthetic wastewater chamber was inoculated with return sludge of domestic wastewater treatment plant (20%, v/v) (Quan, Quan et al. 2012). The ACMDC was operated in fed-batch mode at ambient temperature (25±2o C). The analysis of chemical oxygen demand (COD) was done based on the open reflux method of APHA standard. The pH measurements were made using a pH meter(Sension 4, HACH Co., CO), (Yadav, Dash et al. 2012) . Conductivity was determined by a conductivity meter (Sension 156, HACH Co., CO). COD, Conductivity and pH measurements for all three chambers in MDC were taken at the beginning and the end of each batch cycle.
Analyses and Calculations
The power density (mW/m2) and current density (mA/m2) were calculated according to the below equations:

Where, A is the surface area of the projected cathode measured in m2, V voltage (mV) and R external resistor(Ω). The desalination rate (DR) based on the desalination chamber volume was calculated as below equation:

Where Ci and Ce are the influent and effluent EC (mS/cm) and T is the apparent hydraulic retention time (HRT) (h) of salt water in the desalination chamber.
Results
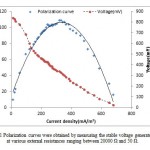
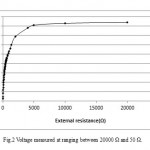
ACMDC reactor was first operated as MDC mode. Concurrent desalination and power generation was observed in ACMDC. Before the reactor was connected to external resistance, the anode and cathode chambers were allowed to reach the maximum open circuit potential (OCP). The OCP produced by ACMDC was about 900 mV. Base on the polarization data (Fig .1), the external resistance fixed at a 1000 Ω. With a data acquisition system (model 2700, Keithley Instruments, Inc. OH). To obtain a polarization curve, the external resistance was varied from 50 to 20000 Ω (Fig .2).
 |
Figure 1: Polarization curves were obtained by measuring |
 |
Figure 2: Voltage measured at ranging between20000 Ω and 50 Ω. Click here to View figure |
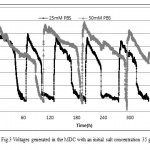
In the operation phase, the voltage across the external resistor was recorded every 1 min. During ACMDC operation, the maximum voltage produced with an initial salt concentration of 35 g/L and 1000 Ω external resistor was 607mV
(25mM PBS) and 701mV (50mM PBS) (Fig. 3). Under this fixed resistance condition, maximum power density output was 521mW/m2(25mM PBS) and 695mW/m2 (50mM PBS) respectively(based on the cross section area of 7 cm2 of cathode area). So, this translates to a maximum current density output of 858mA/m2 (25mM PBS) and 992mA/m2 (50mM PBS) respectively. At first of each cycle, the voltage immediately increased and then decreased slowly due to desalination in middle chamber. Then a gradual decline of the output voltage was observed at the end of each cycle, which was mainly attributed to the increase of the internal resistance.
 |
Figure 3: Voltages generated in the MDC with an initial salt concentration 35 g/L Click here to View figure |
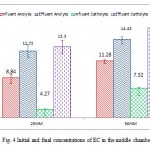
At the end of cycle, EC of salt water decreased from 56.33±0.19 to 29.12±1.77mS/cm (25mM PBS) and 56.34±0.21 to 30.03±1.63mS/cm (50 mM PBS) respectively. Then the change percent in the EC of salt water in 25 and 50mM PBS were 48.31±3% and 46.71±2.73% respectively. In addition to electricity production and wastewater treatment, the ACMDC removed more than 48% of the salt from the middle chamber during every batch cycle. The average desalination rate (DR) of the MDC was 0.400±0.047 and 0.27±0.026 mS/ (cm h) in 25 and 50mM PBS respectively. This results show that ACMDC can be used for pre-treatment of sea water for downstream RO processing with no need for external source of electrical. Then one of the most advantages of ACMDC is the reduction of energy needed for RO as result of decreasing of sea water salinity. As shown in fig 4, with decrease of salt from sea water in the middle chamber, EC in wastewater and catholyte slightly increased. Change percent of EC in wastewater was 44.20 ± 11.94(25mM PBS) and 27.94 ± 3 (50 mM PBS) and in catholyte was 211.66 ± 22.41(25mM PBS) and 119.24 ± 11.25 (50 mM PBS) respectively. Accumulation of protons and the migration of chloride ions in the sea water from the desalination chamber was the main reason of increase in wastewater conductivity. But increase in catholyte conductivity was due to the migration of sodium ions into the cathode chamber during the desalination. For example Cl- concentration in influent wastewater was 1668.00±6.16 (25mM PBS) and 1681.5±14.11mg/l (50mM PBS) that received to 4590.8±359.04 (25mM PBS) and 5397.75±29.74 (50mM PBS) at the end of cycle respectively.
 |
Figure 4: Initial and final concentrations of ECin the middle chamber Click here to View figure |
Discussion
Because a significant amount of ions that present in sea water, entered to the catolyte chamber due to osmotic pressure, the electrical conductivity of the wastewater and it amount had considerable influence on the desalination of sea water. Difference in concentration of solutions in wastewater and middle chambers due to osmotic pressure, led to pass of water in wastewater chamber in to the middle chamber and dilute it. This issue will increase the efficiency of sea water desalination. ACMDC achieve 40 to 60% salinity removal, if the amount of wastewater is 4 times sea water. In this study, the ratio was equal to 4(wastewater volume = 40ml and sea water volume=10ml). Osmotic water transport improves desalination performance of ACMDC, but the electric current generated by the exoelectrogenic bacteria is the most important driving force (81 to 98%)(Kim and Logan 2013). The rate of desalination is affected by some factors, as: the electric potential gradient, created by the electrode reactions and IEM junction potential. Wastewater has a much smaller ion concentration than the desalination chamber (56mS/cm) that creates a significant concentration gradient across an IEM with wastewater. This concentration gradient, caused ions in the middle chamber was driven to the anode and cathode chambers as equation below(Kim and Logan 2013):

where ∆φjct is the junction potential, R the gas constant, T the absolute temperature, F Faraday's constant, z the ionic charge, and ai the activity of ionic species i. Change in the ohmic resistance due to decrease in the conductivity of the solution in the desalination chamber was the main impact on the voltage produced in the ACMDC.
Conclusions
This study demonstrated the electricity generation from exoelectrogenic microorganisms and some other mechanism such as junction potential in the ACMDC. About 50 % of EC in sea water decreased with electricity generation in ACMDC that show this method can be used for pre-treatment of sea water for downstream RO processing with no need for external source of electrical.
Acknowledgment
The authors wish to express their gratitude to Fumatech Company for their kindness in providing Cation and Anion Exchange Membranes.
References
- Blanco Gálvez, J., L. García-Rodríguez, et al. (2009). "Seawater desalination by an innovative solar-powered membrane distillation system: the MEDESOL project." Desalination 246(1–3): 567-576.
- Chun, Y., P. T. Ha, et al. (2012). "Exploring microbial communities and differences of cartridge filters (CFs) and reverse osmosis (RO) membranes for seawater desalination processes." Desalination 298(0): 85-92.
- Elimelech, M. and W. A. Phillip (2011). "The future of seawater desalination: Energy, technology, and the environment." Science 333(6043): 712-717.
- Forrestal, C., P. Xu, et al. (2012). "Microbial desalination cell with capacitive adsorption for ion migration control." Bioresource Technology 120(0): 332-336.
- Goh, P. S., A. F. Ismail, et al. (2013). "Carbon nanotubes for desalination: Performance evaluation and current hurdles." Desalination 308(0): 2-14.
- Kalogirou, S. A. (2005). "Seawater desalination using renewable energy sources." Progress in energy and combustion science 31(3): 242-281.
- Kim, Y. and B. E. Logan (2013). "Microbial desalination cells for energy production and desalination." Desalination 308(0): 122-130.
- Logan, B. E. (2008). Microbial fuel cells, Wiley-Interscience.
- Luo, H., P. Xu, et al. (2012). "Ionic composition and transport mechanisms in microbial desalination cells." Journal of Membrane Science 409–410(0): 16-23.
- Ping, Q., B. Cohen, et al. (2013). "Long-term investigation of fouling of cation and anion exchange membranes in microbial desalination cells." Desalination 325: 48-55.
- Qu, Y., Y. Feng, et al. (2011). "Simultaneous water desalination and electricity generation in a microbial desalination cell with electrolyte recirculation for pH control." Bioresource Technology.
- Quan, X.-c., Y.-p. Quan, et al. (2012). "Effect of anode aeration on the performance and microbial community of an air–cathode microbial fuel cell." Chemical Engineering Journal 210(0): 150-156.
- Wen, Q., H. Zhang, et al. (2012). "Using bacterial catalyst in the cathode of microbial desalination cell to improve wastewater treatment and desalination." Bioresource Technology 125(0): 108-113.
- Werner, C. M., B. E. Logan, et al. (2013). "Wastewater treatment, energy recovery and desalination using a forward osmosis membrane in an air-cathode microbial osmotic fuel cell." Journal of Membrane Science 428(0): 116-122.
- Yadav, A. K., P. Dash, et al. (2012). "Performance assessment of innovative constructed wetland-microbial fuel cell for electricity production and dye removal." Ecological Engineering 47: 126-131.
- Zhao, R., M. van Soestbergen, et al. (2012). "Time-dependent ion selectivity in capacitive charging of porous electrodes." Journal of Colloid and Interface Science 384(1): 38-44.


