Impact of Over-Pumping on the Groundwater Quality of the Dead Sea Basin/ Jordan
Majeda MB Al-Hadidi1 * , Atef A.Al Kharabsheh1 and Rakad A. Ta any1
1
Department of Water Resources and Environmental Management,
Faculty of Agricultural Technology,
Al-Balqa Applied University,
As Salt,
19117
Jordan
DOI: http://dx.doi.org/10.12944/CWE.8.3.04
Copy the following to cite this article:
Al-Hadidi M. M, Al-Kharabsheh A. A, Ta’any R. A. Impact of Over-Pumping on the Groundwater Quality of the Dead Sea Basin/ Jordan. Curr World Environ 2013;8(3) DOI:http://dx.doi.org/10.12944/CWE.8.3.04
Copy the following to cite this URL:
Al-Hadidi M. M, Al-Kharabsheh A. A, Ta’any R. A. Impact of Over-Pumping on the Groundwater Quality of the Dead Sea Basin/ Jordan. Curr World Environ 2013;8(3). Available from: http://www.cwejournal.org/?p=5157
Download article (pdf) Citation Manager Publish History
Select type of program for download
| Endnote EndNote format (Mac & Win) | |
| Reference Manager Ris format (Win only) | |
| Procite Ris format (Win only) | |
| Medlars Format | |
| RefWorks Format RefWorks format (Mac & Win) | |
| BibTex Format BibTex format (Mac & Win) |
Article Publishing History
| Received: | 2013-10-07 |
|---|---|
| Accepted: | 2013-11-05 |
The gravest environmental challenge that Jordan faces today is the scarcity of water. Indeed, water is the decisive factor in the population/resources equation. Whereas water resources in Jordan have fluctuated around a stationary average, the country’s population has continued to rise. A high rate of natural population growth, combined with periodic massive influxes of refugees, has transformed a comfortable balance between population and water in the first half of this century into a chronic and worsening imbalance in the second half. The situation has been exacerbated by the fact that Jordan shares most of its surface water resources with neighboring countries, whose control has partially deprived Jordan of its fair share of water. Current use already exceeds renewable supply. The deficit is covered by the unsustainable practice of overdrawing highland aquifers, resulting in lowered water tables and declining water quality.
Jordan has a climate ranging from Mediterranean to Arid with approximately 80 % of the country receiving less than 100mm of rainfall annually. Evaporation ranges from around 2000 mm / year at the north west of the country to more than 5000 mm / year in Ma'an in the south. The renewable freshwater resources are of the order of 750-850 million cubic meters (MCM) with approximately 65 % derived from surface water and 35 % from groundwater sources. Current demands for water are of the order of 955 MCM,1 attempts to investigate the effect of over-pumping on the groundwater quality in the Dead Sea basin, it would highlight the actual status and quality of water in the basin. Also to help the decision-makers to manage and planning for future policies of the basin. Therefore, that it maintains the sustainability of water resources for future generations andreduce the risk resulting from possible deterioration of water quality that may have resulted from over-pumping.
Material and Methods
Description of the Study Area
Dead Sea Basin is located in the central part of Jordan and covers an area of about 6874 km2.2 The basin lies between coordinates 187664.679 and 256455.773 E and 997532.173 and 1147942.807 N (according to Palestine Belt). Jordan valley, Jordan side valleys and Amman–Zarqa basin from the north, Jafer basin from the south, Azraq basin from the east, bound the basin. The major cities situated in the basin are Madaba, Karak and Tafila, Figure 1. Most of the population in the basin area concentrated at the south of the capital. The population activity has been increased in these areas over the past decade, which led to over-pumping of groundwater to meet water demand in addition to extensive agricultural activities, which deteriorate the groundwater quality in the basin and reflected negatively on the environmental situation and per capita share of water.
The area is affected by the Dead Sea transform system, with elevation ranging from 1260 above the mean sea level(msl) in the northern and southern part of the study area to about 180 (msl) near the Dead Sea. Three main topography features are found in the study area, the plateau feature, highlands toes in the far eastern part, and steep slopes and sharply elevation in the highlands along the Dead Sea escarpment,3 There are several wadis running along the study area, these are Wadi Mujib, Wadi Heedan, Wadi Hasa, Wadi Issal, Wadi Numera, Wadi Ibn Hammad, and Wadi Zarqa Main. The surface water flows westward to the Dead Sea in the lower aquifer, and discharges as thermal water in Zarqa main. The agricultural activities in the study area is affected by climate, topography, soil lesser extent, and availability of supplementary moisture supply, in the recent decades. Many agricultural activities had been developed in the area.
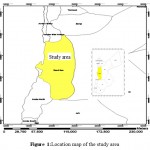 |
Figure 1: Location map of the study area Click here to View table |
Climate
The study area lies within the bioclimatic region; its climate is characterized as semi-arid to arid. A high topographical gradient towards the Dead Sea occurred in the study area combined with a high relief, which effect the climatic parameter distribution specially rainfall in the area. The absolute daily temperature ranges from 42º C in May to around -2º C in January, average annual wind velocity range from 6 - 8 km/hr, the maximum sunshine hours 14 hr/day with minimum of 5 hr /day in winter and the dry bulb temperature is 33º C,4
Geological Setting
The geology of the Dead Sea Basin is affected by a Graben structure formed by subsidence accompanied by block faulting. It is located within the rift valley that accompanies the Dead Sea transform, the basin was formed due to left-lateral displacement along the segmented Dead Sea transform,5 Also it contains a thick accumulation of sedimentary rocks of more than 8000 m thickness, the rock formation in the eastern part of the Dead Sea ranges in ages from Cambrian to lower tertiary, Figure 2. A subsidence accompanied by block faulting, formed the Dead Sea Basin Graben structure. A horizontal displacement approximately 107 km left lateral strike-slip occurred along the Dead Sea rift during the formation of the Dead Sea-Jordan Valley rift, several tectonic Graben structures were formed along N-S, NW-SE and NE-SW, three trends fault trends were recognized in the study area Figure 2.2. The E-W trending faults are normal to the graben faults, they are noticeable on the eastern block, the E-W trending faults were construct as normal faults then they activated as strike-slip faults.5
![vol8no3_Rakad_Impact_fig2 Figure 2:Geological Map of The study area within Jordan Geology ,[2].](http://www.cwejournal.org/wp-content/uploads/2013/11/vol8no3_Rakad_Impact_fig2-150x150.jpg) |
Figure 2: Geological Map of The study area within Jordan Geology.2 Click here to View figure |
Precipitation
Precipitation is the main source of groundwater recharge in the Dead sea basin. Precipitation occurs mostly in winter months (October – mid May) with a maximum appears during December to February and a minimum precipitation in October and May. The mean annual rainfall varies from on area to another, it ranges from 345 mm in Mushaqqar area in the extreme north, near Amman, decreasing to less than52 mm in the western part along the Dead Sea coast (Ghor-Safi area), the rainfall decreases rapidly from highlands towards the west, when moving from north to west, temperatures increased, amounts of rainfall decrease, and evaporation increased. Mushaqqar station has the highest amount with 345 mm and Ghor-Safi is the lowest,4 The analysis of precipitation, showed that 90% of the mean annual rainfall occurs in winter, whereas only 10% occurs in spring and summer, Figure 3.
Hydrogeology
Six aquifer complexes are distinguished in Dead Sea Basin from top to bottom, (WAJ, 2012): Amman - Wadi Sir (B2/A7) aquifer, Hummar (A4) aquifer, Naur Aquifer (A2) aquifer, Kurnub (K) Sandstone aquifer, Zarqa (Z) group aquifer and Rum group (Disi) aquifer. Groundwater resources within the Dead Sea Basin are found in two different aquifer complexes as shown in Table 1, the upper limestone aquifer complex and the lower sandstone aquifer complex, these two aquifers are separated from each other by a major aquitard.6
![vol8no3_Rakad_Impact_fig3 Figure 3:Distribution of Mean monthly rainfall (mm) in the basin,[2].](http://www.cwejournal.org/wp-content/uploads/2013/11/vol8no3_Rakad_Impact_fig3-150x150.jpg) |
Figure 3: Distribution of Mean monthly rainfall (mm) in the basin.2 Click here to View figure |
Methodology
Five hundred water samples of 180 groundwater wells from different locations (Heidan, Swaqa, Lajjoun, Qatraneh, Qastal and Wala) were collected and analyzed for their physical and chemical properties.The water samples were preserved and analyzed in the laboratory of the Department of Water Resources and Environmental Managements at the Faculty of Agricultural Technology of Al-Balqa' Applied University, for Physical parameters such as pH, electrical conductivity EC and chemical parameters such as calcium Ca+2, magnesium Mg+, sodium Na+, potassium K+, chloride Cl-, nitrate NO3-, carbonate CO3- bicarbonate HCO3-2, and sulfate SO4-2.Results of chemical analysis of selected wells are shown in appendices2. The analytical techniques were performed according to standard method for the examination of water and wastewater7
In addition to the analyzed water samples, historical data were collected from open files of the Ministry of Water and Irrigation(MWI) and were determined in this study. Classification of the analyzed groundwater samples of the Dead Sea Basin was done according to.8 Each water sample was plotted on,9 Figure1.The classification of Langguth is based on the measured concentration of the four major cations (sodium, potassium, magnesium and calcium) and the four major anions (bicarbonate, sulphate, chloride and nitrate).The samples were plotted on Trilinear diagram.
The suitability of the groundwater for domestic purposes was determined by comparing the constituent with the Jordan and World Health Organization (WHO) Standards for drinking water. While the suitability of groundwater for irrigation purposes in the study area were determined using,11 diagram. The analyzed water samples were subject to cluster analysis using SPSS software.
![vol8no3_Rakad_Impact_t1 Table 1: Aquifers and aquitard within the study area,[5].](http://www.cwejournal.org/wp-content/uploads/2013/11/vol8no3_Rakad_Impact_t1-150x150.jpg) |
Table 1: Aquifers and aquitard within the study area.5 Click here to View table |
Results and Discussion
It was believed that water quality would be the worst during the summer. The reason for this was that summer is the peak travel season.12 This can result in more pollutants, such as increased carbon dioxide emissions. When it rains, this pollution is brought down from the atmosphere in the precipitation and is washed into storm drains, which empty into streams and lakes. Water near farms and places where animals are kept may have a lowered water quality. Pesticides, fertilizer, and manure would be washed into the water by rain. Pesticides contain chemicals that could be detrimental to the health of the local wildlife. Fertilizers and manures contain increased amounts of nitrates, phosphates, ammonia, and other chemicals. When fertilizers and manures enter streams, they increase the levels of these elements in the water, making the water quality worse.
Water quality damage is blamed partly on the growth of the Jordan population and urban expansion in general and in the Dead sea in particular.which is reflected by the severe abstraction from the groundwater aquifers of the Dead sea basin. Water used for irrigation can vary greatly in quality depending upon type and quantity of dissolved salts. Salts are present in irrigation water in relatively small but significant amounts. They originate from dissolution or weathering of the rocks and soil, including dissolution of lime, gypsum and other slowly dissolved soil minerals. These salts are carried with the water to wherever it is used.
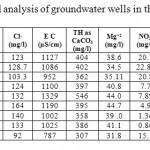 |
Table 2: Descriptive statistical analysis of groundwater wells in the Dead Sea Basin. Click here to View table |
Physical Parameters
The chemical analysis data of101 water samples were subjected to descriptive statistical analysis tests, the resultsare presented in Table 2, descriptive statistical analysis was carried out using SPSS 16.0 and Microsoft Excel software by combining the historical data with the recent analyzed data.
The physical measurements of the groundwater samples showed that, the average electrical conductivity (EC) values range between 983 and 1430 μS/cm. All wells drilled in Wala area have the highest EC, while the EC wells of Swaqa area have the lowest values of EC.Low mineralization indicates that the weathered zone has been highly leached of soluble minerals or groundwater is likely derived from relatively recent direct recharge.A higher evaporation rate in the central and southern parts of the area, frequent occurrences of caliches, and salt accumulation in the soils further reduce potential for fresh rainwater infiltration into the groundwater.
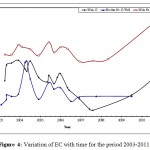 |
Figure 4: Variation of EC with time for the period 2003-2011. Click here to View figure |
The mean values of EC were clearly higher in Wala No.5 compared to the other wells, (Table 2), it can be concluded that EC of Qatraneh well No.9 is more consistent and varied less from the mean. Figure 4 illustrates variation of EC with time for representative wells in the study area.The reason for increasing EC appears to be due to extensive exploitation of groundwater in the region, this caused discharge to exceed recharge. An increase of over-pumping rate from 110,208 m3 to 195,600 m3 due to increasing in population growth near the vicinity of wells in south Amman.In addition to the expansion of cultivated land and extensive irrigation. The value of EC decreased in January and February were recharge occurred which leached the soluble minerals. High amount of EC exhibits large amount of salts dissolved in water, this is not desired because it makes water unsuitable for drinking purposes.
The average values of historical pH measurements range from 6.94 in Lajjoun wells to 7.63 in Heidan wells which indicate that the groundwater is slightly alkaline. Low bicarbonate values are associated with high pH measurements and vice versa.Large scale environmental activities in carbonate rock in Amman Wadi Es-Sir limestone formation (B2/A7) may raise the pH-value,13 14classified water according to the pH value, Table 3. According to Subramanian the water could be classified into two groups, the first is as soft water in Lajjoun area and the second is hard water in Qatraneh, Heidan, Swaqa, and Wala.
The mean values of pH in Table 2 were clearly higher in Heidan No.5 compared to the other wells. A sharp decrease in pH value for Wala No.13 in 2006 and Wala No.14 in 2005, which is properly due to variation in groundwater contamination. In all studied water samples the pH-values are acceptable for drinking water according to JS and WHO Guidelines, 2011.
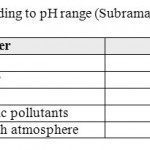 |
Table 3: Type of water according to pH range (Subramania, 1999). Click here to View table |
Chemical Parameters
The average values for total hardness ranges from 365.4 mg/l in Swaqa to 442.7 mg/l in Wala. All the concentrations of calcium were higher than magnesium for all studied water samples; this probably due to the dissolution of limestone involves the following equilibrium,15

So, the prominent mineral result from the dissolution process of the limestone rocks is the calcium, since, the main constitute of the geological formation in the study area is the limestone and partly dolomite. According to,15 all samples are classified very hard water Table 4. The classification of very hard water could be attributed to the over-pumping of the wells in the catchments area in addition to the presence of dissolved calcium and magnesium salts originated from limestone rocks.
The mean values of total hardness in Table 2 were clearly higher in Wala No.5 compared to the other wells.The increase in total hardness with time due to over-pumping of the aquifer from the vicinity near these areas and a subsequent lowering of the water table.The decrease in total hardness in winter month due to the recharge of the basin directly from rainfall. All the studied samples have total hardness values in within permissible limit of JS and WHO Guidelines,10
The average level for calcium ranges from 76.45 mg/l in Swaqa to 112 mg/l in Wala which has maximum values of calcium, which is due to the cationic exchanges with sodium. While low values is due to the reverse cationic exchanges with sodium.The concentration of calcium in the groundwater was characterized by significantly weaker changeability. The mean values of calcium in Table 2 were clearly higher in Wala No.5 compared to the other wells.
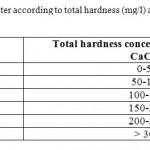 |
Table 4: Classification of water according to total hardness (mg/l) as CaCO3,(Freeze and Cherry, 1979) Click here to View table |
Average values of magnesium range from 36.96 mg/l in Heidan to 45.1 mg/l in Qatraneh.The ratio of Mg/Ca for all wells is below 1 which indicate that the sources of solute in the shallows aquifers is the dissolution of soluble minerals. The mean values of magnesium in Table 2 were clearly higher in Qatraneh No.24. It can be concluded that concentration of magnesium for Wala No.4 is less consistent and varied less from the mean. The concentration of magnesium are within permissible limit of JS and WHO Guidelines.10
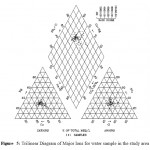 |
Figure 5: Trilinear Diagram of Major Ions for water sample in the study area Click here to View figure |
Values of sodium range from 67.75 mg/l in Heidan to 123.77 mg/l in Qatraneh.Relatively high concentrations may be found in brines and hard water and this explains the positive relation between total hardness (Ca2+and Mg2+), sodium and EC such as in Qatraneh area. The high Na content in some samples is derived from cation exchange process between Ca-HC03water and sodium rich zeolites. Sodium is usually released to the water, and calcium ions will be fixed by zeolites.The concentration of sodium in all 500 samples are within the permissible limits of (JS) and (WHO) guidelines.15
The average values of potassium range from 2.71 mg/l at Swaqa to 5.05 mg/l at Heidan.Lower value of potassium is due to greater resistance to its weathering and fixation in the formation of clay minerals.While high concentrations result from the presence of silicate minerals from igneous, metamorphic rocks and agricultural activities represented by the addition of fertilizer to soil present in the recharge areas of these wells, fertilizing with potassium nitrate and manure.
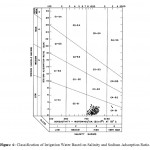 |
Figure 6: Classification of Irrigation Water Based on Salinity and Sodium Adsorption Ratio. Click here to View figure |
The average values for chloride ranged from 113.66 mg/l in Heidan to 191.69 mg/l in Qatraneh which is the same as sodium.The dissolution of rocks and soils in the study area is also may contribute in considerable amount of chloride constituents for the wells, variations in chlorinity are caused by changes in lithology, residence time of water and pollution.
Average bicarbonate value of water in terms of CaCO3 varied from 279 to 340 mg/l, the maximum value of bicarbonate (340 ppm) is recorded in Wala. The concentration of bicarbonate is the highest in all cation and anions. pH value is an important factor in maintaining the carbonate and bicarbonate levels in water. Since the observed pH value is below 8.5; the carbonate values are not detectable for groundwater samples. Bicarbonate was the dominant anion that imparting alkalinity to groundwater, this is supporting the alkaline pH in the study area. The high values of bicarbonates are produced from the dissolution of limestone and marl which mainly contribute in the studied well geological formation.
Classification of Water Samples Using Piper Diagram
The classification of Langguth is based on the measured concentration of the four major cations (sodium, potassium, magnesium and calcium) and the four major anions (bicarbonate, sulphate, chloride and nitrate). The dominant cations are calcium plus magnesium and chloride is the dominant anions for all wells in the basin.
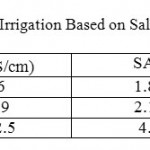 |
Table 5: Classification of water Use Irrigation Based on Salinity and Sodium Adsorption Ratio (SAR) Click here to View table |
The Piper plot cations triangle shows that there is an increased in the proportion of calcium and magnesium on the expense of sodium. In the Piper anions triangle there is a clearly defined trend of decreased in bicarbonate and carbonates with increased in chlorideandsulphate, Figure 5. Two types were concluded:
Type 1
The type of this water is Alkaline earth waters with increased portion of alkalis and prevailing chloride. About 90% of the groundwater samples fall within this type. Chloride is the major anions and has an average percentage of about 56% in the analyzed water samples. The percentage of earth alkaline ions is higher than that of the bicarbonate. The chemistry of water shows the flowing ionic:
Ca+2>Mg+2>Na+
Ca+2> HCO3 -
Cl- >SO4 -2>HCO3 -
This water type is characterized by relatively high salinity, samples are characterized by the dominance of Cl + SO4 over HCO3, and calcium is the dominant cation in the chemical facies of most groundwater samples, followed byMg andNa. The chemistry of this type originated from the weathering, leaching of sedimentary rocks, and the dissolution of salt deposits.
Type 2
The type of this water is alkaline water with prevailing chloride. This type represents about 10% of the total water samples in the Dead Sea basin. It characterized by high sodium percentage of about 32%. This type shows low medium salinity and classified as Na-SO4 type. The reason of high sodium percentage and lower alkaline ions in this water is due to ion exchange capacity of the sodium rich clay layers when floodwater percolate through the basalt rock the ionic order of this type is:
Ca+2>Mg+2>Na+
(Ca+2 +Mg+2)>(HCO3 -+SO4 -2)

Domestic Water
The suitability of the groundwater for domestic purposes was determined by comparing the constituent with the Jordan and World Health Organization (WHO) Standards for drinking water. According to WHO standards, water with total dissolved solids (TDS) of less than 1000 mg/l is acceptable for human consumption. According to Jordan standards, water with TDS less than 1500 mg/l is acceptable for human consumption. The water with a TDS less than 1000 mg/l all satisfy the WHO standard for maximum sodium concentration (200 mg/l), sulphate concentration (250 mg/l) and bicarbonate concentration (350 mg/l as CaCO3). Few samples slightly exceeded the level of chloride (300 mg/l). No water samples exceeded the guidelines concentration of nitrate (50 mg/l).
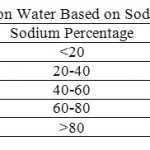 |
Table 6: Classification of Irrigation Water Based on Sodium Percentage (Todd, 1980) Click here to View table |
Irrigation Water
The salinity hazard and sodium adsorption ratio (SAR) were used to evaluate the suitability of groundwater for irrigation purposes in the study area. Wilcox, at the USA Salinity Laboratory (1954) developed a diagram classifying the waters into 3 groups based on their electrical conductivity (EC) and SAR .The sodium adsorption ratio (SAR) is expressed as
SAR=Na / √ (((Ca+Mg)) / 2)
Where, the concentration of the constituents is expressed in meq/l. All the water under consideration has been plotted on a Wilcox diagram, Figure 6. All groundwater samples plot in irrigation classes C3-S1 and C4-S1. Low –sodium (S1) can be used for irrigation on almost all soils with little danger of the development of a harmful level of exchangeable sodium. High salinity water (C3) cannot be used in soils with restrictive drainage. Very high salinity (C4) water will not be recommended for irrigation. Combining the two hazards, sodium and salinity, the water of the Dead Sea Basin falls into two main classes. Cluster 1 and Cluster II classified as (C3-S1) and Cluster IIIclassified as (C4-S1).The water of class (C3-S1), theoretically can be used with caution, Table 4 . In addition, sodium concentration is an important factor in classifying irrigation water.
The sodium content is usually expressed in terms of sodium percent and is defined as:
Na%=Na/(Na+K+Ca+Mg)*100
Where, all ionic concentration are expressed in meq/l, Table 5, shows the classification of irrigation water according to.16
Conclusions
This study has concluded the following results:
- The physical measurements of the groundwater samples showed that, the average electrical conductivity (EC) values range between 983 and 1430 μS/cm. All wells drilled in Wala area have the highest EC, while the EC wells of Swaqa area have the lowest values of EC.
- Low mineralization indicates that the weathered zone has been highly leached of soluble minerals or groundwater is likely derived from relatively recent direct recharge.
- The water samples related to the total hardness value in (mg/l) as CaCO3 were classified as very hard water according to freeze and cherry classification.
- The high increase of potassium concentration for the last years, at Wala well No.13 and Wala well No.14 is due to urban expansion in the vicinity of these wells in south Amman this led to agricultural activities represented by the addition of fertilizer to the soil present in the recharge areas.
- The average values of historical pH measurements range from 6.94 in Lajjoun wells to 7.63 in Heidan wells, which indicate that the groundwater is slightly alkaline. Low bicarbonate values are associated with high pH measurements and vice versa.
- Based on chemical analysis and historical data major elements (cations and anions) of the groundwater in the study area are within permissible limit of Jordan standards (JS) and World Health Organization (WHO) Guidelines.
- Piper Classification showed that there are two types of groundwater in the study area is earth alkaline water with increased portions of alkalis with prevailing sulfate and chloride, the order of abundance is:Ca+2+2+ for cations and Cl-4-2< HCO3- for anions. The second type is of alkaline water with prevailing chloride. This type represents about 10% of the total water samples in the Dead Sea basin. This type shows low medium salinity and classified as Na-SO4 type.
- The water of the Dead Sea Basin falls into two main classes. Cluster 1 and Cluster II classified as (C3-S1) and Cluster III classified as (C4-S1).The water of class (C3-S1), theoretically can be used with caution. Very high salinity (C4) water will not be recommended for irrigation.
- Deteriorating of groundwater quality and declining of groundwater levels will threaten the groundwater resources in the future.
Acknowledgements
The authors acknowledge the assistance of the Water Authority of Jordan represented by Dr. Khair Al-Hadidi for his continuous support and providing us with the historical data needed in this study. Also much gratitude to Dr. Hazem Shareef Hassan for his help in statistical analysis, which are used in this study.
References
- Elâ€Naqa, A. Alâ€Momani, M.; Kilani,S. , A. and Hammour, N., (2007). Groundwater Deterioration of Shallow Groundwater Aquifers Due to Overexploitation in Northeast Jordan. Clean, Vol. 35 (2), 156 – 166.
- Ministry of Water and Irrigation (MWI). 2012. Water Information System Hydrological, geological and hydrogeological data bank. MWI, Water Resources and Planning Directorate, Amman, Jordan.
- Executive Action Team (EXACT). 2005. Overview of Middle East Water Resources of Palestinian, Jordanian, and Israeli Interest.Water Data Banks Project, Multilateral Working Group on Water Resources, Middle East Peace Process.
- JMD (Jordan Meteorological Department), (2010). Annual Report, Ministry of Transport. Amman, Jordan.
- Sawarieh, A. 2005. Heat sources of the groundwater in the Zara-Zarqa Ma'in-Jiza area, Central Jordan, PhD thesis, University of Karlsruhe, Germany.
- Al-Raggad, M. 2009. GIs-Based Groundwater Flow Modeling and Hydro geological Assessment of the Northern Part of the Dead Sea Groundwater Basin, a tool for Groundwater Managements, PhD thesis, University of Jordan. Jordan.
- APHA (American Public Health Association), 2000. Standard Methods for the Examination of Water and Wastewater.
- Langguth, H. R. 1966. Groundwasser verhaltisse in. Bereich des. velbertersatües Der- 'Minister for Ernährung land. Wistschaft and Förstern. NRW, Dusseldorf, 127p. Germany.
- Piper, A. M. 1944. Graphical procedure in geochemical interpretation of water analysis. Trans-American Geophysical Union, 25: 914-928.
- World Health Organization (WHO), 2011. Guidelines for Drinking water quality, Genva-Switzerland.
- WILCOX, L.V., 1955. Classification and use of irrigation waters. US Dept. Agri. Circ. 969. Washington, D.C., USA. 19p.
- Christie, L., 2005. Summer travel: Fares, room rates spike. Retrieved April 18, 2008, from CNNMoney.com Web site: http://money.cnn.com/2005/05/02/pf/travel_summer_trends_2005/index.htm.
- Stone, N., M. And Thomforde, H., K. 1977. Understanding your fish pond. Water Analysis Report. University of Arkansas at Pine Bluff, USA.
- Subramania, S. M. 1999. Environmental chemistry and analysis. Indian Institute of Technology Madras. India.
- Freeze, R. A. and Cherry, J.A., (1979). Groundwater Book. Englewood Cliffs, NJ, Prentice Hall, Inc., 590 pp., USA.
- Todd, D. K. 2007.Groundwater hydrology third edition, John Wiley and Sons, Third Reprint. Inc. India. 535p.


