Effect of Agricultural Activities on Water Quality Deterioration of Mujib Basin, Jordan
Atef Al-Kharabsheh1 * and Mohamad Alatoum1
1
Al-Balqa Applied University and UNDP Office,
Amman
DOI: http://dx.doi.org/10.12944/CWE.8.3.02
Copy the following to cite this article:
Al-Kharabsheh A, Alatoum M. Effect of Agricultural Activities on Water Quality Deterioration of Mujib Basin, Jordan. Curr World Environ 2013;8(3) DOI:http://dx.doi.org/10.12944/CWE.8.3.02
Copy the following to cite this URL:
Al-Kharabsheh A, Alatoum M. Effect of Agricultural Activities on Water Quality Deterioration of Mujib Basin, Jordan. Curr World Environ 2013;8(3). Available from: http://www.cwejournal.org/?p=5352
Download article (pdf) Citation Manager Publish History
Select type of program for download
| Endnote EndNote format (Mac & Win) | |
| Reference Manager Ris format (Win only) | |
| Procite Ris format (Win only) | |
| Medlars Format | |
| RefWorks Format RefWorks format (Mac & Win) | |
| BibTex Format BibTex format (Mac & Win) |
Article Publishing History
| Received: | 2013-11-04 |
|---|---|
| Accepted: | 2013-12-15 |
Surface water resources are distributed among 15 basins. The largest source of external surface water is the Yarmouk River at the Syrian border. Originally, the annual flow of the Yarmouk River was estimated at about 400 million cubic meter (MCM) (of which about 100 MCM are withdrawn by Israel). Total flow is now much lower than 400 MCM as a result of the upstream Syrian development works, which took place in the 1980’s. The Yarmouk River accounts for 40 % of the surface water resources of Jordan, including water contributed from the Syrian part of the Yarmouk basin. It is the main source of water for the King Abdullah Canal (KAC) and is thus considered to be the backbone of development in the Jordan River. Other major basins include Zerqa River Basin, Jordan River side wadis, Wadi Mujib, the Dead Sea side wadis, Wadi Hasa and Wadi Araba. Internally generated annual surface water resources are estimated at 400 MCM (WAJ Files).
Jordan’s groundwater is distributed among 12 major basins. The internally produced annual renewable groundwater resources (safe yield) are estimated at 277 MCM. The baseflow of the rivers constitutes around 335 MCM, a large portion of which is of fossil origin, recharged during more humid climatic periods, and thus does not reflect present day recharge. Groundwater resources are concentrated mainly in the Yarmouk, Azraq, Amman-Zerqa and Dead Sea Basins (WAJ Files).
Most of the basins are over-exploited. The annual deficit in the water balance is around 230 MCM. Over-extraction of groundwater resources has degraded water quality and reduced exploitable quantities, resulting in the abandonment of municipal and irrigation water well fields (Wadi Dhuleil). High nitrate contents are observed in East Mafraq and South of Amman. Several large springs (Salt, Mujib and Irbid areas) are affected by bacterial contamination, due to insufficient sewage water collection and treatment (Margane and Sunna. 2002).
The main non-renewable aquifer presently exploited is the Disi aquifer (sandstone) in southern Jordan with a safe yield of 100 MCM for 100 years. Other non-renewable water resources are found Jafr basin, for which the annual safe yield is about 18 MCM. In total, it is estimated by the Water Authority of Jordan (WAJ) that the safe yield of fossil groundwater is 143 MCM.
The agricultural water use is about 75 percent of the annual withdrawal, which estimated to about 1200 MCM, while the industrial and domestic percentages are 4 and 21 percent respectively including the use of treated wastewater. Due to limited and widely scattered sources of water, the construction of important water conveyance facilities was undertaken to meet the demand of the population, which is concentrated in some areas. Some shortages have been observed during the recent years, but they are generally limited to less than 10 percent of the demand.
The potential for irrigated cultivation is estimated at around 840,000 ha. However, taking into consideration potentially available water resources, the irrigation potential is about 85,000 ha, including the area currently irrigated (JVA Files).
The main purposes of this study are to establish a base line assessment for water quality, to be comparable base for further monitoring, identify main threats that may pollute the water in Mujib River, investigate the effects of agricultural practices on the natural water system and find the interrelationship between the results of hydrochemical characteristics of the spring's waters and recent pollution levels of these springs.
Wadi Mujib is a gorge enters the Dead Sea at 410 m below sea level (bsl). The Mujib Nature Reserve (MNR) is the lowest nature reserve in the world, located in the mountainous landscape to the east of the Dead Sea, approximately 90 km south of Amman. The 220 km2 reserve was created in 1987 by the Royal Society for the Conservation of Nature (RSCN) and is regionally and internationally important, particularly for the bird life that the reserve supports. It extends to the Karak and Madaba mountains to the north and south, reaching 900 m (asl) in some places. This 1300 meter variation in elevation, combined with valley’s year round water flow from seven tributaries, means that Wadi Mujib enjoys a magnificent biodiversity that is still being explored and documented today.
Hydrology
Mujib basin is located in the central part of Jordan, south of the Capital, Amman. The basin drains approximately 6593 km2 of mainly plateau land to the east of the Dead Sea. The area is bounded by Zerqa basin in the north and Hasa basin in the south, while it extends to Azraq and Sirhan basins in the east and to the Dead Sea to the west. The majority of the basin east to the Jordan Rift Valley ranges between 700 and 900 m asl. In the hills on the eastern edge of the Valley, the topography is rugged, scarp and steep canyon drops to elevation about 400 m below sea level (bsl) adjacent to the Dead Sea. Fig. 1 shows location of Wadi Mujib Basin and location of the collected samples.
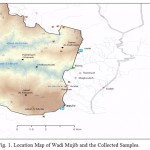 |
Figure 1: Location Map of Wadi Mujib |
The rainy season in Jordan begins in October and ends in May. The rest of the year is particularly dry with almost clear sky. The Mujib basin is semi-arid to arid, with low rainfall in most parts of the basin in winter and high temperatures in summer. Precipitation in the basin results primarily from frontal depressions entering from Mediterranean region in the west. During the rainy season, three to four frontal depression systems per month may cross the basin (Samawi and Sabbagh, 2005). These large frontal systems, which develop generally from December to March, become less active as they advance towards the eastern and southern part of the basin. A low depression, predominant over the center of the Red Sea, occasionally extends northwards at the beginning or end of the winter season, resulting in thunderstorms and short duration, heavy rainfall.
Rainfall and temperature are spatially variable, primarily because of the high variable topography and thunderstorm activity. Thunderstorms are spatially likely at the beginning or end of the winter season, causing sharp peaks of flashy floods because of the high intensity of rainfall. Average annual rainfall decreases from over 300 mm near the western edge of the basin to less than 50 mm at the eastern edge. In wet years rainfall in the western part of the catchment can reach a maximum of almost 700 mm, whereas the minimum in dry years may be as low as 100 mm. Fig. 2 shows monthly rainfall for Wadi Wala station in Mujib basin.
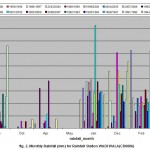 |
Figure 2: Monthly rainfall (mm) for rainfall station (CD0006) Click here to View figure |
Discharge of Wadi Mujib
Discharge of Wadi Mujib is measured at station CD0035 on daily basis at the downstream of Mujib dam. The discharge ranges from 0 in the drought times to a peak of 40 m3/sec in the year 1964/1965 (WAJ Files). It is clearly seen that most of the flood occurs during the winter season, which means that the springs are highly affected by the rainy season. During droughts, most of the spring water is used for irrigation purposes on both sides of the wadi.
Aquifer Characteristics of Mujib Basin
The most significant aquifers in the area are B2/A7 aquifer and Kurnub/Disi aquifer. Over most of the western part of Mujib dam surface water catchment the B2/A7 aquifer is at outcrop and thus receives groundwater recharge. In the westernmost part the B2/A7 aquifer is overlain by basalt, which acts as an aquifer as well, so that basalt and B2/A7 principally may form a combined aquifer. To the north of Wadi Mujib, strata dip generally in a northeasterly direction (Margane and Hobler, 1994) so that here groundwater flow in most likely directed towards Wadi Wala.
Below the A7, the Ajlun group formation A3 to A6 act as an aquitard, though thin intercalations of limestone are included in this sequence. The A1/2 aquifer is only relevant downstream of the dam and the respective water level is found at elevations considerably below the level of reservoir. This also applies for the kurnub/disi aquifer. This aquifer is considered as a combined aquifer in all Mujib Catchment area because the Zerqa Group, which acts as an aquitard, separating the two units farther to the north is missing (Margane et al., 2008).
Generally, groundwater flow in the kurnub/disi is directed towards Wadi Mujib, which as the main collector of its outflow to the Dead Sea. Flow velocity in groundwater compared to those in surface water is significantly less. Whereas flow in surface water may reach several kilometers per day, flow in groundwater is in the range of few centimeters to meters per day. In Mujib Catchment Area, flow path is long enough for microbial constituents to have died off well before groundwater reaches Mujib dam so that bacteriological contamination along this flow path is not an issue. The aquifers are overexploited and sharp drawdown can be seen in all observation wells located in the basin (Fig. 3).
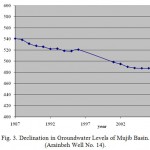 |
Figure 3: Declination in Groundwater Levels of Mujib Basin. (Arainbeh Well No. 14). Click here to View figure |
Methodology of Water Analysis
The examination of water quality is basically a determination of microorganisms, minerals and organic compounds contained in the water. Physical analyses; pH, turbidity & electrical conductivity, chemical analyses; cations (Na+, K+, Ca2+ & Mg2+), anions (Cl-, HCO3-, SO42-, NO3-, NO2- & PO43-), heavy metals (Br, Cr, Co, Ni and F), hardness and alkalinity and biological analyses; Eschericha coli and Total Coliform (MPN/100 ml) were performed on springs water samples to determine their water quality. These analytical techniques were performed according to the procedures mentioned in Standard Methods for the Examination of Water and Wastewater, 17th Edition (Clesceri et al., 2007). The analyses were done at the Labs of the Ministry of Water and Irrigation in Amman. Table 1 summarizes the analytical methods for the analyzed parameters.
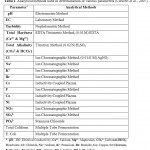 |
Table 1: Analytical methods used in determination of various parameters (Clesceri et al., 2007). Click here to View table |
About 12 water samples were collected from Mujib dam and Wadi Mujib and 12 springs recharging Wadi Mujib and discharge their water from Upper Cretaceous aquifers (B2/A7). The samples were collected at the beginning of November 2009 before the rainy season begins in the driest period of the year and repeated in February 2010 after the rainy season to show variations in pollution levels during summer and winter. Tables 2 and 3 present the description of the collected samples (surface water and spring water). Table 4 shows the JS and WHO Guidelines for drinking water. Statistical analyses of the physical, chemical and biological analyses are presented in Table 5.
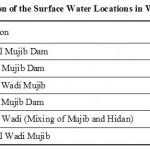 |
Table 2: Description of the Surface Water Locations in Wadi Mujib Basin. Click here to View table |
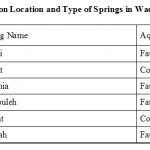 |
Table 3: Description Location and Type of Springs in Wadi Mujib Basin. Click here to View table |
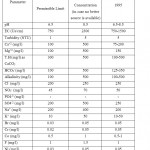 |
Table 4: The Jordanian standards (JS) and WHO Guidelines for drinking water (WAJ Files). Click here to View table |
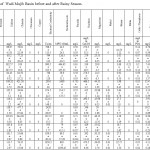 |
Table 5: Water Quality of Wadi Mujib Basin before and after Rainy Season. Click here to View table |
Results and Discussion
The quality of water deals with its chemical, physical and biological constituents. Natural groundwater contains many chemical species in the dissolved state. These constituents occur as a result of many physical and chemical processes on geological formation and from many chemical reactions in the atmosphere. Furthermore, the nature of these constituents is a function of the type of rocks, and its distribution, as well as physical and chemical constraints of many weathering processes. The determination of minerals, organic compounds and microorganisms is important to examine the water quality.
The Jordanian Standards (JS) and the World Health Organization (WHO) Guidelines for drinking water are mainly considered to evaluate the springs' water suitability for drinking purposes. Most prominent factors that affect quality of the recharge area of the springs are the unplanned land use around the recharge sources of the springs. High slopes of the catchment area accelerate the pollution rate and make the springs directly influenced by the pollutants along the recharge area of the springs. The geological formation of the Upper Cretaceous Limestone rocks that cover the catchment area of the springs also increases the pollution rate due to the presence of joints, faults and massive cliffs through it.
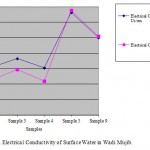 |
Figure 4: Electrical Conductivity of Surface Water in Wadi Mujib. Click here to View figure |
Physical Parameters
The values of average of pH for the different springs were ranged from 7.67 to 8.80 and from 7.15 to 8.01 for surface water and springs, respectively. The increasing of bicarbonate concentration in water helps pH-value to decrease. The existence of limestone in Amman Wadi Es-Sir Formation (B2/A7) may raise the pH-value (Stone and Thomforde, 1977). In all studied water samples the pH-values are acceptable for drinking water according to JS and WHO Guidelines. According to the Subramanian classification (1999), the water samples could be classified as hard water.
The values of average of Electrical Conductivity (EC) for surface water and springs samples were ranged from 660 to 2030 (Us/cm) and from 831 to 2470 (Us/cm), respectively. There is a positive relation between EC and dissolved salts in water. Most of springs in the study area are located within agricultural areas that affect the springs' water quality since high value of EC could be attributed to the drainage water. So, there are no continuous pollution sources in the vicinity of the recharge area of this spring and this may explain its low value of EC. The addition of excess of agricultural fertilizers to the soil increases the value of leached chemical pollutants to springs' water represented by the nitrogenous, phosphates or organic fertilizers. Total Dissolved Solid (TDS) (mg/l) = A* EC (Us/cm). Since, A is a factor and its range (0.55-0.8)). Fig.’s 4 and 5 show the variation of electrical conductivity for surface water and spring water before and after rainy season.
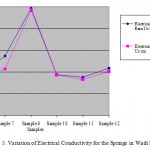 |
Figure 5: Variation of Electrical Conductivity for the Springs in Wadi Mujib Click here to View table |
The values of average of turbidity for water samples were ranged from 2.15 to 39.3 NTU and from 0.36 to 27.8 NTU for surface water and springs, respectively. All studied springs have turbidity values within permissible limit of JS and WHO Guidelines accept sample no.12 (Rashah spring). It was clear that the turbidity was increased after rainy season, which means that the springs are directly influenced by the recharge water
Chemical Parameters
The values of average of the total hardness for water samples were ranged from 230 to 574 mg/l and 384 to 547 mg/l for surface water and springs, respectively. All the studied springs have total hardness values within permissible limit of JS and WHO guidelines. According to Freeze and Cherry (1979), all samples are classified as hard and very hard water.
All the concentrations of calcium were higher than magnesium concentration for all studied water samples; this probably due to the dissolution of limestone involves the following equilibria:
CaCO3 ↔ Ca2+ + CO32- CO32- + H2O ↔ HCO3- + OH-
So, the prominent mineral result from the dissolution process of the limestone rocks is the calcium. Since, the main constitute of the geological formation in the study area is the limestone and partly dolomite. All the studied samples have calcium and magnesium values in (mg/l) within permissible limit of JS and WHO Guidelines. The classification of very hard water could be attributed to the presence of limestone rocks in their geological formations, in addition to the presence of pollutant sources presented by agricultural activities near the recharge sources of the catchment area.
The relative amount of each of carbonate and bicarbonate in the studied springs' water depends upon their pH value. The carbonate concentration in all studied springs is equal to zero but there is bicarbonate due to pH value, which is less than 8.3. This pH value is the permissible limit for bicarbonate to be available in water but not for carbonate which present when the pH lies between 8.3 and 10. So, in all studied springs the total alkalinity values is represented by CaCO3 concentrations. The alkalinity values range from 106 to 200 mg/l and from 173 to 390 mg/l for the surface water and springs, respectively. There is a positive relation between EC and total alkalinity.
Relatively high values of bicarbonate for the studied samples are primarily the result of dissolution of limestone and marl which mainly contribute in the studied springs' geological formation. HCO3 ranges from 148 to 185 mg/l and 211 to 475 mg/l for the surface water and springs, respectively. In addition to the ions dissolution during the path of springs' water to the surface, the leaching of domestic and municipal drainage water to the spring source increase its bicarbonate value. All studied samples have total alkalinity values within permissible limit of JS and WHO Guidelines.
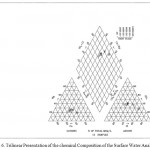 |
Figure 6: Trilinear Presentation of the chemical Composition of the Surface Water Analyses. Click here to View figure |
The average values for chloride were ranged from 56 to 450 mg/l and from 33 to 594 mg/l for surface water and springs, respectively. The relatively high values of chloride could be attributed to the effect of agricultural activities at the recharge area of the sources. The dissolution of rocks and soils in the study area is also may contribute in considerable amount of chloride constituents for the springs' water. Most of the studied samples have chloride concentrations within permissible limit of JS and WHO Guidelines accept two samples.
The average values for nitrate were ranged from 0.28 to 4.9 mg/l and from 0.2 to 29.8 mg/l for surface water and springs, respectively. This could be attributed to contribution of excess nitrogen fertilization due to agricultural activities in some areas.
The high concentrations indicate high probability of the presence of organic matter resulting from agriculture. Other sources of nitrate are decaying of root nodule bacteria and legume plants results from the agricultural areas expanded in the catchment area. All samples are located within the permissible limits of JS and WHO.
The phosphate concentration in both surface water and spring water is negligible. Kölle (2003) defined that if the phosphate concentrations higher than 100 µg/l then it could be considered as a pollution indicator. Organic waste, excrements or wastewater can have a direct impact on the phosphate concentrations in the groundwater. PO4 concentration ranges from 0.02 to 0.23 mg/l and from 0.02 to 0.04 for surface water and springs, respectively.
The average values for sulfate were ranged from 107 to 286 mg/l and from 48 to 329 mg/l for surface water and springs, respectively. The sulfate composition is contained in spring water as a result of chemical weathering of some of the sedimentary rocks. All studied samples have sulfate values within permissible limit of JS and WHO Guidelines.
The average value of sodium were ranged from 47 too 231 mg/l and from 35 to 299 mg/l for surface water and springs, respectively. Relatively high concentrations may be found in brines and hard water and this explains the positive relation between total hardness (Ca2+ & Mg2+), sodium and EC. All studied samples have sodium values within permissible limit of JS and WHO Guidelines.
The average values for potassium were ranged from 6 to 16 mg/l and from 3 to 9 mg/l for surface water and springs, respectively. The high values of potassium could be attributed to the agricultural activities represented by the addition of fertilizers to soils presented in the recharge areas of these springs.
The potassium content of natural water is usually less than sodium, calcium and magnesium since, in nature it is adsorbed by clay minerals such as smectite. All studied springs have potassium values within permissible limit of JS and WHO Guidelines.
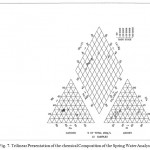 |
Figure 7: Trilinear Presentation of the chemical Composition of the Spring Water Analyses. Click here to View figure |
Heavy Metals
Bromide is a naturally present constituent in some groundwater and in coastal water due to saltwater intrusion; it contributes to the formation of toxic tap water disinfections by products. It is also a component of crude oil extraction brines and is used in making fumigants, flame proofing agents, dyes and sanitizers. No information on potential health impacts for bromide was identified in standard government and academic sources.
The maximum allowable concentration (MAC) of 0.05 mg/l for chromium in drinking water was set based on health considerations. Trivalent chromium, the most common natural state of chromium, is essential in humans and animals for efficient lipid, glucose and protein metabolism. It is considered to be non-toxic. However, if it is present in raw water, it may be oxidized to hexavalent chromium during chlorination. Concentrations of total chromium in drinking water are usually well below the MAC. Chromium is not considered a contaminant of concern in the Northwest Territories. Chromium is a metal found in natural deposits as ores containing other elements. The greatest use of chromium is in metal alloys such stainless steel; protective coatings on metal; magnetic taps; and pigments for paints, cement, paper, rubber, composition floor covering and other materials. Its soluble forms are used in wood preservations. The aesthetic objective (AO) for copper in drinking water is 1.0 mg/l. This was set to ensure the water tastes okay and to minimize staining of laundry and plumbing fixtures. Copper is an essential element in human metabolism, and deficiencies result in a variety of clinical disorders, including nutritional anemia in infants. Although large doses of copper may result in adverse health effects, the levels at which this occurs are much higher than the aesthetic objective (AO). Copper occurs in nature as a metal and in minerals. It is reddish metal that occurs naturally in rock, soil, water, sediment and air. Its unique chemical and physical properties have made it one of the most commercially important metals. Since copper is easily shaped or molded, it is commonly used to make pennies, electrical wiring and water pipes. Copper compounds are also used as an agricultural pesticide and to control algae in lakes and reservoirs. It is an essential element for all known living organisms, including humans. However, very large single or long-term intakes of copper may harm the health.
The maximum acceptable concentration (MAC) for fluoride in drinking water is 1.5 mg/l. Fluoride-containing compounds are added to drinking water to help prevent dental cavities. Fluoride can occur naturally in surface waters. Groundwater can also contain high concentrations of fluoride due to leaching from rocks. Fluoride can be present in plant and animal tissues. Some communities, such as Yellowknife, add fluoride to the water to help prevent tooth decay. Fluoride is one of many of the earths naturally occurring elements. Fluoride is found in varying amounts of soil, water, plants and most foods and is the 13th most abundant element in the earths crust. Recommended fluoride usage is one of the most effective ways humans can prevent tooth decay.
The primary source of nickel in drinking water is leaching from metals in contact with drinking water, such as pipes and fittings. However, nickel may also present in some groundwater as a consequence of dissolution from nickel ore-bearing rocks. All studied samples have heavy elements within permissible limit of JS and WHO Guidelines.
Classification of Hydrochemical Characteristics of Surface Water and Springs Using Piper Diagram
The water samples of the studied springs in the study area were plotted on Piper diagram (1944). Piper (1944) found a trilinear diagram that permits the classification of the water according to Langguth (1966) diagram.
According to Langguth classification the surface water shows alkaline earth water with increased portion of alkalies and prevailing chloride (Fig. 5). Four types of water were seen in the spring water; alkaline earth water with bicarbonate chloride, alkaline earth water with increased portion of alkalies with prevailing bicarbonate, alkaline earth water with increased portion of alkalies with prevailing chloride and alkaline water with prevailing chloride (Fig. 6).
The chemistry of this water is originated from the dissolution of carbonate rocks and evaporates deposits such as Gypsum. The high concentrations of Na+, Cl-,SO4- and NO3- could be attributed to the high probability of water contamination from agricultural activities. The Cl− concentration may be associated with the same source of Na+ (Mazor et al., 1993). The chemistry of these types of water shows the following ionic order:
Ca2+ > Na+ > Mg2+ > K+
HCO3- > SO42->Cl- > NO3- > PO4-
Biological Parameters
The coliform group of bacteria is the principal indicator of suitability of water for domestic, industrial or other uses. Coliform group density as a criterion of the degree of pollution and thus of sanitary quality (Sawyer and McCarty, 1978). This group is a natural part of the microbiology of the intestinal tract of warm blooded mammals; including man and present in the gut and feces of warm blooded animals generally include organisms capable of producing gas from lactose in a suitable culture medium at 44.5±0.2°C. It can also be found in soil, other animals, insects, etc.
Coliform bacteria are not pathogenic (disease causing) organisms, and are only mildly infectious. For this reason, these bacteria are relatively safe to work with in the laboratory. If large numbers of coliforms are found in water, there is a high probability that other pathogenic bacteria or organisms, such as Giardia and Cryptosporidium, may be present.
The total coliform group is relatively easy to culture in the lab, and therefore, has been selected as the primary indicator bacteria for the presence of disease causing organisms (Metcalf and Eddy, 1991). For the detection of bacteria of the Coliform Group, here we use the Multiple-Tube Fermentation procedure as a Most Probable Number (MPN) index.
The average values for total coliform were ranged from 79 to 1600 MPN/100 ml and from 1.8 to 1600 MPN/100 ml for surface water and springs, respectively. All studied springs have total coliform values exceed the permissible limit according to JS and WHO Guidelines. According to these values, it is not surprising to find high water contamination with total coliform caused by agricultural drainage to the surface water and springs.
Of all contaminants in drinking water, human and animal feces present the greatest danger to public health. E. coli are naturally occurring fecal coliforms found in human and animal intestines. While the strain of E. coli known as E. coli 0157:H7, which contaminated the water in Walkerton, Ontario, is very harmful and potentially deadly, most strains of E. coli are relatively harmless. The reason E.coli is relied on so heavily as a measure is that it is a good indicator of the bacteriological safety of drinking water. It is the only species in the coliform group that is exclusively found in the intestinal tract of humans and other warm-blooded animals and it is excreted in large numbers in feces. If E. coli is found in the water, it means that human or animal faces that can harbour a number of other pathogenic, or disease causing, organisms have contaminated the water. The maximum acceptable concentration (MAC) of E. coli in drinking water is zero. If E. coli is detected in drinking water, a boil water advisory is generally issued right away. According to JS and WHO Guidelines, all samples are classified polluted with E. coli. This is due to the human and agricultural activities surrounding Wadi Mujib and the springs.
Water Quality Criteria for different Purposes
The water resources criteria deposit the intended water use such as domestic, irrigation and industrial purposes. The suitability of the water quality for domestic and irrigation purposes will be determined below.
The suitability of the springs' water for domestic purposes was determined by comparing the constituents' concentrations with drinking water standards of Jordan (2001) and WHO Guidelines (1993). Chemically, there is no problem to use the surface water and springs for domestic purposes after mixing with each other. But, biologically, most of the samples were polluted with total coliform and E. coli, so the water should be treated before using for domestic purposes.
Recommendations
- It is important to plan three protection zones around the recharge areas of springs and the surface water of Wadi Mujib and Mujib dam. This will decrease the dangers of pollutants as follows:
- Protection zone 1: Stop irrigation activities in the first 100 m or as the geomorphic conditions of the area requires.
- Protection zone 2: this zone begins at the boundary of zone 1, it is recommended to have 200-500 m (according to the topography) planted by trees using drip supplemental irrigation systems.
- Protection zone 3: this zone begins at the boundary of zone 2, it is recommended to have 500 m (according to the topography) planted by vegetables and fruits using drip irrigation systems.
- Encourage the farmers to use drip irrigation system to save more water and decrease the effects of drainage salt water on the soil surface and springs. This could be applied through establishing a pilot project on drip irrigation systems with the private sector or with NGO’s to assure the efficiency of this system in MNR.
Acknowledgment
The authors would like to express their thanks to the Royal Society for the Conservation of Nature/ Amman for the support of this research.
References
- Clesceri, L. S., Greenberg, A. E. and Trussell, R. R. Standard methods for the examination of water and wastewater. Seventeenth Edition, Washington-USA: American Public Health Association, American Water Works Association and Water Pollution Control (2007).
- Freeze, R. A. and Cherry, J. A. Groundwater. Englewood Cliffs: Prentice-Hall Inc . (1979).
- Jordanian Drinking Water Standards (JS), No. 286, Amman, Jordan (2001).
- Jordan Meteorological Department, Annual Report of the Jordan Meteorological Department, Amman, Jordan (2005).
- JVA Files. Jordan Valley Authority, Amman, Jordan.
- Kölle, W. Wasseranalysen-richtig beurteilt. 315 p, Weinheim: WILEY-VCH Verlag (2003).
- Langguth, H. R., Grundwasser verhaltisse in Bereich des Velberter Sattels Des Minister for Ernhrung, Landwirtschaft and Forsten. PP 52-127, Dusseldorf: NRW (1966).
- Margane, A. and Saunna, N., Proposal for a National Guidline for the Delineation of Groundwater Protection Zones, Technical Cooperation Project ‘Groundwater Resources Management’, Technical Report No. 1, prepared by BGR and MWI, BGR archive no. 0125645, 161 p., Amman (2002).
- Margane, A. and Hobler. M., Groundwater Resources of Northern Jordan, Vol. 3: Structural Features of the Main Hydrogeological Units in Northern Jordan, Technical Cooperation Project ‘Advisory Services to the Water Authority of Jordan’, BGR and WAJ, BGR archive no. 118702: 1-3, 57 p., Amman (1994).
- Margane, A., Borgstedt, A., Subah, A., Hajali, Th., and Hamdan, I., Delineation of Surface Water Protection Zones for the Mujib Dam, Technical Cooperation Project ‘Groundwater Resources Management’, Water Authority of Jordan’, BGR and WAJ, BGR archive no. 0126002: 132 p., Amman (2008).
- Mazor, E., Drever, J. I., Finley, J. and Huntoon, P. W. Hydrochemical implications of groundwater mixing: an Example from the Southern Laramie Basin, Wyoming. Water Resources Research, 29 (1): 193-205 (1993).
- Metcalf and Eddy. Wastewater Engineering: Treatment, Disposal, Reuse. Third Edition, 127 p, US: McGraw-Hill. (1991).
- Piper, A. M. A graphic procedure in the geochemical interpretation of water analyses. Trans. Am. Geophys. Union, 25: 914-928 (1944).
- Samawi, M. and Sabbagh, N. Application of Methods for Analysis of Rainfall Intensity in Areas of Israeli, Jordanian and Palestinian Interest, Jordan Meteorological Department and Ministry of Water and Irrigation, Amman, Jordan (2005).
- Sawyer, C. N., McCarty, P. L. and Parkin, G. F. Chemistry for Environmental Engineering. Fourth Edition, pp 493-515, US: McGraw-Hill (1978).
- Stone, N., M. and Thomforde, H., K.. Understanding your fish pond. Water Analysis Report. University of Arkansas at Pine Bluff, USA (1977).
- Subramania, S. M. Environmental chemistry and analysis. Indian Institute of Technology Madras (1999).
- Water Authority of Jordan Files (WAJ Files). Water Authority of Jordan, Amman-Jordan.
- WHO. World Health Organization Guide Lines, Amman, Jordan (1995).


