Comparative Studies of Physico- Chemical Parameters of two Reservoirs of Narmada River, MP, India
Minu kumari1 * , L.K Mudgal1 and A.K. Singh2
1
Department of Zoology,
Govt. P.G. Girls College Motitabela,
Indore,
452001
M. P
India
2
Department of Animal Reproduction and Gynaecology,
Veterinary College Mhow,
Indore,
M. P
India
DOI: http://dx.doi.org/10.12944/CWE.8.3.18
Copy the following to cite this article:
Kumari M, Mudgal L. K, Singh A. K. Comparative Studies of Physico- Chemical Parameters of two Reservoirs of Narmada River, MP, India. Curr World Environ 2013;8(3) DOI:http://dx.doi.org/10.12944/CWE.8.3.18
Copy the following to cite this URL:
Kumari M, Mudgal L. K, Singh A. K. Comparative Studies of Physico- Chemical Parameters of two Reservoirs of Narmada River, MP, India. Curr World Environ 2013;8(3). Curr World Environ 2013;8(3). Available from: http://www.cwejournal.org/?p=5294
Download article (pdf) Citation Manager Publish History
Select type of program for download
| Endnote EndNote format (Mac & Win) | |
| Reference Manager Ris format (Win only) | |
| Procite Ris format (Win only) | |
| Medlars Format | |
| RefWorks Format RefWorks format (Mac & Win) | |
| BibTex Format BibTex format (Mac & Win) |
Article Publishing History
| Received: | 2013-11-10 |
|---|---|
| Accepted: | 2013-11-28 |
Introduction
Narmada is originated from eastern Madhya Pradesh at Amarkantak (Situated at 20° 40', 80° 45' E), flows towards west and finally joins Arabian sea at Broach (Situated at 21°43', 72° 57' E).Dams, built to change natural flow regimes, are one of the most significant human interventions in the hydrological cycle. The construction of dam’s results in physical, chemical and biological changes to natural ecosystems. The construction of a series of dams in Narmada basin is continuously bringing about changes in microclimate of the region. A free flowing river, when arrested behind dams, is subjected to different ecological dynamics and bio-geo chemical cycles. The reservoirs created behind the dams are different aquatic ecosystems compared to a free flowing river. Reservoirs act as thermal regulators so that seasonal and short-term fluctuations in temperature, that are characteristic of many natural rivers, are regulated. The chemical composition of water released from reservoirs can be significantly different to that of inflows. Changes occur in pH and salinity as well as in the concentration of nutrients The changes caused by dams directly and indirectly influence a myriad of dynamic factors that affect habitat heterogeneity and successional trajectories and, ultimately the ecological integrity of river ecosystems (Ward and Stanford, 1995).
Material and Methods
The present study was conducted at two selected sampling stations viz., Indra Sagar Dam (Punasa) = S1,Omkareshwar Dam (Omkareshwar) = S2 in the Narmada River for the period of one year from January 2012 to December 2012 by taking the samples monthly with a view to assess the nature and degree of pollution. The sampling was done usually in morning hours between 8 a.m. to 11 a.m. and samples were collected from just below the water surface. At each of the station, three types of water samples-first from 200 m upstream, second from the confluence and third from 200 m downstream- were collected, for all physico-chemical analysis.
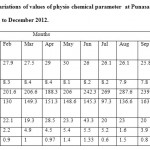 |
Table 1: Monthly variations of values of physio chemical parameter at Punasa Dam (SI) from January 2012 to December 2012. Click here to View table |
In the analysis of the physico- chemical properties of water, standard method prescribed in limnological literature were used. Temperature and pH were determined at the site while total hardness, chlorides, sulphates, BOD and T.D.S. were determined in the laboratory. The physico-chemical parameters were determined adopting methods given by APHA (2002) and Golterman (1991).
Results and Discussion
Temperature
Temperature is one of the most important parameters that influence almost all the physical, chemical and biological properties of water and thus the water chemistry. It never remains constant in rivers due to changing environmental conditions. In present study the temperature of river water ranged between 20.00C – 30.30C (Fig-1). The minimum temperature was recorded in the month of January at S1 and maximum was recorded in the month of July at S2. Maximum values of water temperature were observed in summer season and minimum in winter season. These types of observations, in river Narmada, have also reported by Palharya and Malviya (1988).
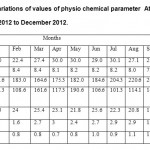 |
Table 2: Monthly variations of values of physio chemical parameter At Omkareshwar Dam (S2) from January 2012 to December 2012. Click here to View table |
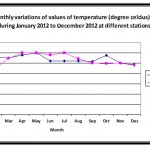 |
Figure 1: Monthly variations of values of temperature (degree celcius) of water during January 2012 to December 2012 at different stations. Click here to View figure |
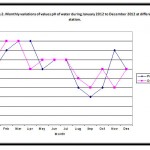 |
Figure 2: Monthly variations of values pH of water during January 2012 to December 2012 at different station. Click here to View figure |
pH value
pH is one of the most important factors in measuring water quality. It indicates the concentration of hydrogen ions. Natural waters generally have been found to range from pH 5.5 to 8.6 because of the presence of bicarbonates and carbonates of alkaline earth metals. The water in river Narmada was always alkaline during the period of present study like most of the other Indian rivers as reported by Mitra (1982). The lowest pH i.e., 7.4 was observed at S2 in the month of April and highest, 8.8 at S2 in January , February and at S1 in November (Fig-2). The similar pH ranges were also recorded by Gautam et al., (2000) in river Ganga at Rishikesh, Sharma et al., (2004) in pond, Verma (2006) in river Narmada.
Total dissolved solids (TDS)
The TDS content of fresh water generally ranges from 10 to 500 mg/lit. The maximum permissible limit of TDS for drinking water is 500 mg/lit. In present study TDS, 136 mg/lit was the lowest value recorded at S2 in May and 360 highest value recorded at S1 in August (Fig-3). Verma (2006) noted that in Narmada water 990 mg/lit TDS was the highest value recorded in August and 123 mg/lit was the lowest value noted in September.
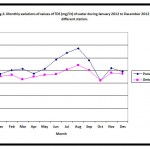 |
Figure 3: Monthly variations of values of TDS (mg/lit) of water during January 2012 to December 2012 at different station. Click here to View figure |
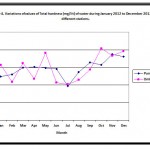 |
Figure 4: Variations of values of Total hardness (mg/lit) of water during January 2012 to December 2012 at different stations. Click here to View figure |
 |
Figure 5: Monthly variations values of Chloride (mg/lit) of water during January 2012 to December 2012 at different stations. Click here to View figure |
Total hardness
In present investigation the lowest value of total hardness 92.0 mg/lit recorded at S1 and S2 both in July and February, March respectively and Highest, 208 mg/lit at S2 in October (Fig- 4). Highest value In post monsoon might be due to settlement of anions and cations. Similar result was also reported by Zahoor et al., (2012).
Chloride
Chloride is one of the major inorganic anion in water and waste water. It is stored in most fresh water algal cells. Contamination of water from domestic sewage can be monitored by chloride essays of the concerned water bodies. In present study the values of chloride varied between 15.30 mg/l to 50.0 mg/l with minimum in September at S2 and Maximum in June at S1 (Fig-5). High values of chloride was seen in summer months. Present summer increases in chloride are in conformity with the earlier observations of Harshey et at., (1982).
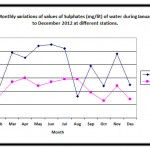 |
Figure 6: Monthly variations of values of Sulphates (mg/lit) of water during January 2012 to December 2012 at different stations. Click here to View figure |
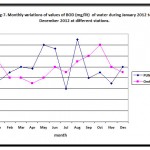 |
Figure 7: Monthly variations of values of BOD (mg/lit) of water during January 2012 to December 2012 at different stations. Click here to View figure |
Sulphate
The sulphate ion, SO4- is usually second to carbonate as the principal anion in freshwaters, although chloride sometimes surpasses it. Atmospheric sources of sulphate have increased with man’s industrial activities. Man now contributes about ten times more SO2 than the annual contribution from volcanoes. In present study the values of sulphate varied between 0.43 mg/l to 7.1 mg/l with minimum in October at S2 and Maximum in April at S2 (Fig-6).This finding matched with observation of Verma (2006) in Narmada River.
Biological oxygen demand (BOD)
The biochemical oxygen demand, abbreviated as BOD, is a test for measuring the amount of biodegradable organic material present in a sample of water. The acceptable BOD level in the raw water meant for treatment is 3 mg/lit while more than 2 mg/lit BOD indicated the non suitability of river water for domestic use as per Indian standards. In the present investigation the BOD was very low, 0.40 mg/lit, at S1 in November and was high, 2.14 mg/lit at S2 in May (Fig-7). In the present study usually the BOD values were obtained maximum in summer months at all sampling stations, which might be due to high temperature, this intern promotes microbial activities and minimum BOD values obtained in winter might be due to low temperature and sufficient amount of water in the river. Similar observations were confirmed by many other workers such as Pathak and Mudgal (2005).
References
- APHA., Standard method for examination of water and waste water, American Public Health Association Inc., 2002; New York 22nd Ed.
- Gautam A., Khanna, D. R. and Sarkar, P., Diurnal variation in the physico-chemical characteristics of the Ganga water at Rishikesh during winter season. Indian J. Environ & Ecoplan., 2000; 3(2) : 369-371.
- Golterman, H. L., Physiological limnology: an approach to the physiology of lake ecosystem. Elsvier Scientific Publication Comp. Amsterdam. Oxford, New York, 1991; 249- 277.
- Harshey, D.K., Patil, S.G. and Singh, D.F., Limnological studies on a tropical fresh water fish tank of Jabalpur. Indian I. The abiotic factors. Geobios new Reports, 1982; 1(2): 98-102.
- Mitra, A.K., Chemical characteristics of surface water at selected gauging stations in the river Godavari, Krishna and Tungabhadra, Ind. J. Environ. Hlth., 1982; 24(3): 165-179.
- Palharya J.P. and Malviya, S., Pollution of the river Narmada at Hoshangabad in Madhya Pradesh and suggested measures for control. In Ecology and Pollution of Indian rivers. (Ed. R.K. Trivedy), Asian Publishing House, New Delhi, 1988; pp. 54-85.
- Pathak, S.K. and Mudgal, L.K., Biodiversity of zooplankton of Virla reservoir, Khargone (M.P.) India, 2004; P. 317-321. In : Arvind Kumar (ed.) Biodiversity and Environment. A.P.H. Publishing Corporation ,New Delhi.
- Sharma, A., Mudgal, L. K. Sharma, A. and Sharma, S., Fish diversity of Yashwant sagar Reservoir Indore M. P. Him J. environ. zoology. 2004; 18(2) 117-119pp.
- Verma, D.,. Studies of water pollution of the river Narmada in western zone. Ph. D. Thesis, Devi Ahilya Vishwavidyalaya, Indore (M.P.) India, 2006; pp. 1-137.
- Ward, J.V. and Stanford, J.A.,. Ecological connectivity in alluvial river ecosystems and its disruption by flow regulation. Regulated Rivers: Research and Management, 1995; 11, 105-119.
- Zahoor, P., Sharma, S. Tali, I. Siddique, A. and Mudgal. L. K., . Evaluation of Physico- chemical parameters of Narmada river, MP, India. Researcher2012; 4 (5).


