Air Pollution Estimation from Traffic Flows in Tehran Highways
Keivan Saeb1 * , Maryam Malekzadeh1 and Saeed Kardar2
1
Department of Environment,
Tonekabon Branch,
Islamic Azad University,
Tonekabon
Iran
2
Department of Environment,
Damavand Branch,
Islamic Azad University,
Damavand
Iran
DOI: http://dx.doi.org/10.12944/CWE.7.1.01
Urban areas confront with increases in air pollution because of increasing urbanization, expanding the use of vehicles and development of economic activities. In this research carbon monoxide concentration as a pollutant analyzed and modeled within highways in Tehran. In this regards factors affecting the concentration of atmospheric pollutants analyzed on the basis of geometric, atmospheric and traffic data at five stations in Tehran and finally models runs based on existing methods. The model predictions results are match well with field data.
Copy the following to cite this article:
Saeb K, Malekzadeh M, Kardar S. Air Pollution Estimation from Traffic Flows in Tehran Highways. Curr World Environ 2012;7(1):01-06 DOI:http://dx.doi.org/10.12944/CWE.7.1.01
Copy the following to cite this URL:
Saeb K, Malekzadeh M, Kardar S. Air Pollution Estimation from Traffic Flows in Tehran Highways. Curr World Environ 2012:7(1);01-06. Available from: http://www.cwejournal.org?p=346/
Download article (pdf) Citation Manager Publish History
Select type of program for download
| Endnote EndNote format (Mac & Win) | |
| Reference Manager Ris format (Win only) | |
| Procite Ris format (Win only) | |
| Medlars Format | |
| RefWorks Format RefWorks format (Mac & Win) | |
| BibTex Format BibTex format (Mac & Win) |
Article Publishing History
| Received: | 2012-01-01 |
|---|---|
| Accepted: | 2012-02-19 |
Introduction
Motor vehicles emit nitrogen oxides (NOx), carbon monoxide (CO), volatile organic compounds (VOC) and particulate matter (PM), which constitute a major source of air pollution in large cities. To achieve sustainable development and a sustainable transport we need a tool to evaluate projects related to transportation, with good accuracy and in numerical form. With increasing traffic and the increases in pollutants, Human will be in risk from environmental issues that impacts of that on physical health, psychological and economic losses are evident. Heavy traffic in large cities by thousands of car passage has increased the air pollution. Today, air pollution is one of the main human issues and become more important each day. In Iran, according to land use, topography, traffic behavior, and traffic it is a very important problem.
To identify and fix this problem in urban streets, factors such as computation of pollutants level and their compatibility with standards are important and finally set up the executive works to reduce air pollution, are effective steps is to resolve this problem. To achieve environmental goals, and determine the environmental issues for planners, environmental impact studies in traffic management plans and in the road design is considered and the purpose is to determine the transportation request in condition that the negative environmental effects of that not be more than standards. Analysis of carbon monoxide pollution levels in places where traffic is the main source of air pollution is selected as the main target of research.
It must be mentioned that the issue of air quality is essential in urban design and planning urban transportation. Although these analysis is not only limits to predict concentrations of pollutants caused by traffic in urban streets but it is so important in these areas because this problem is more significant in urban streets.
In summary, in this study the effective factors on concentration of pollutants in the atmosphere surveyed in the vicinity of highways of Tehran, near the surface and sidewalk based on field data in 32 points on 5 stations. Calculations have been done in short-term (one hour) and usual traffic conditions in these areas.
The final purpose of the research is to provide a model for estimation carbon monoxide concentration in urban highways with good accuracy and set the acceptable amount of traffic and other features in the system by investigate the causes of these pollutants and prediction of that.
Literature Review
Understanding the characteristics of the air flows besides and upper of streets is necessary for understanding the transmission and distribution performance of pollutants in urban highways. There are three main methods for this problem: all dimensions measurement, reduce field measurements by using of physical models and mathematical models.1
Many studies about the Highways confirm that the vortex flow in the streets will expand when the wind that blows in roof surface is perpendicular to the direction of the wind spread. The result of this vortex flow is transmission of the pollutants in upstream and in the direction of the wind and then transfer it back to the wind and finally increasing the pollutants levels in the back side of wind.2
Jacko et al., Study the transmission parameters of a point pollutant source at the center of town using a wind tunnel model. They found that with increasing two times in average height of building, buildings with equal density, the concentration of pollutants at ground level in urban areas will double too. There are accurate studies about measurements of the wind profile in real urban highway by Oke & Nunez in 1977, Sheih in 1986, and Nakamura in 1988. Generally, these studies show a form of a vortex in street, but this cannot be true in all cases (especially at low wind speeds). Physically, studies of the wind tunnel model are simpler from study of all dimensions from the viewpoint of guidance and control. However inaccurate boundary conditions and incorrect scaling may cause errors. Studies of Hoydysh in 1988 and 1991 show the pollutants concentration pattern depends on the path symmetry and apparent ratio of the block size. And concentration of pollutants in the vertical direction is reduced exponentially. Also the concentration of pollutants is more in the back of wind toward the face of wind.3
Numerical models used for the issue of urban highways can be in several forms: some of them simulate the fluid flow and contaminant transmission and some are empirical models based on observational data. Advances in computer hardware technology have provided new opportunities for the simulation of environmental aspects.
Johnson et al.,, in 1990 and Shuzo et al.,, in 1992 investigate the wind flow as the fluid in urban highways and approved a number of wind tunnel results, such as the wind vortex rotation when the roof-level wind flow is perpendicular to street.3
In 1973 Johnson et al.,, made an empirical model based on observed data in all dimensions in the State of California. The model predicates the decrease of concentration from a linear source against the wind and linear decreases of concentration toward height level on the opposite side of the wind. They found that the wind direction in roof-level controls the levels of CO concentration pattern. Concentration of CO near the street surface in the backside of wind is significantly higher toward the opposite side.4
Lin and Niemeier (1998) used observed traffic data to estimate hourly allocation factors and disaggregated traffic volume into hourly values. These indirect methods inevitably lead to inaccuracies in emission modeling. In theory, numerical modeling of traffic flow on road can provide every detail required for the calculation of traffic emissions. Unfortunately, previous efforts failed to do this because of road network complexity.5
L. Xia, Y. Shao (2005) used a Lagrangian traffic flow model. According to their study the traffic flow model is simple, but has been found to be quite efficient. With the specification of travel behavior, their model was capable of simulating traffic flow on a road network. The model applied successfully to Hong Kong Island. The simulated traffic flows in three cross-harbour tunnels and at three counting stations on the island for weekdays and weekends were compared with observations. The temporal variations of traffic flow in the cross-harbour tunnels and at the counting stations were reproduced by the model at satisfactory level.6
Methods
There are three appropriate methods for study of factors affecting the traffic pollutants levels
- Developing the two-stage models (diffusion - distribution) that Distribution mechanism simulates with the Navier-Stokes equations and appropriate boundary conditions are considered (numerical modeling).
- Developing experimental models based on wind tunnel and field observations (simulation wind tunnel using a small-scale model).
- Developing empirical models based on true understanding of all factors influencing the concentration of pollutants and also the data collected at different sites with a wide range of traffic and atmospheric conditions.
Methods 1 and 2 require accurate models to predict emission rates of pollutions based on traffic parameters. Because there is not prepared accurate diffusion models in Iran, two stages modeling is not applicable. Furthermore accurate measurements of parameters in emission models is complicated and requires high cost. Also comparison of laboratory data and field data is difficult and using wind tunnel simulation models requires extensive laboratory facilities.
According to the purpose of this study and the available facilities the first and second methods are not recognized suitable. Therefore the third method that apply the effective factors and field data are used and relationships between geometric, atmospheric and traffic conditions are analyzed.
This method has advantages over other methods as follows7
- Because analyzing the levels of pollutants and effective parameters are with each others, expanding the relations based on equal weights in the distribution and emission becomes possible.
- In terms of costs these models that based on field observations are the best option.
- Empirical relationships are simple and not required powerful computer to estimate concentrations of pollutants for purposes of transportation planning.
- When empirical relationships for evaluating and selecting transportation projects are used less input data are require to other modeling methods. Also these data are available in the planning of transportation and are easily accessible. Furthermore the experimental models run just with a small part of inputs that the two-stage models are required.
 |
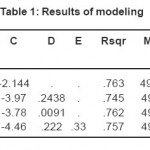
Table 1: Results of modeling Click here to View table |
 |
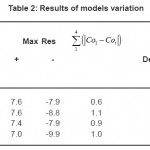
Table 2: Results of models variation Click here to View table |
Data Collecting
Generally the factors affect the pollution concentration in urban highways are divided into four groups.
- Traffic parameters
- Geometric design
- Atmospheric condition
- Surroundings (background) concentration
There are define methods for measurement in methods 1 through 3 and there is general agreement about their digitizing. But surroundings concentration seems to be some complicated. The surroundings concentrations are the amount of pollutant that exists in the air without traffic there. Distribution of residential and industrial areas near the areas under study will impact of this issue7.
 |
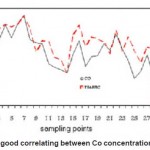
Figure 1: Positive and good correlating between Co concentration and hourly traffic Click here to View Figure |
 |
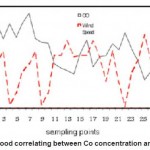
Figure 2: Negative and good correlating between Co concentration and wind normal speed Click here to View Figure |
About the first three methods there are distinct measurements methods and general agreement to digitize it. But the Surrounding concentrations seem to be some complex. The background concentrations are the pollutants that exist in the air without traffic condition. Distribution of residential and industrial areas near the areas under study, affects this issue.7
The main focus of this research will be on the first three groups of variables because the reason as follow:
- First, traffic is effective in pollution concentration on the ground surface and near the urban streets and at low altitude areas.
- Second, it is due to studies about the role of traffic in the concentration of CO in Tehran City. According to studies, more than 90% of the CO gas production is arising from transportation in Tehran.
- The third reason is related to the stations selection. It is tried that the selected station be in commercial and residential areas, and away from industrial areas that produce CO gas.
The main problem with field data in this study is requirement of taking the traffic, air pollution and the atmospheric data in the same time.
The locations of existing measurement stations of “Tehran air pollution control” and “environmental protection organization” have been checked first. Because more of existing stations were besides the crossroad and squares and some others were set in wide area generally there were no suitable stations that show the pollution conditions of urban streets.
So used from portable samples. Furthermore portable samplings have some advantages because some parameters like station situation and the height level of samples are controllable. High amount of traffic and highways condition takes into consider in sampling as well as the other foresaid important conditions. Therefore Modares and Resalat highways selected for data measurement.
Geometric Variables
Geometric variables in stations were measured in three dimensions: elevation, longitudinal and transverse. Data measurements have taken at adjacent stations in different parts of the two highways. Geometric variables in these stations are very close together, so the main focus is on the relationship between pollution levels, traffic parameters and meteorological conditions.
Meteorological Variables
In this study three variables analyzed that includes: wind speed, wind direction and environment temperature. This information has been taken from meteorological stations of Resalat highway. Meteorological variables at different hours and days of the week were existed and in which time the data are collected the desired meteorological data is extracted too.
Model Development
In order to develop a model to predict and estimate well, firstly correlated pairs of variables were analyzed. Based on this analysis, traffic volume and wind normal speeds were identified as the most effective variables. Figures (1) and (2) shows the correlation between these variables and hourly concentrations of carbon monoxide. Correlation between traffic volume and the carbon monoxide concentration is + 0.814 and between the wind normal speed and the concentration of carbon monoxide is -0.655.
The calibration of the previous models shows good agreement for SRI and Crompton & Gilbert models. In this stage through the following analysis and using SPSS software four combine forms were define and calibrated.
CO=\frac{A.Traffic}{(W.Sin α + B)}\+ C.W.Sin α

Traffic : the rate of traffic (vehicles of hours) W.Sinα: wind normal speed (m/s)
Wt: total road width (m)
Temp: temperature
To select the final model the ability of models checked. As it can be seen from table (1) and (2) model No.1 suggested as the best models according to prediction ability and computational error.
Conclusion
In order to determine a viable method for quantifying the contribution of traffic emission to regional air quality, all methods analyzed and according to the analyses developing empirical models that apply the effective factors and field data has advantages over other methods. The correlation between the variables and hourly concentrations of carbon monoxide shows that the main parameters influencing the distribution of carbon monoxide concentration in the city streets are traffic volumes and normal speed and the study shows that the calibrated models SRI and Crompton & Gilbert are good in existing traffic, geometric and atmospheric conditions of Tehran. In addition four integrated traffic emission model developed and good agreement has been found between them and field data therefore can accurately predict carbon monoxide concentrations due to traffic and atmospheric conditions of Tehran. Finally the study shows that these models have good ability and can be use as a technique by traffic managers to reduce air pollution in polluted cities in Iran, to control the volume of traffic with environmental standards.
References
- Environmental Protection Agency, Appendix W to part 51 – Guideline on Air Quality Models (1995).
- Shiran, G. R. “Area–Wide Environmental Capacity Based on Air Pollution Criteria, Ph.D. Thesis , University of New South Wales, Sydney , Australia (1997).
- A.A.Hassan and J.M.Crowther, Modeling of fluid flow and pollutant dispersion in a street canyon, Environmental Monitoring and Assessment 52: pp 281-297 (1998).
- C.M.N Riain, B.Fisher, C.J.Martin, and J.Littler, Flow field and dispersion in a central London street, Environmental Monitoring and Assessment 52: 299-314 (1998).
- Lin, K., Niemeier, D., Using multivariate multiple regression models to improve the link between air quality and travel demand models. Transportation Research 3(6), 375– 387 (1998).
- L. Xia, Y. Shao, Modeling of traffic flow and air pollution emission with application to Hong Kong Island, Environmental Modeling & Software 20: 1175-1188 (2005).
- Linaritakis, Factors affecting traffic – related air pollutant levels in urban streets, Ph.D. Thesis, University of London, United Kingdom (1987).


