Low-cost Ozone Measurement Device in the Chappuis Band
1
Department of Computer Science and Engineering,
Govt. College of Engineering and Ceramic Technology (Autonomous),
Kolkata,
West Bengal
India
2
Department of Basic Science and Engineering,
Govt. College of Engineering and Ceramic Technology(Autonomous),
Kolkata,
West Bengal
India
Corresponding author Email: pal_bimal@yahoo.com
DOI: http://dx.doi.org/10.12944/CWE.19.3.27
Copy the following to cite this article:
Pal B, Chakrabarty K. Low-cost Ozone Measurement Device in the Chappuis Band. Curr World Environ 2024;19(3). DOI:http://dx.doi.org/10.12944/CWE.19.3.27
Copy the following to cite this URL:
Pal B, Chakrabarty K. Low-cost Ozone Measurement Device in the Chappuis Band. Curr World Environ 2024;19(3).
Download article (pdf)
Citation Manager
Publish History
Select type of program for download
| Endnote EndNote format (Mac & Win) | |
| Reference Manager Ris format (Win only) | |
| Procite Ris format (Win only) | |
| Medlars Format | |
| RefWorks Format RefWorks format (Mac & Win) | |
| BibTex Format BibTex format (Mac & Win) |
Article Publishing History
| Received: | 2024-09-02 |
|---|---|
| Accepted: | 2024-12-07 |
| Reviewed by: | 
 Sagar Marathe
|
| Second Review by: |

 Shahenaz Mulla
|
| Final Approval by: | Dr. R K Aggarwal |
Introduction
Ozone in Atmosphere
Ground level ozone concentration is detected in the atmosphere in varying amounts. Ozone concentration in nature varies with season, altitude, etc.1 Lightning and sunlight also create ozone in nature by breaking oxygen molecules. Naturally, a very small amount of ozone is created in the atmosphere. A significant amount of man-made ozone is created in the lower level of atmosphere due to various processes. Increased ozone concentration in the atmosphere affects our nervous system, lungs, eyes, nose, throat, skin, etc.2 Ozone can also affect DNA’s normal structure. As per guidelines of the World Health Organization (WHO), the safe limit of ozone concentration in the atmosphere is 100 ug/m3 as the maximum daily 8-hour mean and 60 ug/m3 in the peak season (average of daily maximum 8-hour mean concentration in the six consecutive months with the highest six-month running average O3 concentration).3
Historical Overview
Ozone gas was first identified by the German Scientist C.F. Schönbein in 1867 in the atmosphere.4 Oxford University Professor, G.M.B. Dobson made a Photographic Spectrometer in 1926 and later on, with the availability of electronic components, Professor Dobson made standard Spectrophotometers using the photomultiplier tube at the detector stage for the measurement of ozone in 1931.5,6 Dobson Spectrophotometer uses two different UV wavelengths of light. The shorter wavelength of light is absorbed more than the longer wavelength of light by the ozone molecules. Due to this dissimilar absorption, two light beams of varying intensity are generated and fall on a photomultiplier tube alternately. By computing the difference in intensity of two light beams, the concentration of ozone is calculated.7 The World Meteorological Organization still uses the Dobson Spectrophotometer by incorporating additional features. Nowadays, Dobson Spectrophotometers have been automated for the measurement of concentration of atmospheric ozone.8 Alan Brewer who was an associate of Dobson also developed Spectrophotometer in 1982 to monitor the concentration of ozone in the atmosphere.9 The Brewer Spectrophotometer was upgraded to measure U.V. Radiation and there are various versions of the Brewer Spectrophotometer like Mark-II, Mark-III, Mark-IV, Mark-V, etc. The Dobson and Brewer Instruments are used at various stations throughout the world for the measurement of ozone concentration in the atmosphere.
Measurement Technologies
Molecules can absorb light energy of specific wavelengths when the light passes through the target molecules of the species. Different species absorb photon energy at different wavelengths and also may absorb several wavelengths from the UV to IR regions.10 An ozone molecule has three oxygen atoms and the molecular weight of the ozone molecule is 47.9982 g/mol. Atoms have strong and sharp energy levels but the molecules have widespread energy levels and these widespread energy levels belong from the UV regions to the IR regions.11 Scientists and researchers have shown that ozone molecules absorb light energy from 200 nm to 1100 nm wavelength region.12 These wavelength regions are called the Hartley Band, Huggins Band, Chappuis Band, and Wulf Band respectively.
James Chappuis in 1880 stated that ozone absorbed light in the visible range from 515 nm to 650 nm and within this absorption region there were two maxima at 575 nm and 603 nm wavelengths.13,14 This absorption band in the visible range is the weak absorption band of ozone but is safe for human health.
W. N. Hartley in 1881 stated that ozone had a strong absorption band in the UVC region from 233 nm to 285 nm wavelength and the strongest absorption occurred at 256 nm wavelength.15,16 Later on, scientists and researchers established that the strongest absorption of ozone occurred at 253.65 nm wavelength. This absorption band of ozone at 253.65 nm is harmful to living organisms as well as detrimental to non-living things. To generate a light source at about 253.65 nm wavelength, usually mercury lamps are used whose life span is less than the life span of LED. The photodetectors used for the measurement of 254 nm wavelength of light are costly and are not easily available. The wavelength region of the Huggins band belongs to the UVB-UVA region and is approximately 300 nm to 350 nm wavelength. The wavelength region of the Wulf band belongs to the IR region and its range is beyond 700 nm wavelength.17 The concentration of ozone can be measured according to the light absorption capacity of ozone of specific wavelength and Beer-Lambert Law can be implemented for this purpose.
There are also other methods like the Electrochemical method and Metal Oxide Semiconductor method to measure the concentration of atmospheric ozone.18 In the Electrochemical method, an electrochemical sensor interacts with the surrounding ozone gas, and according to the strength of the surrounding ozone gas, the output of the sensor changes. The disadvantage of the electrochemical method is that the life span of sensor used is limited to 1 year to 2 years. In the Metal Oxide Semiconductor method, when the heated metal oxide surface reacts with the surrounding ozone gas, its sensitivity changes.19,20 The disadvantage of the Metal Oxide Semiconductor-based method is its high power consumption and long warm-up time. The aim of this research is to develop an indigenous cost-effective ozone measuring device based on absorption of visible light using easily available components. In this research low cost visible range LED has been used to generate light source whose life span is long. The absorption of visible light is detected at the other end of the gas measurement chamber with the help of a visible range photodiode and concentration of ozone can be calculated using Beer-Lambert Law. These ozone measuring devices can be used individually in personal capacity and cost will be a few thousand only. In real world scenarios the imported equipment is used in Environment Monitoring Stations. The size of the equipment is also large and cost is many millions of rupees.
Materials and Methods
Adopted for the Experiments
Materials
The ozone measurement chamber is built with a 21 mm diameter and 25 cm long aluminum tube. Aluminum tube has been used here since aluminum is soft and easy to process. The 21 mm diameter aluminum tube is chosen to match with the available 21 mm diameter plano convex lens required for the experiment.
Major Components
The basic electronic components used are LEDs and photodiodes. The photodiodes are encapsulated in a separate small tube to fix properly with the set-up for the measurement of light intensity. The 12 Volt air pumping motor is used for the air flow inside the gas measurement chamber. The air flow rate inside the gas chamber is 2L/minute.
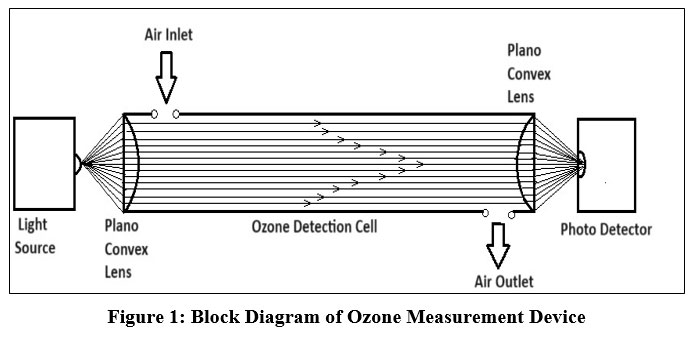 | Figure 1: Block Diagram of Ozone Measurement Device
|
Brief Description of the Block Diagram
Light Source
Here the light of visible range wavelength is generated from the LED for the purpose of propagation through the ozone measurement cell.
Plano Convex Lens
The left side plano convex lens has been used to make radiated light parallel and pass through the maximum ozone molecules. The right side plano convex lens has been used to make radiated light concentrate to a point at the other end of the ozone measurement cell. The reduced intensity of the concentrated light is measured by a photodiode.
Ozone Detection Cell
Atmospheric air passes through the ozone detection cell which is also described as ozone measurement chamber. The ozone detection cell is made up of aluminum tube and depending upon the concentration of ozone molecules in the ozone detection cell, the radiated visible light will be absorbed in the ozone detection cell.
Photodetector
Here photodiode whose peak sensitivity is near the wavelength of generated light source is used. The photodiode is fixed at the other end of the ozone gas detection cell to measure the intensity of radiated light.
Experimental Procedure
The length of aluminum tube has been chosen as 25 cm. In Beer-Lambert Law, ? is constant and the concentration of ozone [ c =
The accuracy of experimental result of these experiments mainly depends upon:
The generation of visible light source of required wavelength and intensity.
The absorption cross section of ozone molecules to a specific wavelength of light.
The proper measurement of reduced light at the other end of the experimental set-up by using a photodetector whose peak sensitivity is near the wavelength of generated light source.
Here the investigation has been carried out to determine the concentration of ozone using Green, Yellow-Green, Yellow, Amber, and Orange LEDs as the incident light sources. The Yellow-Green LED used in this experiment has 573 nm dominant wavelength. Yellow LED usually generates 589 nm dominant wavelength and Amber LED usually generates 595 nm dominant wavelength and Orange LED generates 605 nm dominant wavelength. The molecules absorb light of specific wavelengths and the extent of absorption depends upon the absorption cross section per molecule.21,22 The strongest absorption cross-section of ozone (per molecule) occurs in the UVC range at 253.65 nm wavelength and in the visible range, the amount of absorption cross-section of ozone at 603 nm wavelength becomes more than the absorption cross-section of ozone at 575 nm. So, the design of a low-cost device for the detection of ozone in the visible range of light depends upon the light source of 603 nm wavelength as well as the photodetector whose wavelength of peak sensitivity is 603 nm. The photodetector of the peak sensitivity wavelength 565 nm (BPW21R) and 580 nm (VTB 8440BH) is available and here experiments have been conducted using 565 nm 580 nm peak sensitivity photodiode. The range of spectral bandwidth of BPW21R photodiode is 420 nm to 675 nm and highest sensitivity occurs at 565 nm. The range of spectral bandwidth of VTB 8440BH photodiode is 330 nm to 720 nm and highest sensitivity occurs at 580 nm. In a photodiode the incident light of specific wavelength falls on the window of the photodiode, then photodiode absorbs incident light and generates electron-hole pair. The specific wavelength region is determined by the absorption coefficient of the semiconductor. The measurement accuracy enhances when the wavelength of the incoming light approaches the peak sensitivity wavelength of the photodiodes.
In the experiment, the incident light source from the LED passes through the 25 cm long aluminum tube and at the end of the aluminum tube, a photodiode is placed to measure the intensity of light. For the measurement of the concentration of ozone, Beer-Lambert Law has been used.23,24 The Beer-Lambert Law is
![]()
Here I0 is the initial intensity of light, I is the reduced intensity of light, ? is the absorption cross-section of gas, l is the optical path length of the cell and c is the concentration of gas.

0 is the absorption cross section of gas and its value is constant. The concentration of atmospheric ozone level is in the ug/m3 or in the parts per billion (ppb) range. In this experiment the value ? has been taken as 1.15 * 10 -17 cm2/molecule and the optical path length in this experiment l is 25 cm.

The average value of I and I0 has been calculated from morning 7.30 A.M to night 11.30 P.M and after averaging, the hourly value of ozone concentration has been calculated.
Results
The experimental data obtained on 3rd May 2024 inside a residential building at Center Sinthi of North Kolkata is shown in Table 1. To measure indoor ozone concentration, 10 mm diffused yellow LED and 10 mm DIP yellow LED have been used with 565 nm (BPW 21R) peak sensitivity photodiode.
National Ambient Air Quality Standards has prescribed that for 8 hours sampling the average value of ozone should be within 100 ug/m3 and for 1 hour sampling the average value of ozone should be within 180 ug/m3.
Table 1: Experimental data dated 03 May 2024
Indoor Ozone Concentration values at Center Sinthi of North Kolkata on 03 May 2024 (values in ug/m3) | ||
Time | 10 mm Diffused Yellow LED | 10 mm DIP Yellow LED |
8.00 | 64.09 | 38.41 |
9.00 | 73.15 | 40.31 |
10.00 | 77.50 | 41.80 |
11.00 | 80.56 | 42.55 |
12.00 | 82.93 | 43.29 |
13.00 | 84.79 | 44.47 |
14.00 | 86.09 | 45.40 |
15.00 | 87.76 | 46.31 |
16.00 | 88.34 | 46.33 |
17.00 | 88.14 | 45.97 |
18.00 | 87.94 | 45.71 |
19.00 | 85.35 | 43.68 |
20.00 | 83.38 | 42.11 |
21.00 | 81.05 | 40.24 |
22.00 | 79.17 | 39.34 |
23.00 | 78.35 | 39.13 |
Two waveforms from the initial experiment carried out at Center Sinthi of North Kolkata dated 03 May 2024 have been shown in Fig. 2. It is found that the two waveforms have almost same nature. The minor difference in nature is due to different category of LEDs. The difference in amplitude can be adjusted by changing the resistances used in the biasing of LED and Photodiode. In the experimental set-up variable resistance has been used with the cathode of the LED and by varying this resistance, the intensity of the generated light source can be varied. Depending upon the intensity of this light source output amplitude of the photodiode will vary. Output amplitude of the photodiode will also vary depending upon the value of the resistance used with the cathode of the photodiode. Here the photodiode has been used in the reverse biased mode. So, the amplitude scale of the two waveforms can be adjusted during the calibration of the set-up but the nature of the waveform will remain same.
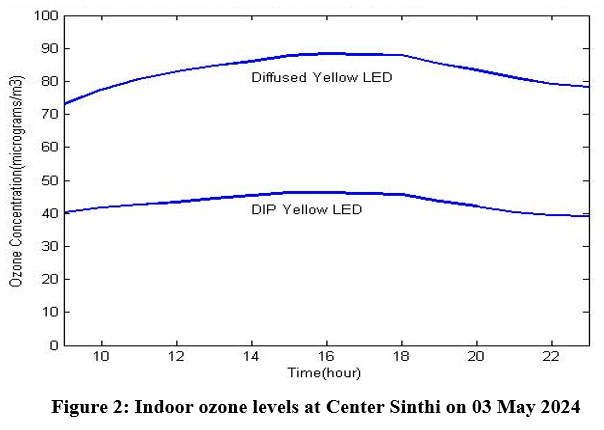 | Figure 2: Indoor ozone levels at Center Sinthi on 03 May 2024
|
The other investigation was done by the Experimental Setup using 5 mm 573 nm yellow-green LED with 565 nm peak sensitivity photodiode (BPW 21R) dated 31 May 2024 at Center Sinthi of North Kolkata. The ozone values have been measured inside the building. The experimental data are shown in Table 2.
Table 2: Experimental data dated 31 May 2024
Indoor Ozone Concentration values at Center Sinthi of North Kolkata on 31 May 2024 (values in ug/m3) | |
Time | 5 mm 573 nm yellow-green LED |
8.00 | 53.80 |
9.00 | 54.03 |
10.00 | 55.25 |
11.00 | 57.76 |
12.00 | 59.02 |
13.00 | 54.23 |
14.00 | 50.03 |
15.00 | 48.27 |
16.00 | 50.25 |
17.00 | 53.18 |
18.00 | 54.75 |
19.00 | 52.89 |
20.00 | 48.77 |
21.00 | 48.71 |
22.00 | 49.18 |
23.00 | 45.46 |
The indoor ozone levels from the experimental data of 5 mm 573 nm yellow-green LED have been shown in Fig. 3. The experiment was done inside a building at Center Sinthi of North Kolkata dated 31 May 2024.
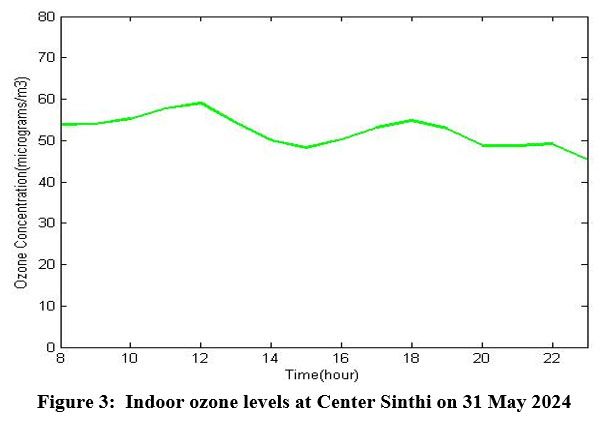 | Figure 3: Indoor ozone levels at Center Sinthi on 31 May 2024
|
The another investigation was done by the experimental set-up using 5 mm 589 nm yellow LED, 5 mm amber LED, and 3 mm 605 nm orange LED with 580 nm peak sensitivity photodiode (VTB 8440BH) inside a building at Center Sinthi of North Kolkata dated 14 June 2024. The experimental data are shown in Table 3.
Table 3: Experimental data dated 14 June 2024
Indoor Ozone Concentration values at Center Sinthi of North Kolkata dated 14 June 2024 (values in ug/m3) | |||
Time | 5 mm Yellow LED | 5 mm Amber LED | 3 mm Orange LED |
8.00 | 55.22 | 58.02 | 63.29 |
9.00 | 57.63 | 62.24 | 64.04 |
10.00 | 60.49 | 64.61 | 65.10 |
11.00 | 64.95 | 68.29 | 66.21 |
12.00 | 67.79 | 70.99 | 67.15 |
13.00 | 70.79 | 73.30 | 68.27 |
14.00 | 73.26 | 75.37 | 69.45 |
15.00 | 74.03 | 76.40 | 70.27 |
16.00 | 73.10 | 76.19 | 70.52 |
17.00 | 72.22 | 75.78 | 69.98 |
18.00 | 71.90 | 75.57 | 69.59 |
19.00 | 72.50 | 75.82 | 69.27 |
20.00 | 72.42 | 75.45 | 69.38 |
21.00 | 71.90 | 74.92 | 69.31 |
22.00 | 73.26 | 75.20 | 69.55 |
23.00 | 74.55 | 75.94 | 70.09 |
The indoor ozone levels from the experimental data of 5 mm 589 nm yellow LED, 5 mm amber LED, and 3 mm 605 nm orange LED have been shown in Fig. 4. The experiment was done inside a building at Center Sinthi of North Kolkata dated 14 June 2024. It is found that there is a major deviation of waveform of the orange LED. The reason is the non availability of required photodiode and the photodiode used here does not match with the wavelength of orange LED.
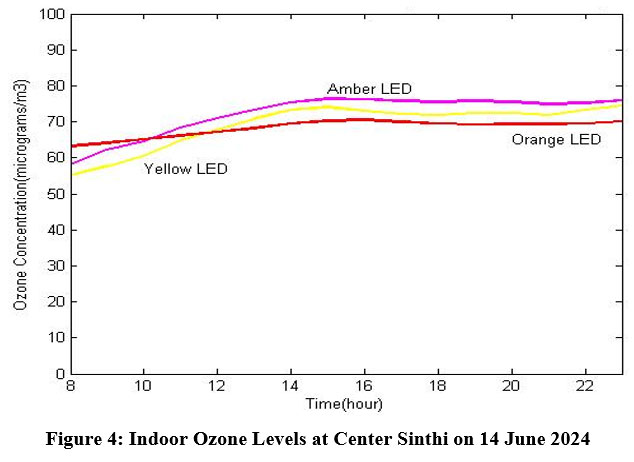 | Figure 4: Indoor Ozone Levels at Center Sinthi on 14 June 2024
|
Here mean value of concentration of 5 mm yellow LED is 69.125625 and standard deviation is 6.1792502. The mean value of concentration of 5 mm amber LED is 72.130625 and standard deviation is 5.7596441.
Further investigation has been carried out to measure indoor ozone by the experimental set-up using 10 mm diffused yellow LED and 10 mm DIP yellow LED with 580 nm peak sensitivity photodiode (VTB 8440BH) inside a building at Center Sinthi of North Kolkata dated 20 June 2024. The experimental data are shown in Table 4.
Table 4: Experimental data dated 20 June 2024
Indoor Ozone Concentration values at Center Sinthi of North Kolkata dated 20 June 2024 (values in ug/m3) | ||
Time | 10 mm Diffused Yellow LED | 10 mm DIP Yellow LED |
8.00 | 54.88 | 53.33 |
9.00 | 63.79 | 58.19 |
10.00 | 63.33 | 55.38 |
11.00 | 63.45 | 54.69 |
12.00 | 67.09 | 56.77 |
13.00 | 71.56 | 59.47 |
14.00 | 72.19 | 58.17 |
15.00 | 66.13 | 53.36 |
16.00 | 63.79 | 53.88 |
17.00 | 58.87 | 51.45 |
18.00 | 63.64 | 53.72 |
19.00 | 59.89 | 50.71 |
20.00 | 61.02 | 51.65 |
21.00 | 64.85 | 52.56 |
22.00 | 67.29 | 52.79 |
23.00 | 68.99 | 51.97 |
The indoor ozone levels from the experimental data of 10 mm Diffused and DIP yellow LED dated 20 June 2024 have been shown in Fig. 5. The experiment was done inside a building at Center Sinthi of North Kolkata dated 20 June 2024. The indoor ozone concentration was initially measured on 3rd May 2024 by using photodiode of 565 nm peak sensitivity wavelength (BPW 21R) and in the experiment done on 20 June 2024, photodiode of 580 nm peak sensitivity wavelength (VTB 8440BH) has been used.
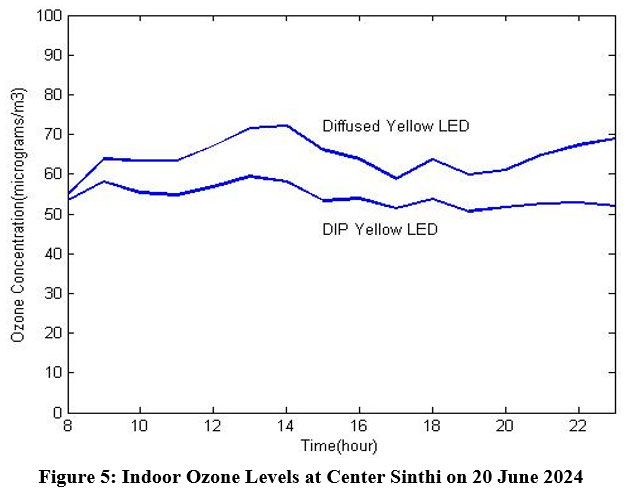 | Figure 5: Indoor Ozone Levels at Center Sinthi on 20 June 2024
|
Here mean value of concentration of 10 mm diffused yellow LED is 64.4225 and standard deviation is 4.5323. The mean value of concentration of 10 mm DIP yellow LED is 54.2556 and standard deviation is 2.64994.
Discussion
The objective of this research was to design a low cost ground level ozone measurement device. The design of a low cost ozone measurement device using visible range of light in the Chappuis band is challenging and still in the research level. In this research, the experiments have been conducted several days by changing LEDs, photodiodes and biasing resistances to measure ozone concentration. The value of ground level ozone in the atmosphere remains in the range of parts per billion (ppb) and it is also represented by micrograms per cubic meter (ug/m3).
The ozone concentration was initially measured on 3rd May 2024 by using 10 mm DIP yellow LED and 10 mm Diffused yellow LED with photodiode of 565 nm peak sensitivity wavelength (BPW 21R). The similar experiment has also been conducted on 20 June 2024 by using 10 mm DIP yellow LED and 10 mm Diffused yellow LED but with a photodiode of 580 nm peak sensitivity wavelength (VTB 8440BH). It is found that the result by using photodiode VTB 8440BH as shown in Fig. 5 gives more appropriate values than the values of other experimental results.
Conclusion
Experiments have been conducted by using the available 573 nm wavelength yellow-green LED, 589 nm wavelength DIP & Diffused yellow LED, amber LED of approximately 595 nm wavelength, and 605 nm wavelength orange LED. Available photodiodes of 565 nm and 580 nm peak sensitivity have been used as the photodetector. Here detection level of photodiode wavelength and yellow LED wavelength are close to the visible range absorption spectrum of ozone. So, it is found that data obtained from the yellow LED with 580 nm peak sensitivity photodiode shows better results than the results obtained from other LEDs. The present limitation to develop an indigenous and low-cost ozone measuring device using visible light is that photodiode of 605 nm peak sensitivity is not easily available.
Future Scope of Work
Measuring the concentration of ground level ozone using a standard ozone generator inside a chamber which will help to provide the accuracy in measuring the ozone concentration.
Acknowledgement
The author is thankful to Dr. Rajkumar Chakraborty, Associate Professor of Basic Science and Engineering, Govt. College of Engineering and Ceramic Technology for giving technical advices for my research works. The Author is also grateful to the Library of Indian Statistical Institute (Kolkata) and the Library of Govt. College of Engineering and Ceramic Technology for issuing the required books for my research works.
Funding Sources
The author(s) received no financial support for the research, authorship, and/or publication of this article
Conflict of Interest
The author(s) do not have any conflict of interest.
Data Availability Statement
All the data shown in the tables have been generated by the experiments and no outside data has been used in this article.
Ethics Statement
This research did not involve human participants, animal subjects, or any material that requires ethical approval
Informed Consent Statement
This study did not involve human participants, and therefore, informed consent was not required
Permission to Reproduce Material from other Sources
Not applicable
Clinical Trial Registration
This research does not involve any clinical trials.
Author Contributions
First author has made experiment and drafted manuscript under the guidance of co-author. Co-author has reviewed the manuscript and approved the manuscript after correction.
References
- Baird C. Environmental Chemistry. New York: W.H. Freeman and Company; 1998:30-35.
- Andrews J.E., Brimblecombe, P., Jickells T.D., Liss P.S. An Introduction to Environmental Chemistry. London: Blackwell Science Ltd.;1996: 30-36.
- WHO global air quality guidelines. Particulate matter (PM2.5 and PM10), ozone, nitrogen dioxide, sulfur dioxide and carbon monoxide. Geneva: World Health Organization, 2021. Licence: CCBY-NC-SA 3.0 IGO. https://iris.who.int/bitstream/handle/10665/345329/9789240034228-eng.pdf Accessed on 29 August 2024
CrossRef - McElroy C.T., Fogal P.F. Ozone: from discovery to protection, Atmospheric –Ocean. 2008; 46(1): 1-13.
CrossRef - Dobson G.M.B. Forty years’ research on atmospheric ozone at Oxford: a history, Appl. Opt.1968; 7(3):387-405.
CrossRef - Komhyr W.D., Grass R.D., Leonard R. K. Dobson Spectrophotometer 83: A standard for total ozone measurements. Journal of Geophysics. 1989; 94: 947-961.
CrossRef - Robinson R. Atmospheric Monitoring Techniques. In: Hewitt C. N., Jackson A.V. Handbook of Atmospheric Science – Principles and Applications. USA: Blackwell Publishing; 2003: 439-472.
CrossRef - Komhyr W.D., Operations handbook-ozone observations with a Dobson Spectrophotometer. World Meteorological Organization; Geneva:1980. Revised 2008 by Evans R. D; GAW No.183. https://gml.noaa.gov/ozwv/dobson/GAW183-Dobson-WEB.pdf Accessed on 29 August 2024.
CrossRef - Kerr J.B., McElroy C.T., Olafson R.A. Measurements of total ozone with the Brewer spectrophotometer. Proc. of the Quad Ozone Symp; 4-9 August,1980; Boulder, USA.
- Thomas L., Bowman M. R. Atmospheric penetration of ultra-violet and visible solar radiations during twilight periods. Journal of Atmospheric and Terrestrial Physics.1969; 31: 1311-1322.
CrossRef - Down R.D., Lehr J.H. Environmental Instrumentation and Analysis Handbook. New Jersey: John Wiley & Sons, Inc.; 2005: 88-123.
- Gorshelev V., Serdyuchenko A., Weber M., Chehade W., Burrows J.P. High spectral resolution ozone absorption cross-section – Part 1: Measurements, data analysis and comparison with previous measurements around 293K, Atmos. Meas. Tech., 2014; 7(2): 609 – 624.
CrossRef - Inn E. C. Y., Tanaka Y. Absorption coefficients of ozone in the ultraviolet and visible regions. J. Opt. Soc. Am. 1953; 43 (10): 870 – 873.
CrossRef - Brion J., Chakir A., Charbonnier J., Daumont D., Parisse C., Malicet J. Absorption spectra measurements for the ozone molecule in the 350 – 830 mm region, J. Atmos. Chem. 1998; 30: 291 – 299.
CrossRef - Braslavsky S. E., Rubin M.B. The history of ozone part VIII. Photochemical formation of ozone, Photochem. Photobiol. Sci. 2011; 10: 1515 – 1520.
CrossRef - Hartley W. N. On the absorption spectrum of ozone. J. Chem. Soc. Trans.1881; 39: 57 – 60.
CrossRef - O’Keeffe S., Dooly G., Fitzpatrick C., Lewis E. Optical fibre sensor for the measurement of ozone. IOP Publishing, Journal of Physics: Conference Series 15; 2005: 213 – 218.
CrossRef - Snyder E.G., Watkins T.H., Solomon P.A., Thoma E.D., Williams R.W., Hagler G.S.W., Shelow D., Hindin D.A., Kilaru V.J., Preuss P.W. The changing paradigm of air pollution monitoring, Environmental Science and Technology. 2013; 47:11369 – 11377.
CrossRef - Shaver P. J. Activated tungsten oxide gas detectors. Applied Physics Letters. 1967; 11(8): 255 – 257.
CrossRef - Seiyama T., Kato A., Fujiishi K., Nagatani M. A new detector for gaseous components using semiconductive thin films. Analytical Chemistry.1962; 34(11): 1502 – 1503.
CrossRef - Hearn A. G. The absorption of ozone in the ultra-violet and visible region of spectrum. Proc. Phys. Soc.1961;78: 932 – 940.
CrossRef - Davis R.S., Niederhauser B., Hodges J.T., Viallon J., Wielgosz R. I. Units and values for the ozone absorption cross section at 253.65 nm (air) with appropriate significant digits and rounding for use in documentary standards. RAPPORT BIPM – 2022/02. Final Version 10 March 2022: 1-16 https://www.bipm.org/documents/d/guest/rapportbipm-2022-02-pdf Accessed on 29 August 2024.
CrossRef - Andersen P. C., Williford C. J., Birks J. W. Miniature personal ozone monitor based on UV absorption, Anal. Chem. 2010; 82(19): 7924 – 7928.
CrossRef - Pijush Patel. Beers Law: Definition, History, Formula And Example. https://www.scienceabc.com/pure-sciences/what-is-beers-law.html 16 Oct 2019. Last updated on 19 Oct 2023. Accessed on 29 August 2024.


