Sulphur Fractions, Distribution, and Connections with Soil Attributes in the Gopalpur and Ishwardi Soil Series of Bangladesh
Sharmin Aktar Hasi2
 , Samiul Ahsan1
, Jagadish Chandra Joardar1
, Sadiqul Amin1
and Milton Halder1
, Samiul Ahsan1
, Jagadish Chandra Joardar1
, Sadiqul Amin1
and Milton Halder1
1
Soil, Water and Environment Discipline,
Khulna University,
Khulna,
Bangladesh
2
Department of Soil Science,
Govt. B M College,
Barishal,
Bangladesh
Copy the following to cite this article:
Hasi S. A, Ahsan S, Joardar J. C, Amin S, Halder M. Sulphur Fractions, Distribution, and Connections with Soil Attributes in the Gopalpur and Ishwardi Soil Series of Bangladesh. Curr World Environ 2024;19(2).
Copy the following to cite this URL:
Hasi S. A, Ahsan S, Joardar J. C, Amin S, Halder M. Sulphur Fractions, Distribution, and Connections with Soil Attributes in the Gopalpur and Ishwardi Soil Series of Bangladesh. Curr World Environ 2024;19(2).
Citation Manager Publish History

Introduction
Sulphur, one of the primary minerals, has long been recognized as a nutrient essential for plant growth. Its importance in plant growth is widely established. Sulphur is essential for physiological and metabolic processes in plants. It is also a component of specific vitamins and enzymes that are crucial for the plant's life cycle. Sulphur can be found in soil as free and adsorbed sulphate, as well as in a variety of organic and inorganic compounds. The organic S is the major portion of soil S, which comes from soil organic matter1. It is widely accepted that most of the agricultural crops suffer due to Sulphur deficiency2;3. This deficiency is due to multiple factors such as lower content of S deposition from atmosphere, trade off soil S due to enhanced crop productivity, and very less content of S in the inorganic fertilizers that apply in the field. SO4-2 is the suitable form for plants to absorb from soil, which constitutes about < 5% of the total soil S. Sulfate deposition from the atmosphere and organic S mineralization often offer ample quantities of S to meet plant requirements 4. However, present S supplies via atmospheric sources are < 10000 g/hacbut this amount of S is generally considered below the threshold limit of S requirement for plants (400,000 g/hac) 5. S availability for plants can play a crucial role for S requirement of crop in locations with low S inputs from the environment or fertilizers. Sulphur deficiency has received enough attention as a major limiting issue. The main causes of S deficiency in Bangladesh are intensive cropping with high yielding varieties for various crops, soil remaining waterlogged for most of the years due to wet land rice culture, shift toward virtually S free fertilizer, and depletion of soil organic residues (agricultural crop residues, forestry residues, and organic waste materials, can be utilized as feedstock for biofuel production) from the field due to fuel shortage 6. The study was carried out to investigate the correlation between various fractions of soil S and edaphic properties of Gopalpur and Ishwardi soil series of Bangladesh.
Materials and Methods
Soil Sample Collection
The study area belonging to the Gangetic alluvium tidal floodplain soil is located at Phultala upazila in Khulna (Figure 1; between 21.38?N and 23.1 N Latitude and 88.58 E longitude). Three soil samples were collected horizontally from freshly exposed pits of Gopalpur and Ishwardi soil series were kept in clean air-protected polyethylene bags. Soils, four representatives, were sampled at different vertical depths from each pit. Soil samples were collected from 0-13 cm, 13-18 cm, 18-29 cm and 29-50 cm depths.
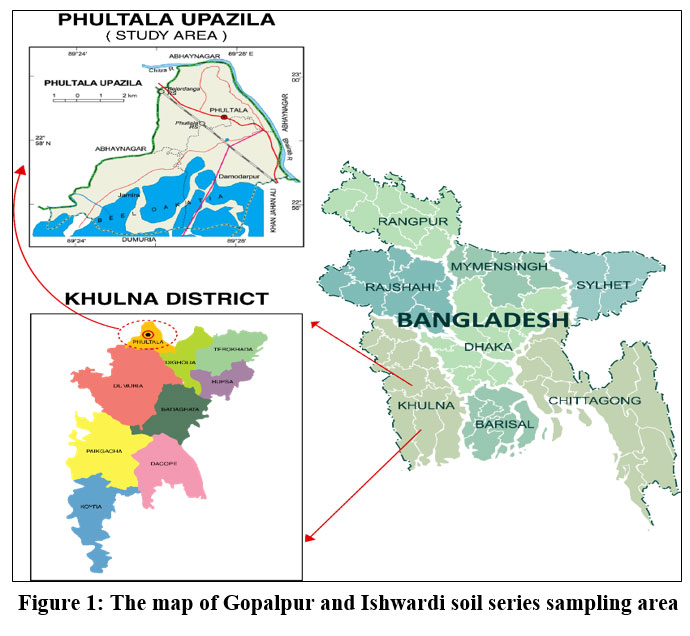 | Figure 1: The map of Gopalpur and Ishwardi soil series sampling area
|
Processing of soil sample
The collected soil samples were air dried, and the larger particles were gently crushed using a wooden hammer. A 2 mm sieve was used to filter a portion of the crushed soil. The sieved particles were gathered in a plastic pot and leveled properly. Chemical analysis was performed in the laboratory of Soil, Water and Environment Discipline, Khulna University.
Laboratory analyses
The soil samples were characterized by the following standard procedures. Soil samples were extracted by using different extractants for characterizing different The soil samples were characterized by the following standard procedures. Soil samples were extracted by using different extractants for characterizing different forms of S. Other parameters such as textural class, pH, EC, and organic carbon (OC) were also determined. Each sample was replicated thrice. The textural analysis of the samples were carried out by the procedure outlined by Gee and Buder 7. The soil pH and conductivity were estimated by using a pH meter and EC meter, respectively (Hanna instruments, model pH-211). 1:2.5 ratio of soil: water was followed for determining soil pH 8. Soil EC was calculated by EC meter (Hanna instruments, model EC-214), where soil- water ratio was 1:5 9. The wet digestion procedure of Walkley and Black’s to estimate soil organic matter was followed10,8. Available S was extracted using 0.01M CaCl2. Th soil S, which was adsorbed to clay minerals was determined by subtracting available S from the S extracted with 500 mg/kg phosphate solutions 11. Total S was extracted by using HNO3-HClO4 acid digestion mixture 12. Organic S was calculated by using the formula,
The The S in the filtrate was determined using spectrophotometer at 420 nm wavelength 13.
Data analysis
The statistical analyses were done by using Microsoft Excel, and MINITAB 16.0.
Results and Discussion
Soil properties
The pH of the Gopalpur soils series ranged from very slightly alkaline to medium alkaline and varied with depth. The lowest value was 7.64 at 0-13 cm depth and increased with depth, reaching 8.42 at 29-50 cm depth. Similar findings were observed in Gopalpur soil collection 6,14. The vertical pH distribution of the Ishwardi soils tested ranged from 7.70 to 8.58, with a mean of 8.20. Similar to the Gopalpur soil series, the lowest and greatest pH values were found at depths of 0-13 cm and 29-50 cm, respectively. The soils are very slightly alkaline to medium alkaline, as indicated by the lowest value of 7.70 and the highest value of 8.58. This could be explained by changes in the oxidation-reduction conditions in floodplain soils, as well as a weaker buffering mechanism in those profiles. Rahman15 also reported similar findings.
ForFor both soil series, the maximum value of soil EC was reported at depths 0-13 cm, with a decreasing tendency with increasing depth. Both soils were non-saline (0-2 dS/m) in character (Table 1). Similar findings have also been reported in 14.
The OC content was found to be higher at 0-13 cm depth for both soil series and declined as the depth of the soil profile increased because of organic carbon content decreases with increasing depth from the surface. The OC range for the Gopalpur soil series was 0.5-1.8%, whereas it was 0.42-1.57% for the Ishwardi soil series. In the Gopalpur series, Rahman 15 found 2.1% OM in the surface soil. According to Bhuiyan et al., 16, the OM content of several soil series in Bangladesh ranged from 0.86 to 4.47%, with a mean value of 1.89%.
Silt ranges particles dominate the particle size of soil samples. Except for surface soil, the textural class of the Gopalpur soil series is predominantly silty clay loam (Table 1). The texture of the surface soil is silt loam. The percentages of clay and sand particles ranged from 20 to 38% and 10 to 22%, respectively. In the Ishwardi soil series, the vertical distribution of sand ranged from 10% to 18%. With increasing depth, the percentage of sand in both soil series dropped. The percentage of silt in the Ishwardi soil series showed an erratic tendency, but it declined with depth in the Gopalpur series. The vertical distribution of clay in the Ishwardi soil series investigated ranged from 34% to 46%. In the Ishwardi soil series, the greatest value 46% was achieved at a depth of 28-39 cm, and the lowest value 34% was found at a depth of 29-50 cm (Table 1). In the Ishwardi soil series, the percentage of clay changed randomly with depth, but it raised in the Gopalpur soil series. The textural class was silty clay up to a depth of 29 cm, and silty clay loam at a depth of 29-50 cm.
Table 1: The vertical distribution of soil characteristics in Gopalpur and Ishwardi series.
Soil series | Depth (cm) | pH | EC (dS/m) | OC (%) | Sand | Silt | Clay | Textural class |
(%) (%) (%) | ||||||||
Gopalpur | 0-13 | 7.64 | 1.15 | 1.8 | 22 | 58 | 20 | silt loam |
13-18 | 8.08 | 1.12 | 0.8 | 18 | 54 | 28 | silty clay loam | |
18-29 | 8.4 | 0.91 | 0.7 | 16 | 49 | 35 | silty clay loam | |
29-50 | 8.42 | 0.98 | 0.5 | 12 | 48 | 36 | silty clay loam | |
Mean | 8.19 | 1.04 | 0.96 | 15.6 | 52.2 | 31.4 | ||
Ishwardi | 0-13 | 7.7 | 1.34 | 1.57 | 18 | 40 | 42 | silty clay |
13-18 | 8.31 | 0.95 | 0.57 | 13 | 42 | 45 | silty clay | |
18-29 | 8.28 | 0.97 | 0.45 | 12 | 58 | 46 | silty clay | |
29-50 | 8.58 | 0.88 | 0.42 | 10 | 44 | 34 | silty clay loam | |
Mean | 8.2 | 1.04 | 0.75 | 13.6 | 45.8 | 41.4 | ||
Sulfur fractions
Available S
In In Gopalpur soil series, the range of available S was 0.57 to 2.75 mg/kg, while the average was 1.82 mg/kg. Surface soil had the highest value of 2.75 mg/kg. The concentration of plant available S in soil was reduced with increasing soil vertical depth (Table 2). In the Ishwardi soil series, the plant available S concentration was 3.65 mg/kg in average, which ranged from 1.04 to 9.47 mg/kg. Surface soil yielded the highest result of 9.47 mg/kg identical to the Gopalpur soil series. Greater OC content in surface soil layers could explain the higher available S content. This result is corroborated with the results of Kumar et al., 17.
Adsorbed S
In the Gopalpur soil series, absorbed S content ranged from 0.95-8.77 mg/kg, while the average was 3.94 mg/kg. Surface soil had the highest S value of 8.77 mg/kg. Adsorbed S was shown to decrease as soil depth increased. The absorbed S content of the Ishwardi soil series ranged between 4.55 and 12.69 mg/kg, with an average S content of 7.41 mg/kg. Surface soil yielded the highest result of 12.69 mg/kg. This could be owing to the increased clay content with depth, as observed by Misra et al., 18. Also, several factors can influence the adsorbed S content such as physical properties, chemical composition, pH, temperature, ionic strength, redox conditions etc.
Table 2: Depth wise distribution of different S fractions in Gopalpur and Ishwardi soil series
Depth cm | Gopalpur soil series | Ishwardi soil series | ||||||
Fractions of S (mg/kg) | ||||||||
Available | Adsorbed | Organic | Total | Available | Adsorbed | Organic | Total | |
0-13 | 2.75 | 8.77 | 852 | 864 | 9.47 | 12.69 | 853 | 875 |
13-18 | 2.27 | 5.00 | 945 | 953 | 1.71 | 6.97 | 876 | 884 |
18-29 | 1.70 | 1.03 | 985 | 988 | 2.18 | 4.55 | 669 | 676 |
29-50 | 0.57 | 0.95 | 1106 | 1108 | 1.23 | 5.45 | 399 | 406 |
Mean | 1.82 | 3.94 | 972 | 978 | 3.65 | 7.41 | 699 | 710 |
Organic S
The organic S content of the Gopalpur soil series increased with soil depth, ranging from 852-1106, while the average result was 972 mg/kg (Table 2). This could be owing to in deeper soils, there's typically more space for organic matter accumulation. Organic sulfur is often found in organic matter, such as decaying plant and animal material. So, deeper soils might have more organic matter, leading to higher organic sulfur content. The organic S content of the Ishwardi soil series dropped as soil depth increased, ranging from 399 to 876 and the average was 699 mg/kg (Table 2). The sulfur of organic matter is considered as organic S is an important source of available S for plants uptake and growth following mineralization from organic to inorganic form (sulphate) through microbial decomposition of organic matter19. The amount of the drop in organic S corresponded to the decrease in soil OC content. Intensive root activity, as well as incorporation of crop residue and different organic amendments substantially applied on the top soil resulting enhanced OC in the top soil, and thereby leading to greater content of organic S in the top soils layer. Srinivasarao et al., 19 reported similar results.
Total S
The total S concentration of the Gopalpur soil series ranged between 864 and 1108, while the average level was 978 mg/kg. The greatest value, 1108 mg/kg, was found at the shallowest depth of the soil profile. The total S content of the Ishwardi soil series ranged between 406 and 884, with an average content of 710 mg/kg. The maximum value of 884 mg/kg was recorded at a depth of 13-18 cm in the soil profile (Table 2). Total S in the soil depends on various factors. These factors include soil organic matter concentration, precipitation, position of the location on the earth surface, and parent rock.
According to Larson et al., 20, the total soil S content is also affected by the type of fertilizer used (mineral or organic manure), and soil changes have been found to be proportionate to the number of organic wastes provided. Total soil S is declined with increasing soil vertical distance, which could be attributed to a drop in OC content. The concentrations of different fractions of soil S are also influenced by clay content, range of soil pH, soil CaCO3, SOM21. Moreover, soil S availability is also impacted by agricultural operation and management coupling with different fractions of soil S. The different fractions of soil S influenced the S availability through their dynamic equilibrium in the liquid phase of soil 22.
Relationship among soil properties
As part of the investigation, a correlation matrix was performed to assess whether any association exists between the various soil characteristics regardless of soil series or soil depth (Table 3). There was a considerable positive association between total S and organic S, as well as available S and adsorbed S (Table 3). Organic S and total S exhibited a positive but insignificant connection with available S. Organic S and total S had a negative but negligible connection with adsorbed S (Table 3). All fractions of S (available S, adsorbed S, organic S, and total S) were associated positively with EC, OC, sand, and clay, but negatively with pH and silt content in soil (Table 3). According to Aulakh and Dev 23, pH less than 6.4 had substantially greater absorbed S. Soil pH did not have a significant relationship with total S 24. The organic S fraction in soil presents as range of materials such as microbial derived materials as well as turnover materials of degraded plants parts, soil macro and micro animals leftovers25,26.
Table 3: Pearson’s correlation matrix among the studied soil properties
pH | EC | OC | Sand | Silt | Clay | Av S | Ad S | Org S | Total S | |
EC | -0.91** | 1 | ||||||||
OC | -0.95*** | 0.82* | 1 | |||||||
Sand | -0.89** | 0.72* | 0.89** | 1 | ||||||
Silt | -0.20 | -0.06 | 0.10 | 0.33 | 1 | |||||
Clay | 0.36 | -0.18 | -0.49 | -0.63 | -0.47 | 1 | ||||
Av S | -0.70 | 0.86** | 0.66 | 0.45 | -0.37 | 0.19 | 1 | |||
Ad S | -0.77* | 0.78* | 0.71* | 0.47 | -0.27 | 0.01 | 0.82* | 1 | ||
Org S | -0.22 | 0.25 | 0.19 | 0.40 | 0.06 | -0.12 | 0.09 | -0.26 | 1 | |
Tot S | -0.25 | 0.27 | 0.22 | 0.41 | 0.06 | -0.12 | 0.04 | -0.23 | 0.42 | 1 |
Here, Av S= available S, Ad S= adsorbed S, Org S= organic S, and Tot S= total S. *, **, *** indicate values are significant at 0.05, 0.01, 0.001 level, respectively.
Carbon: Sulphur relationship
The mean OC: organic S ratio for the Gopalpur soil series was 9.87, while it was 10.76 for the Ishwardi soil series. Similarly, the OC: total S ratio for the Gopalpur and Ishwardi soil series was 9.82 and 10.59, respectively (Fig. 2). The C:S ratios, which we found in this study were compared with the findings reported by Balanagoudar and Satyanarayana 27 in Karnataka soils and Sharma et al., 28 for various Alfisols, Inceptisols, and Mollisols. According to the findings, the organic fraction is the most prevalent of the S fractions in the soils investigated. The S release as available S for plant growth from organic matter through decomposition by microbial activity is determined by hydrological parameters such as soil moisture content, redox potential, pH, texture, structure etc. A greater portion of soil S is present as organic S in soil organic matter. The SO4-S in soils solution is greatly maintained by mineralization under optimal settings of hydrological and thermal. Overall, the available S concentration in these soils' surface layers is less than the threshold limit value (10 mg/kg), hence S treatment is required to increase crop production levels.
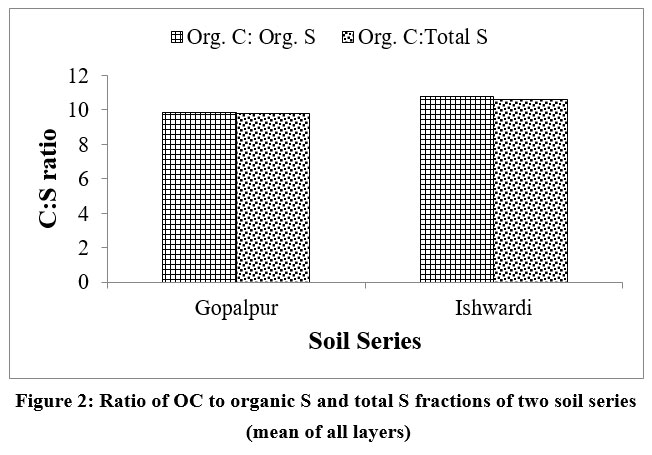 | Figure 2: Ratio of OC to organic S and total S fractions of two soil series (mean of all layers)
|
Conclusion
The fractions and distribution of various forms of S (available S, adsorbed S, organic S, and total S) in the Gopalpur and Ishwardi soil series of Gangetic Alluvium Floodplain soil in Bangladesh were investigated. The average quantity of different fractions of S in soil profile in the Gopalpur soil series ranged from 864-1108 mg/kg for total S, 852-1106 mg/kg for organic S, 0.95-8.77 mg/kg for adsorbed S, and 0.57-2.75 mg/kg for available S. In contrast, the mean values of distinct S fractions in the Ishwardi soil series ranged from 406-884 mg/kg for total S, 399-876 mg/kg for organic S, 4.55-12.69 mg/kg for adsorbed S, and 1.04-9.47 mg/kg for available S. The various S fractions were present in the following order: organic> absorbed> available form, with organic being the most abundant. The available S content in these soils' surface layers is less than the critical limit value (10 mg/kg). The Gopalpur soil series had elevated levels of organic and total S, whereas the Ishwardi soil series had increased levels of available and adsorbed S. Organic S of both series accounted for 97–99% of total S. Both soil series had low OC content, were non-saline, and had a pH ranging from very slightly alkaline to medium alkaline. Plant available S showed a significant positive correlation with adsorbed S in soil profiles. Organic S had a substantial positive connection with total S. The average OC: organic S ratio for the Gopalpur soil series was 9.87, compared to 10.76 for the Ishwardi soil series. Similarly, the OC: total S ratio for the Gopalpur and Ishwardi soil series was 9.82 and 10.59, respectively.
The amount of available and absorbed S reduced as soil profile depth increased. The Ishwardi soil series had higher levels of both available S and adsorbed S compared to the Gopalpur soil series. The Gopalpur soil series had a higher abundance of the organic form of S compared to the Ishwardi soil series. Continuous cropping without replenishing S and using unbalanced fertilizer nutrients leads to a faster depletion of S reserves. The combination of inorganic fertilizers containing S sources and organic manures is essential for maintaining and preserving soil fertility with regards to S levels.
Acknowledgement
The article submitted for this journal is entirely of the candidates’ own investigations and no part of the article or results have not been published for any journal, nor is it being concurrently submitted for any journal.
Funding Sources
No fund was received for the present work.
Conflict of Interest
There is no conflict of interest between authors.
Authors’ Contribution
Sharmin Aktar Hasi wrote the first draft of manuscript, Samiul Ahsan helped in laboratory works, Jagadish Chandra Joardar, Sadiqul Amin, and Milton Halder designed the work, edited and revised the final version of manuscript.
Data Availability Statement
All the datasets throughout the study have been incorporated in the manuscript
Ethics Approval Statement
Neither any animals were involving nor harm during the study.
References
- Russell E.J. Soil conditions and plant growth. Longmans, Green & Co., London. 1952;
- Blair G. Sulphur fertilizers: A global perspective. Proceedings no. 498. International fertilizer society, York, U.K. 2002;
- Zhao F.J, McGrath S.P, Blake-Kalff M.M.A, Link A and Tucker M. Crop responses to sulphur fertilization in Europe. Proceedings no. 504. International fertilizer society, York. 2002;
- Radojevic M and Bashkin V.N. Practical environmental analysis. Royal society of chemistry, Cambridge UK. 1999;
CrossRef - McGrath S.P, Zhao F.J and Blake-Kalff M.M.A. History and outlook for sulphur fertilizers in Europe. Proceedings no. 497. International fertilizer society, York, U.K. 2002;
- Rahman M.N, Sayem S.M, Alam M.K, Islam M.S and Mondol A.T.M.A.I. Influence of sulphur on nutrient content and uptake by rice and its balance in old Brahmaputra floodplain soil. Journal of Soil and Nature. 2007;1(3): 5-10.
- Gee G.W and Buder J.W. Particle- size analysis. In: Klute, A. (ed), Methods of soil analysis. Part I (2nd ed), Agronomy Monograph, ASA and SSSA, Madison, Washington. 1986; 383-411 pp.
CrossRef - Jackson M.L. Chemical composition of soils. In: Bear, F.E (ed). Chemistry of soil, 2nd ed. Oxford and IBH publishing company, New Delhi. 1962; 71-141 pp.
- USDA (United States Department of Agriculture) 2004.Soil survey laboratory manual, soil survey investigation report no. 42, version 4.0, USDA-NRCS, Nebraska, USDA.
- Piper C.S. Soil and plant analysis. International Public Inc., New York. 1950;
- Ensminger L.E. Some factors affecting the adsorption of sulfate by Alabama soils. Soil Science Society of America. 1954;18: 259-264.
CrossRef - Vogel A.I. A Textbook of Quantitative Inorganic Analysis, 3rd Edition. 1961;p 230.
- William C.H and Steinbergs A. Soil sulphur fractions as chemical indices of available sulphur in some Australian soils. Australian Journal of Agriculture Research. 1959;10: 340–352.
CrossRef - Ahmed I.U, Faiz S.M.A, Rahman S, Anwar Hussain A.K.M and Bhuiyan N.I. Effect of nitrogen and residual sulphur on the growth, yield and N-S composition of rice. Journal of the Indian Society of Soil Science.2004;37: 323-327.
- Rahman M.A. Integrated use of fertilizer and manure for crop production in wheat-rice and rice-rice cropping patterns. Ph.D. thesis, Dept. of Soil Sci., Bangladesh Agriculture University, Mymensingh, Bangladesh. 2005;
- Bhuiyan N.J, Shah A.L and Panaullah G.M. Effect of NPK fertilization on the grain yield of transplanted rice and soil fertility-a long-term study. Bangladesh Journal of Soil Science. 1991;22(1&2): 41-50.
- Kumar R, Singh K.P and Singh S. Vertical distribution of sulphur fractions and their relationships among carbon, nitrogen and sulphur in acidic soil of Jharkhand. Journal of the Indian Society of Soil Science. 2002;50(3): 502-505.
- Misra U.K, Das C.P and Mitra G.N. Forms of sulphur in some soils of Orissa in relation to relevant soil properties. Journal of Indian Society of Soil Science. 1990;38: 61-69.
- Srinivasarao Ch, Ganeshamurthy A.N, Masood Ali, Singh R.N and Singh K.K. Sulphur fractions, distribution, and their relationships with soil properties in different soil types of major pulse-growing regions of India. Communications in Soil Science and Plant Analysis. 2004;35: 2757-2769.
CrossRef - Larson W.E, Clapp C.E, Pierce W.H and Mochoran V.B. Effects of increasing amounts of organic residues on continuous corn: II. Organic carbon, nitrogen, phosphorus, and sulphur. Agronomy Journal. 1972;64: 205-208.
CrossRef - Xiao H, Li N and Liu C. Source identification of sulfur in uncultivated surface soils from four Chinese provinces. Pedosphere. 2015;25: 140-149.
CrossRef - Azmi N.Y, Seema and Manish K. New technique for sequential fractionation of soil sulphur. International Journal of Current Microbiology and Applied Sciences. 2018;3397-3405.
- Aulakh M.S and Dev, G. Profile distribution of sulphur in some soil series of Sangrur district, Punjab. Journal of Indian Society of Soil Science. 1976;24: 308–313.
- Dolui A.K and Saha S.G. Studies on sulphur status of some soils of West Bengal, India. Indian Journal of Agricultural Chemistry. 1983;16(2): 259-265.
- Eriksen J, Murphy M.D and Shung E. The soil sulphur. In: Schung E. (ed.): Sulphur in agroecosystems. Kluwer academic publishers, Dordrecht. 1998; 39-73.
CrossRef - Solomon D, Lehmann J, Tekalign M, Fritzsche F and Zech W. Sulphur fractions in particle size separates of the sub-humid Ethiopian highlands as influenced by land use changes. Geoderma. 2001;102: 41-59.
CrossRef - Balanagoudar S.R and Satyanarayana T. Correlations of different forms of sulphur with soil properties and with organic carbon and nitrogen in some Vertisols and Alfisols. Journal of the Indian Society of Soil Science. 1990;38: 641–645.
- Sharma Y.K, Gangwar M.S and Srivastava P.C. Sulphur fractions and carbon, nitrogen and sulphur relationships in Alfisols, Inceptisols and Mollisols in some parts of western Uttar Pradesh. Journal of the Indian Society of Soil Science. 2000;48: 477–485.


