Climate Extremes Related with Temperature Change Point Detection in Pambar Kottakaraiyar Basin
Supriya. P
*

1
Department of Civil Engineering,
Centre for Water Resources,
Anna University, Chennai,
Tamil Nadu
India
Copy the following to cite this article:
Supriya P. Climate Extremes Related with Temperature Change Point Detection in Pambar Kottakaraiyar Basin. Curr World Environ 2024;19(2).
Copy the following to cite this URL:
Supriya P. Climate Extremes Related with Temperature Change Point Detection in Pambar Kottakaraiyar Basin. Curr World Environ 2024;19(2).
Citation Manager Publish History

Introduction
The latest sixth assessment report was published by Intergovernmental Panel on Climate Change (IPCC), a scientific group of the United Nations (UN). Based on this report, the global warming will reach or exceed 1.5°C even if the world currently adapts very low greenhouse gas emissions scenarios1. Global warming due to the increase of greenhouse gases is a major threat to the all the living beings and environment. All the meteorological parameters are related to global temperature, which alters the energy budget and hydrological cycle. The aerosol increase in the atmosphere due to the burning of fossil fuels alters the carbon content results in climate change2. The temperature extremes have environmental, economic and humanitarian effects over intense heat triggering enormous losses in the economy3 and growing loss of life rates worldwide4. Several studies documented the record breaking extreme heat waves in different countries such as, Australia5, United states6, South Korea7, South Asia8,9, China10, North Africa11 and Canada in the year 2021 with 500 human beings lost their lives and 180 forest fires reported12. Adaptation to heat waves related to individual behaviour, improving infrastructure facilities and modifying institutional policies13. According to sustainable development goal (SDG) special report 2023, the intensity and frequency of extreme events of weather are by this time impacting all over the world which in turn needs immediate climate resilient and adaptation measures to achieve the SDG of climate action.14
The developing countries and under developed countries are not able to cope with the less adaptive capacity. The frequency and intensity of heat waves based events will increase. Hence the properties of recent past heat extremes to be understood well for planning and making decisions.15 In early March, 2022, India experienced unprecedented heatwave spell from March 11 to March 18, 2022. During the year 2022, Rajasthan and Maharashtra witnessed the maximum temperature as 40°C and 45°C respectively.16 In developing countries like India the agricultural activities are getting affected due to the increase in temperature especially crop failure and food security crisis. Around 80% of the water is utilized for the agriculture; the high heat waves reduce the soil moisture and require frequent irrigation. Thereby more water consumption and slowly inviting the drought conditions. Hence the current comprehensive research on Indian river basins requires deeper understanding of trends and change points of temperature. This study investigates the changes in temperature over a historical period of 30 years from 1992 to 2021. This study carried out to address the research questions, initially to find trend characteristics monthly, seasonal and annual time scales for temperature and second to when the shift in temperature occurred over the long term period. The study helps in mitigation and adaptation policy framework to decrease the future risk related to temperature extremes due to climate change.
Study Area
The Pambar Kottakaraiyar basin details were received from the Water resources division, Tamil Nadu Government. This basin is one among the 17 river basins of Tamil Nadu and the index map of the basin is shown in the Figure 1. The river basin is situated in the geographical coordinates of 9°30’0” N - 10°25’0” N latitude and 78°10’0” E - 79°0’0” E longitude. It is surrounded by Agniyar basin on north side, Cauvery basin on north-western side, Vaigai basin in the south and Palk-bay in the east. The areal extent of the basin is 5910.87 km2, covering 18 taluks inclusive of 27 blocks belongs to six districts. The basin contains the following sub basins, which are Pambar, Manimuthar and Kottakaraiyar. Physiographically, the basin is divided into discontinuous hillocks on the north-western side, Eastern Ghats mountain ranges and remaining part of the basin is a gentle sloping topography. About 50% of the basin area is occupied by Sivagangai district, the other districts are Ramanathapuram, Pudukkottai, Dindigul, Madurai and Trichy.17,18
About 65% of land of the basin area is agricultural land of which groundwater irrigation is about 80%, 3.3% of land is reserved forest area, 1.23% is settlement, 3.1% comprises of tanks. The major part of 18.9% land is barren land and remaining covers the land affected by alkanity, backwater creek, land with scrub and shrub and barren out-crop. It is called as “Basin of tanks”, because it has 7602 tanks enclosed within its boundary. The ayacut irrigated by these tanks is about 1,33,008 hectares of land. The inter-basin transfer of water is from Vaigai basin. The ground water resources capacity of the basin is found to be 811.97 M.cum. The basin comprises of water stressed Dindigul, Madurai, Ramanathapuram, Pudukkottai and Sivaganga districts. The major problem in this basin is decreasing of groundwater levels, aquifer system with massive and poor yielding and poor groundwater quality issues. Paddy, sugarcane, groundnut, maize, cotton etc. are the main crops grown in this basin which needs more water and thus making the farmers extremely dependent on monsoon. The basin has semi-arid climate and it experiences annual normal rainfall of 924 mm Trichy. 17,18
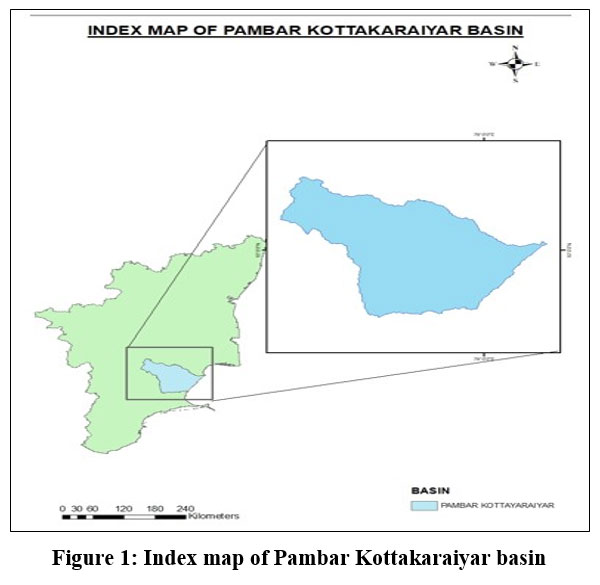 | Figure 1: Index map of Pambar Kottakaraiyar basin
|
Methodology
MK statistical test and Sen’s slope test for trend detection
The MK test 19,20 and the Theil-Sen slope trend detection test21,22 were utilized for the trend analysis of temperature. The Mann-Kendall statistic S and standardized test statistics Z is given by,
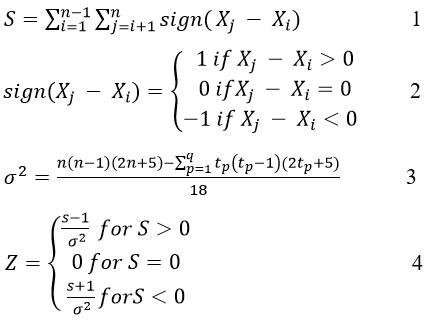
The parameters of statistics are xi and xj are the sequential data values in the years i and j, n is the number of data values in the record, tp is the count of ties for the pth values and q is the count of tied values.
where xi and xj are the sequential data values of the time series in the years i and j, and ? is the magnitude of the trend slope of series values.23
Changeover point detection method
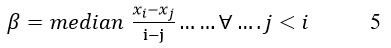
A changeover point analyser can detect multiple changes. The detection of changeover point method is an efficient statistical tool used to indicate the erratic variability of climate in the long term climate data sequences. The hydrological cycle is recently undergoing major changes and the identification of the changeover point in climate data series is in need of the hour. The revealing of changeover point method plays a vital role in the hydrology-climate change based research. The two climate stations as shown in Figure 2, records observed temperature data. The daily data of temperature is collected from Statistical department, Chennai for the period of 1992 to 2021 (30 years).
 | Figure 2: Rain guauge and climate stations of Pambar Kottakaraiyar basin
|
The method is used by Taylor24, carried out the change point analysis iteratively by a combination of boot strapping method and cumulative sum charts (CUSUM) to identify changes. The cumulative sums Ki is estimated by the equation 6 is as follows,
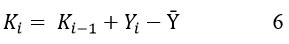
Where,
K0 = zero, Initial accumulative sum K0,
i = 1, 2, 3,……………, 25,
Y is the mean of the trial series.
The cumulative sum of differences between values and mean. An upward slope for a particular period shown in the CUSUM chart specifies that the values are above on the whole average. A downward slope for a certain period in the CUSUM chart indicates that the values are below the whole average. A sudden shift in the CUSUM chart represents sudden variation in the mean. The data series consists of two averages which are divided into fragments and using the repetitive procedure average square of evaluations is calculated until it reaches the minimization of average square of error. The significance of the changeover point is evaluated with the help of confidence level based on boot strapping method is as given in equation 7,

here,
K~ = change between the high and least CUSUM entries,
Q = the total of bootstrapped K~ entries which are higher than the baseline K~ values,
N = number of bootstraps.
The changeover point detection is performed with the help of a software works in Microsoft excel named as changeover point analyser. The analyser can easily detect the precise year when the shift is occurred by using CUSUM charts and MSE. The multiple notable changeover points in the total dataset are identified by level of variation and confidence levels. The likelihood of changeover point is computed by the equation 2 and recognised by the rise and fall line in the CUSUM plots. The values of the variable generally fluctuate between the upper and lower limits if there is no change existing in the series.
Results and Discussions
Analyzing month wise, seasonal and yearly temperatures of Kundrakudi station
The MK test is adopted for the temperature series monthly, seasonal (monsoon), and yearly time scales are depicted in Table1 and Table 2. The previous data of 31 years were used to the drift detection and changeover point identification analysis. Yearly average temperature of Tmin , Tmean is showing an increasing trend and Tmax is noticed as having no trend. When ? is equal to 0.05, the statistically significant drift is present in the sequence. The Tmaxin the July, August, October months showed higher increasing drift with highest Z values as 3.62, 2.94, 2.33 respectively. The Tmin in the January, April, June, July, August, October and December months indicated a higher increasing drift with highest Z numeral as represented in Table 1. The Tmean shown that the October, November and December months is having significant rising drift with the uppermost Z entries 2.25, 2.07 and 2.18 respectively. The seasonal statistics of Tmax in NEM and SWM shows an increasing drift with the maximum Z value of 2.14 and 1.19 respectively. The Tminin Summer, NEM, SWM and Annual periods specified a higher rising drift with highest Z entries as shown in Table 1. The Tmean indicated a maximum rising drift with peak Z values 3.46 for NEM, 3.34 for SWM and 2.82 for Annual periods. The Sen’s slope (Theil, 1950 & Sen, 1968) magnitude values of Tmax, Tmin and Tmean present in most of the months and seasons shows a significant rising trend of temperature over the entire basin. The highest values of Tmax as 43.3°C in 2016 and Tmin as 29.64°C in 2019 were recorded in Kundrakudi climate station.
Table 1: MK test statistics for month wise, seasonal and yearly temperatures of Kundrakudi climate station
| TIME SCALE | Tmax | Tmin | Tmean | |||||||||
| Month | Z value | Sen’s value | P value | Trend | Z value | Sen’s value | P value | Trend | Z value | Sen’s value | P value | Trend |
| JANUARY | 0.48 | 0.015 | 0.630 | NT | 2.80 | 0.054 | 0.005 | IT | 1.53 | 0.032 | 0.125 | NT |
| FEBRUARY | -0.55 | -0.020 | 0.580 | NT | 0.75 | 0.028 | 0.453 | NT | 0.12 | 0.007 | 0.901 | NT |
| MARCH | -1.94 | -0.030 | 0.052 | NT | 1.80 | 0.056 | 0.072 | NT | 0.34 | 0.005 | 0.735 | NT |
| APRIL | 0.09 | 0.002 | 0.929 | NT | 2.12 | 0.047 | 0.034 | IT | 1.00 | 0.025 | 0.318 | NT |
| MAY | -0.73 | -0.026 | 0.464 | NT | 1.18 | 0.019 | 0.239 | NT | -0.10 | -0.003 | 0.915 | NT |
| JUNE | 0.99 | 0.034 | 0.318 | NT | 3.21 | 0.045 | 0.001 | IT | 1.61 | 0.037 | 0.108 | NT |
| JULY | 3.62 | 0.134 | 0.000 | IT | 2.69 | 0.037 | 0.007 | IT | 3.75 | 0.085 | 0 | NT |
| AUGUST | 2.94 | 0.078 | 0.003 | IT | 3.16 | 0.032 | 0.002 | IT | 3.50 | 0.055 | 0 | NT |
| SEPTEMBER | 1.53 | 0.063 | 0.125 | NT | 1.11 | 0.012 | 0.269 | NT | 1.71 | 0.039 | 0.087 | NT |
| OCTOBER | 2.33 | 0.113 | 0.019 | IT | 2.30 | 0.046 | 0.021 | IT | 2.25 | 0.076 | 0.025 | IT |
| NOVEMBER | 1.26 | 0.049 | 0.205 | NT | 1.25 | 0.043 | 0.212 | NT | 2.07 | 0.042 | 0.038 | IT |
| DECEMBER | 1.19 | 0.037 | 0.232 | NT | 2.93 | 0.085 | 0.003 | IT | 2.18 | 0.054 | 0.03 | IT |
| Seasonal statistics | ||||||||||||
| WINTER | 2.14 | -0.008 | 0.803 | NT | 1.64 | 0.061 | 0.101 | NT | 1.11 | 0.034 | 0.269 | NT |
| SUMMER | -1 | -0.059 | 0.318 | NT | 2.86 | 0.137 | 0.004 | IT | 0.62 | 0.039 | 0.532 | NT |
| SWM | 1.19 | 0.299 | 0.002 | IT | 3.18 | 0.137 | 0.001 | IT | 3.46 | 0.198 | 0.001 | IT |
| NEM | 2.14 | 0.192 | 0.032 | IT | 3.43 | 0.162 | 0.001 | IT | 3.34 | 0.187 | 0.001 | IT |
Annual statistics
| -1.2 | -0.036 | 0.232 | NT | 3.14 | 0.053 | 0.002 | IT | 2.82 | 0.037 | 0.005 | IT |
Table 2: MK test statistics for month wise, seasonal and yearly temperatures of Pudukottai climate station
| TIME SCALE | Tmax | Tmin | Tmean | |||||||||
| Month | Z value | Sen’s value | P value | Trend | Z value | Sen’s value | P value | Trend | Z value | Sen’s value | P value | Trend |
| JANUARY | -0.66 | -0.018 | 0.509 | NT | 1.61 | 0.037 | 0.108 | NT | 0.09 | 0.003 | 0.929 | NT |
| FEBRUARY | -1.09 | -0.04 | 0.276 | NT | 0.11 | 0.004 | 0.915 | NT | -0.50 | -0.012 | 0.643 | NT |
| MARCH | -2.11 | -0.036 | 0.035 | DT | 1.93 | 0.063 | 0.054 | NT | 0.86 | 0.018 | 0.392 | NT |
| APRIL | -0.25 | -0.013 | 0.803 | NT | 1.34 | 0.039 | 0.181 | NT | 0.61 | 0.013 | 0.544 | NT |
| MAY | -0.5 | -0.017 | 0.617 | NT | 1.29 | 0.017 | 0.199 | NT | 0.00 | 0.000 | 1.000 | NT |
| JUNE | 0.517 | 0.016 | 0.605 | NT | 1.41 | 0.022 | 0.159 | NT | 1.14 | 0.017 | 0.254 | NT |
| JULY | 2.21 | 0.071 | 0.027 | IT | 2.28 | 0.031 | 0.022 | IT | 2.57 | 0.05 | 0.01 | IT |
| AUGUST | 0.48 | 0.013 | 0.63 | NT | 0.80 | 0.006 | 0.422 | NT | 0.71 | 0.011 | 0.475 | NT |
| SEPTEMBER | 0.46 | 0.015 | 0.643 | NT | 0.36 | 0.005 | 0.721 | NT | 0.34 | 0.01 | 0.735 | NT |
| OCTOBER | 1.21 | 0.015 | 0.643 | NT | 1.52 | 0.027 | 0.129 | NT | 1.25 | 0.038 | 0.212 | NT |
| NOVEMBER | 1.07 | 0.042 | 0.284 | NT | 1.59 | 0.048 | 0.112 | NT | 2.36 | 0.048 | 0.019 | IT |
| DECEMBER | 0.46 | 0.01 | 0.643 | NT | 1.69 | 0.045 | 0.090 | NT | 0.89 | 0.022 | 0.372 | NT |
| Seasonal statistics | ||||||||||||
| WINTER | -1.07 | -0.058 | 0.284 | NT | 0.93 | 0.036 | 0.354 | NT | -0.10 | -0.002 | 0.943 | NT |
| SUMMER | -1.18 | -0.073 | 0.239 | NT | 2.41 | 0.134 | 0.016 | IT | 1.12 | 0.047 | 0.261 | NT |
| SWM | 1.42 | 0.095 | 0.153 | NT | 1.53 | 0.061 | 0.125 | NT | 1.53 | 0.080 | 0.125 | NT |
| NEM | 1.21 | 0.132 | 0.225 | NT | 2.44 | 0.117 | 0.015 | IT | 2.18 | 0.108 | 0.03 | IT |
| Annual statistics | -1.11 | -0.025 | 0.269 | NT | 1.64 | 0.024 | 0.101 | NT | 1.71 | 0.020 | 0.087 | NT |
Analyzing month wise, seasonal and yearly temperatures of Pudukottai station
The results of annual average temperature of Tmin , Tmean and Tmax are detected as having no trend. When ? is equal to 0.05, there exists a statistically significant drift in the series. The Tmax in the July month indicated a significant larger increasing drift with major Z value of 2.21. There is a significant decreasing trend observed in Tmax in the month of February with the Z value of -2.11. The Tmin in the July month specified a higher increasing trend with highest Z value as 2.28. The seasonal statistics of Tmin in Summer and NEM shows an increasing trend with the maximum Z value of 2.41 and 2.44 respectively. The Tmean shown that the July and November months are having significant increasing trend with the maximum Z values 2.57 and 2.36 respectively. The Tmean in NEM period indicated a larger rising drift with a maximum Z value as 2.18. The Tmax, Tmin and Tmean of most of the months and seasons are having positive Sen’s slope magnitude values that indicates that there exists a significant escalating drift of temperature all over the basin. The highest values of Tmax as 43.6°C in 2016 and Tmin as 29.75°C in 2019 was recorded in Pudukottai climate station.
Analysis of change points for Kundrakudi station
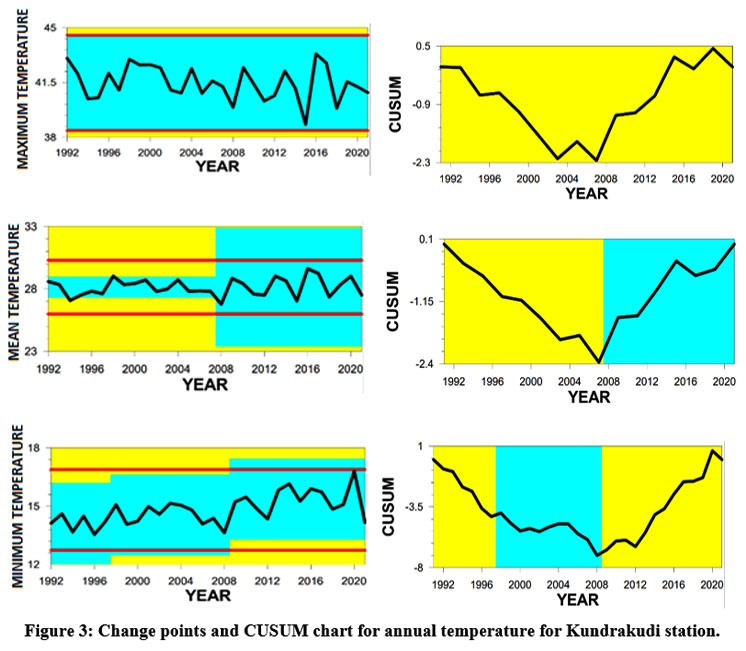 | Figure 3: Change points and CUSUM chart for annual temperature for Kundrakudi station.
|
The identification of change points is achieved through the statistical method which shows a vital role in recognizing the jumps in temperature variable belongs to the long term climatological period. The annual temperature change points were identified in Tmean and Tmin. The results revealed that change has happened during the examined period, which shows Tmean and Tmin values appears outside the control limits as represented in Figure 3.
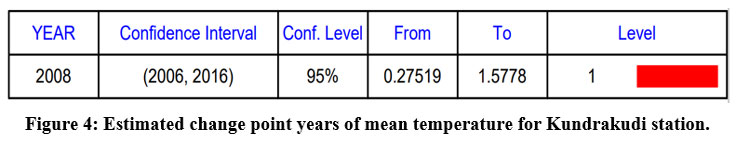 | Figure 4: Estimated change point years of mean temperature for Kundrakudi station.
|
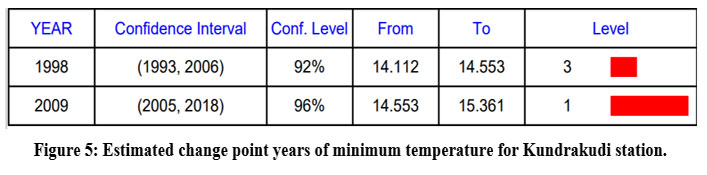 | Figure 5: Estimated change point years of minimum temperature for Kundrakudi station.
|
The levels shown in the Figure 4 and Figure 5 implies that change is occurred and it is closely related with climate change. The Tmean changeover point is occurred in the year 2008 at a confidence interval of 95% at level 1. The Tmin changeover point is occurred in the years 1998 and 2009 at a confidence interval of 92% and 96% and at level 3 and level 1 respectively. Before the happening of the change point the Tmean is 41.25°C in the year 2007 and after the change, it is 42.45°C in the year 2009. In the year 1997 before the change point the Tmin is 19.8°C and after the change the Tmin is 19.1°C in the year 1999. In the case of Tmin, earlier the happening of change point is in the year 2008, the Tmin is 18.9°C and after the change the Tmin is 20.3°C in the year 2010.
Analysis of changeover points for Pudukottai station
The annual temperature changeover points were recognized in Tmean. The Tmean value falls exterior to the control limits indicates that the jump has taken place during the data period of 1990 to 2021. The results revealed that in the year 2008, there is a climate jump identified in Tmean variable as depicted in Figure 6. The confidence interval of the change point is 97% with the level 1 as clearly shown in Figure 7. Before the happening of the change point the Tmean is 28.3°C in the year 2007 and after change the Tmean is 27.7°C in the year 2009.
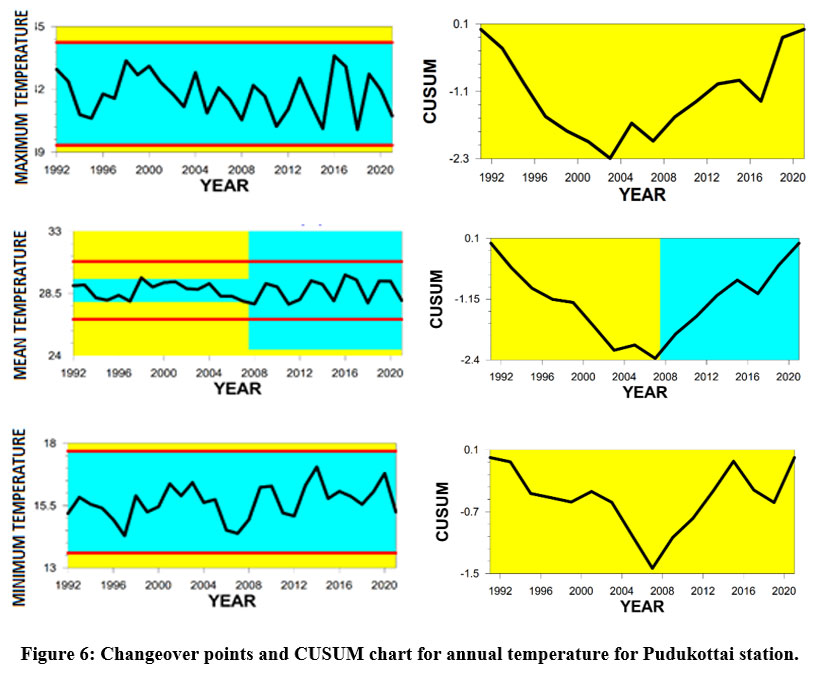 | Figure 6: Changeover points and CUSUM chart for annual temperature for Pudukottai station.
|
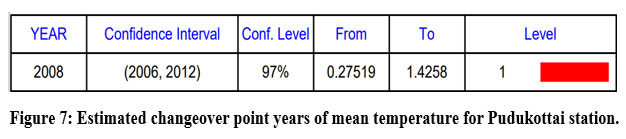 | Figure 7: Estimated changeover point years of mean temperature for Pudukottai station.
|
Conclusion
The variability of temperature is due to the anthropogenic activities which are related to industrial growth that changes the climate all over the basin. The non-parametric Man-Kendall trend test and change point detection test by Taylor were given a remarkable result about temperature change all over the basin. Most of the results from the two climate stations reveals that the higher, least, and average temperatures have a significant higher rising drift. Based on the Kundrakudi climate station results, the Tmean change point is occurred in the year 2008 at a confidence interval of 95% at level 1. The Tmin change point is occurred in the years 1998 and 2009 at a confidence interval of 92% and 96% and at level 3 and level 1 respectively. Based on the Pudukottai climate station results, in the year 2008, there is a climate jump identified in Tmean variable with a confidence interval of 97% with the level 1. The rapid variations in the land usage pattern and industrial growth alters the present climate and the cause for the increase in temperature. The basin is having less streamflow in the monsoon season and with a very long water scarce period with no streamflow prevailing drought condition. The results of climate based regional level study is indispensable for planning and management water bodies/ impoundments especially for the drought prone basins like Pambar and Kottakaraiyar. The climate change based adaptation strategies for the farmers, hydrologists, water resource managers is in need of the hour to counteract the effects of temperature increase, drought and heat waves.
Acknowledgements
The author acknowledges the vital help from the Centre for Water resources, Anna University for infrastructure support and providing internet facilities. The author sincerely thank the State ground and Surface Water Resources data centre, Chennai for providing data.
Funding Sources
The author received no financial grant or funding during the course of this research.
Conflict of Interest
The author declares no conflict of interest.
Data availability statement
The manuscript incorporates temperature datasets of two climate stations received from State ground and Surface Water Resources data centre was examined throughout this research study.
Ethics Approval Statement
The study does not involve any experiment on humans and animals.
References
- Pörtner H.O, Roberts D. C, Poloczanska E. S, Mintenbeck K, Tignor M, Alegría A, Craig M, Langsdorf S, Löschke S, Möller V, Okem A, Rama B. IPCC, 2022: Summary for Policymakers, In: Climate Change 2022: Impacts, Adaptation and Vulnerability. Contribution of Working Group II to the Sixth Assessment Report of the Intergovernmental Panel on Climate Change. Cambridge, UK and New York, NY, USA, Cambridge University Press. 2022: 3–33. doi:10.1017/9781009325844.001. (Accessed date 22 April, 2024).
CrossRef - Prasada Rao G. S. L. H. V, Rao G. G. S. N, Rao V. U. M. Climate change and agriculture over India. New Delhi. PHI Learning Private Limited. 2010: 1–42.
- Lass W, Haas A, Hinkel J, Jaeger C. Avoiding the avoidable: Towards a European heat waves risk governance. International Journal of Disaster Risk Science. 2011;2(1): 1– 14.
CrossRef - D'Ippoliti D, Michelozzi P, Marino C, et al. The impact of heat waves on mortality in 9 European cities: results from the EuroHEAT project. Environ Health. 2010; 9:37. Published 2010 Jul 16. doi:10.1186/1476-069X-9-37. (Accessed date 22 April, 2024).
CrossRef - Trancoso R, Syktus J, Toombs N, Ahrens D, Wong KK, Pozza RD. Heatwaves intensification in Australia: A consistent trajectory across past, present and future. Sci Total Environ. 2020;742:140521. doi:10.1016/j.scitotenv.2020.140521. (Accessed date 22 April, 2024).
CrossRef - Diffenbaugh, N. S, Ashfaq M. Intensification of hot extremes in the United States. Geophysical Research Letters.2010; 37(15): 1-5. https://doi.org/10.1029/2010GL043888. (Accessed date 22 April, 2024).
CrossRef - Lee, W. S, Lee, M. I. Interannual variability of heat waves in South Korea and their connection with large?scale atmospheric circulation patterns. International Journal of Climatology. 2016; 36(15): 4815-4830.
CrossRef - Ullah I. Ma X. Yin J. Saleem F. Syed S. Omer A. Arshad M. Observed changes in seasonal drought characteristics and their possible potential drivers over Pakistan. International journal of climatology. 2022;42(3): 1576-1596.
CrossRef - Klein Tank A. M. G, Peterson T. C, Quadir D. A, Dorji S, Zou X, Tang H, Santhosh K, Joshi U. R, Jaswal A. K, Kolli R. K, Sikder A. B, Deshpande N. R, Revadekar J. V, Yeleuova K, Vandasheva S, Faleyeva M, Gomboluudev P, Budhathoki K. P, Hussain A, Afzaal M, Chandrapala L, Anvar H, Amanmurad D, Asanova V. S, Jones P. D, New M. G, Spektorman T. Changes in daily temperature and precipitation extremes in central and south Asia. Journal of Geophysical Research: Atmospheres. 2006: 111(D16).
CrossRef - Ding T, Qian W, Yan Z. Changes in hot days and heat waves in China during 1961–2007. International Journal of Climatology. 2010;30(10):1452-1462.
CrossRef - Hu L, Huang G. The changes of high-temperature extremes and their links with atmospheric circulation over the Northern Hemisphere. Theoretical and applied climatology. 2020;139: 261-274.
CrossRef - Schiermeier Q. Climate change made North America's deadly heatwave 150 times more likely. Nature. 2021. https://doi.org/10.1038/d41586-021-01869-0. (Accessed date 22 April, 2024).
CrossRef - Turek-Hankins L. L, Coughlan de Perez E, Scarpa G, Ruiz-Diaz R, Schwerdtle P. N, Joe E. T, Galappaththi E. K, French E. M, Austin S. E, Singh C, Siña M. Climate change adaptation to extreme heat: a global systematic review of implemented action. Oxford Open Climate Change. 2021;1(1):1-13.
CrossRef - UN DESA. The Sustainable Development Goals Report 2023: New York, USA: UN DESA. 2023. https://unstats.un.org/sdgs/report/2023/. (Accessed date 22 April, 2024).
- Iyakaremye V, Zeng G, Ullah I, Gahigi A, Mumo R, Ayugi B. Recent observed changes in extreme high?temperature events and associated meteorological conditions over Africa. International journal of climatology. 2022;42(9):4522-4537.
CrossRef - Singh H, Dube A, Ashrit R, Srivastava P. K. Heat Waves over India during Mar-May 2022: An object-based approach to Forecasting and Verification.2023; 1-30.https://doi.org/10.21203/rs.3.rs-2486202/v1. (Accessed date 22 April, 2024).
CrossRef - National Water Mission report. Pambar Kottakaraiyar basin. 2017; 1-18. https://nwm.gov.in/sites/default/files/Pambar_report_final.pdf. (Accessed date 22 April, 2024)
CrossRef - CGWB Report on aquifer mapping and aquifer management plan for Pambar - Kottakaraiyar aquifer system, Tamil Nadu, Central ground water board Department of Water Resources, River Development and Ganga Rejuvenation, Ministry of Jal Shakti Government of India. 2018; 1-50. https://cgwb.gov.in/sites/default/files/2022-11/pambar_aquifer_system_tn.pdf. (Accessed date 22 April, 2024).
- Mann H. B. Non parametric tests against trend. Econometrica: Journal of the econometric society. 1945;13(3): 245-259.
CrossRef - Kendall M. G. Rank correlation methods. Charles Griffin, London. 1975.
- Theil H. A rank-invariant method of linear and polynomial regression analysis. Indagationes mathematicae. 1950;12(85):173.
- Sen P. K. Estimates of the regression coefficient based on Kendall’s tau. Journal of the American Statistical Association. 1968;63(324):1379.
CrossRef - Palaniswami Supriya, Muthiah Krishnaveni. Change point detection and trend analysis of rainfall and temperature series over the Vellar River basin. Polish Journal of Environmental Studies. 2018; 27(4): 1673-1681. DOI:https://doi.org/10.15244/pjoes/77080.
CrossRef - Taylor W. A. Change point analyzer 2.3 software package “Taylor enterprises, Libertyville, Illinois, 2000. http://www.variation.com/cpa/tech/changepoint. (Accessed date 22 April, 2024).


