Integrating Energy Efficiency in Residential Buildings: A User-Centric Web Interface Approach
1
Department of Mechanical Engineering,
Jadavpur University,
Kolkata,
West Bengal
India
2
Department of Mechanical Engineering,
Institute of Engineering and Management (IEM),
University of Engineering and Management,
Kolkata,
West Bengal
India
Corresponding author Email: gunjaniem@gmail.com
DOI: http://dx.doi.org/10.12944/CWE.19.3.14
Copy the following to cite this article:
Kumar G, De K, Roy A. G, Bag S. Integrating Energy Efficiency in Residential Buildings: A User-Centric Web Interface Approach. Curr World Environ 2024;19(3). DOI:http://dx.doi.org/10.12944/CWE.19.3.14
Copy the following to cite this URL:
Kumar G, De K, Roy A. G, Bag S. Integrating Energy Efficiency in Residential Buildings: A User-Centric Web Interface Approach. Curr World Environ 2024;19(3).
Download article (pdf)
Citation Manager
Publish History
Select type of program for download
| Endnote EndNote format (Mac & Win) | |
| Reference Manager Ris format (Win only) | |
| Procite Ris format (Win only) | |
| Medlars Format | |
| RefWorks Format RefWorks format (Mac & Win) | |
| BibTex Format BibTex format (Mac & Win) |
Article Publishing History
| Received: | 2024-05-21 |
|---|---|
| Accepted: | 2024-12-21 |
| Reviewed by: | 
 Shivendra Gowda
|
| Second Review by: |

 Mrutyunjay Padhiary
|
| Final Approval by: | Dr. Mohammad Owais |
Introduction
According to several technical reports and audits worldwide, buildings contribute to over a third of the world’s final energy consumption,1and operational energy loads are a significant contributor to the same. As per the GlobalABC Roadmap for Buildings and Construction published in 2020, the building industry directly or indirectly accounts for 36% of global energy use and 39% of global GHG emission release.2 Moreover, a study performed by the Alliance for an Energy-Efficient Economy (AEEE) revealed that India’s residential building floor space will increase from 15.3 billion m2 in 2017-18 to 21.9 billion m2 in 20273, further contextualizing and exacerbating the evolving scope of the problem.
Also, the BEE’s yearly report for 2018 found that stating that 75% of India’s electricity produced in 2017-18 was consumed by residential buildings.4 Not only is this because of inefficient design practices, but it is also because of the non-compliance of design parameters in the operational stage. This is largely due to the unavailability of design parameter references upon transfer of operations to occupants. The design modification approach has been validated through studies indicating that meeting the Eco-Niwas Samhita (ENS) 2018 and Energy Conservation Building Code (ECBC) 2017 envelope standards can achieve reductions of up to 26% in operational energy use and up to 36% in cooling energy requirements for high-rise residential buildings in warm and humid regions.9 The specific merits of implementing envelope redesign measures have been studied in Sadati et al. (2023) on an Iranian building, where it was found that usage of materials such as AAC blocks, LECA blocks and XPS among others resulted in annual reduction of up to 23.2% in heating loads, 26.4% in cooling loads and 18.5% in CO2 emissions.10
This research seeks to answer some key questions: How can the operational energy demand of the building be reduced? How can building design parameters be effectively documented? And, how can compliance be maintained in the operational stage? Based on a survey of the most recent literature and the observed gap, a data-driven digital approach powered by
comprehensive climate analysis and simulation 5-8 investigated in this study. This study utilizes Design Builder software for energy simulation running version 7.0.2.006 and climate analysis software climate consultant version 6.0.17 to develop the digital model of a high-rise residential building. A user-centric web-based interface for data capture and performance reporting will be developed using the Django 4.0.2 framework with an SQL database hosted on PythonAnywhere.
Materials and Methods
Methodology
The study zeroes in on Kolkata, India’s warm, humid climate with specific interest in traditional residential high rises.11,12 Base case and efficiency interventions were designed and simulated. Data was then fed to the digital user interface after on boarding users to generate building energy performance report and digital profile. Figure 1 demonstrates the details research methodology followed for this study.
.jpg) | Figure 1: Flowchart of overall methodology
|
Climate Analysis of Building Location
The residential building as mentioned in Table 1, located in Kolkata was designed in DesignBuilder and then climate analysis was done using Climate Consultant.13,14 Figure 2 shows the front and top view of model. Table 1 lists the geographical parameters provided for the same.
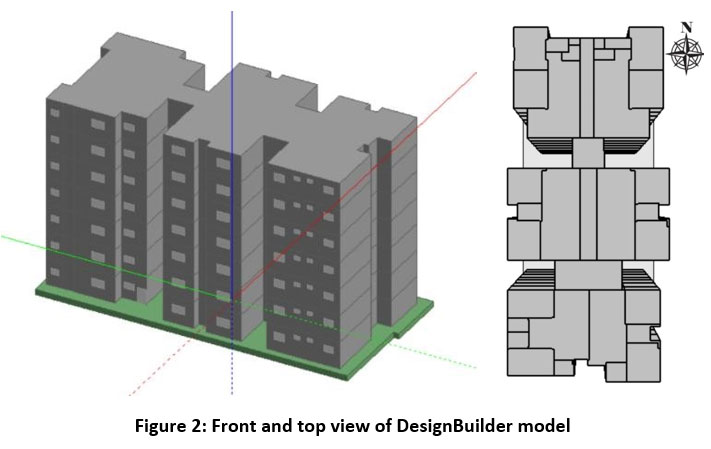 | Figure 2: Front and top view of DesignBuilder model
|
Table 1: Geographical parameters of studied building
Parameter | Value |
Location | Kolkata, India |
Building | G+7 High rise residential building |
Weather File Name | IND_Kolkata.428090_ISHRAE |
Climate Zone | Warm and Humid |
Latitude | 22.65°North |
Longitude | 88.45°East |
Hottest Annual | 43.9°C |
Coldest Annual Temperature | 5°C |
Temperature Elevation above Sea Level | 9.14m |
Average Annual Temperature | 26.8°C |
Annual Cumulative Horizontal Solar Radiation | 1521.7 kWh/m^2 |
Percentage Of Diffuse Horizontal Solar Radiation | 59.5% |
 | Figure 3: Shadow analysis and sun path of building
|
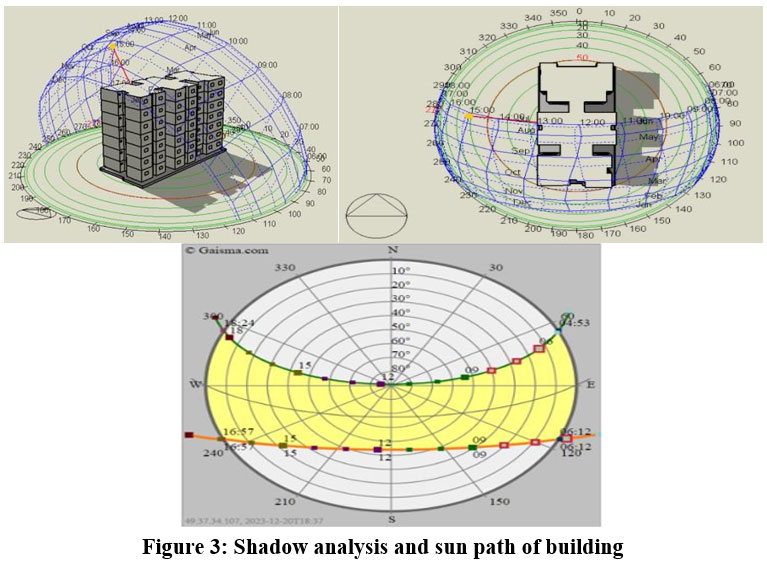
Figure 3 shows the shadow analysis was done assuming summer: April 08 (12:00pm – 3:00pm)- south-east orientation. It was observed that the southern and eastern side is sufficiently shaded throughout these harsh summer hours. Eastern side is mostly shaded because of the timing and the extended roof. The southern façade till 1:00pm completely shades the window, while during 2:00pm-3:00pm there is some exposure negligible. For the winter timing it is to be seen whether these huge south sunshades blocks winter sun.15
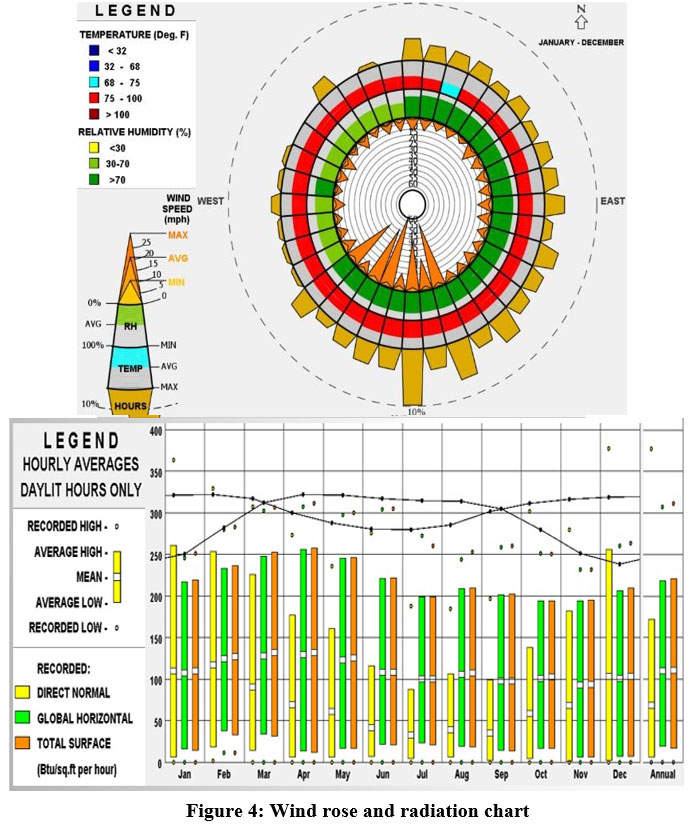
The Sun Path Diagram from Figure 3 indicates that April is the hottest month. Solar altitude is high (60-90 degrees) during the peak time between 12:00pm-3:00pm. Solar Azimuth is between 120-250 degrees. December is the coldest. Solar altitude is low (4-35 degrees) during the coldest period from 7:00am-10:00am. Solar Azimuth is between 118-145 degrees. From Figure 4, the wind rose diagram shows that winds predominantly are from north and south and mostly are hot. Hence, the best orientation for this climate solely in the point of view of radiation gain would be along north-south axis.
 | Figure 4: Wind rose and radiation chart
|
As per Radiation Chart in Figure 4, November-April has high direct normal radiation, that is from winter to the start of summer months. May and October approximately have equal amounts of direct and diffuse radiation. June marks the beginning where diffuse radiation reaches the surface more than direct. July- Aug has more diffuse radiation than direct radiation. Sept marks the beginning of the second reversal where direct radiation is more than the diffuse radiation. Peak summers has more direct radiation. Peak rainfall coincides with the increased diffuse radiation.
Building Energy Modelling and Simulation
The initial base case was framed as per typical construction practice in the project location, consisting of Red Brick Construction (RBC) for wall and roof. The design cases have changed wall material with three other available materials, namely RCC Slab, Fly Ash Brick and Autoclaved Aerated Concrete (AAC) Blocks. Similarly, roof material has been changed with two other available materials, namely RCC Slab and AAC Blocks. Thermal transmittance for each material was calculated and presented in table 2. For glass, market survey was done and two types of Single Glazed Unit (SGU) and three types of DoubleGlazed Unit (DGU) glass typically available for residential buildings were tested. The base case utilizes a simple SGU Glass while the design cases utilize several different models of glass manufactured by Saint Gobain. The input parameters for the building simulation of various design cases are given in Table 2 and Table 3, and Table 4 has a comprehensive summary of materials selected for each case.
Table 2: Building envelope design case 6-9
Case | Wall Materials | U value | Roof U value | SGU/DGU | SHGC | U value | VLT | Shading |
Unit | (W/m2K) | (W/m2K) | (W/m2K) | (%) | ||||
Base Case | Red Brick construction | 2.37 | 2.69 | SGU | 0.81 | 5.69 | 87 | NO |
CASE 1 | RCC | 3.17 | 3.77 | SGU | 0.68 | 5.6 | 67 | NO |
CASE 2 | RCC | 3.17 | 3.77 | DGU | 0.4 | 2.8 | 50 | NO |
CASE 3 | FLY ASH | 1.316 | 3.77 | SGU | 0.68 | 5.6 | 67 | NO |
CASE 4 | FLY ASH | 1.316 | 3.77 | DGU | 0.4 | 2.8 | 50 | NO |
CASE 5 | AAC Block | 0.498 | 3.77 | DGU | 0.4 | 2.8 | 50 | NO |
CASE 6 | AAC Block | 0.498 | 2.7 | DGU | 0.4 | 2.8 | 50 | NO |
CASE 7 | AAC Block | 0.498 | 1.2 | DGU | 0.4 | 2.8 | 50 | NO |
CASE 8 | AAC Block | 0.498 | 0.694 | DGU | 0.4 | 2.8 | 50 | 1.0 M |
CASE 9 | AAC Block | 0.498 | 0.694 | DGU | 0.27 | 1.8 | 36 | 1.0 M |
Table 3: Parameters for building systems 6,7,9,16,17
Category | Building Systems | Base case | Design cases | |
Lighting | Light Power Density | W/m2 | 7.53 | 4.53 |
Equipment | Equipment Power Density | W/m2 | 10.76 | 10.76 |
HVAC Systems | HVAC | System Type | Split A.C | Split A.C |
Efficiency (COP) | EER | 3.1 | 3.8 | |
Ventilation | Min. Fresh Air Required | l/S Per Person | 2.5 | 2.5 |
Occupancy | Occupant Densities | m2/Person | 12.50 | 12.50 |
The energy efficiency measures as applied in terms of building envelope materials for each of the design cases with full assembly details are given in Table 4.
Table 4: Building materials for each simulation case 6,7,9,18,19
Case | Building materials Wall, Roof, Glass |
Base Case | Wall- Red Brick Construction, U-Value: 2.37 W/m2k, Roof- Red Brick Construction, U Value: 2.67 W/m2k, Glass- SGU- U Value-5.69, SHGC-0.81, VLT-87 |
Case 1 | Wall-RCC Slab (235mm incl. 35mm Internal + External Cement Work), Roof- RCC Slab (177mm incl. 27mm Internal + External Cement Work), Glass- Saint Gobain Glass -ST 167(SGU)- U Value5.6, SHGC-0.68, VLT-67 |
Case 2 | Wall- RCC Slab (235mm incl. 35mm Internal + External Cement Work), Roof- RCC Slab (177mm incl. 27mm Internal + External Cement Work), Glass- Saint Gobain Glass -ST 467(DGU)- U Value2.8, SHGC- 0.4, VLT- 50 |
Case 3 | Wall- Fly Ash Brick (235mm incl. 35mm Internal + External Cement Work), Roof- RCC Slab (177mm incl. 27mm Internal + External Cement Work), Glass- Saint Gobain Glass -ST 167(SGU)- U Value-5.6, SHGC-0.68, VLT-67 |
Case 4 | Wall- Fly Ash Brick (235mm incl. 35mm Internal + External Cement Work), Roof- RCC Slab (177mm incl. 27mm Internal + External Cement Work), Glass- Saint Gobain Glass -ST 467(DGU)- U Value-2.8, SHGC- 0.4, VLT- 50 |
Case 5 | Wall- AAC Block (235mm incl. 35mm Internal + External Cement Work), Roof- RCC Slab (177mm incl. 27mm Internal + External Cement Work), Glass- Saint Gobain Glass -ST 467(DGU)- U Value2.8, SHGC- 0.4, VLT- 50 |
Case 6 | Wall- AAC Block (235mm incl. 35mm Internal + External Cement Work), Roof-RCC With Ceramic Tile (206.4mm incl. 54mm Internal + External Cement Work and Insulation), Glass- Saint Gobain Glass -ST 467(DGU)- U Value-2.8, SHGC- 0.4, VLT- 50 |
Case 7 | Wall- AAC Block (235mm incl. 35mm Internal + External Cement Work), Roof- RCC With Ceramic Tile (206.4mm incl. 54mm Internal + External Cement Work and Insulation), Glass- Saint Gobain Glass -ST 467(DGU)- U Value-2.8, SHGC- 0.4, VLT- 50 |
Case 8 | Wall- AAC Block (235mm incl. 35mm Internal + External Cement Work), Roof- RCC Slab (227mm incl. 27mm Internal + External Cement Work), Glass- Saint Gobain Glass -ST 467(DGU)- U Value- 2.8, SHGC- 0.4, VLT- 50 |
Case 9 | Wall- AAC Block (235mm incl. 35mm Internal + External Cement Work), Roof- Aerated Concrete |
Slab (227mm incl. 27mm Internal + External Cement Work), Glass- Saint Gobain Glass -KT 140(DGU)- U Value-1.8, SHGC- 0.27, VLT- 36 (12mm air gap) |
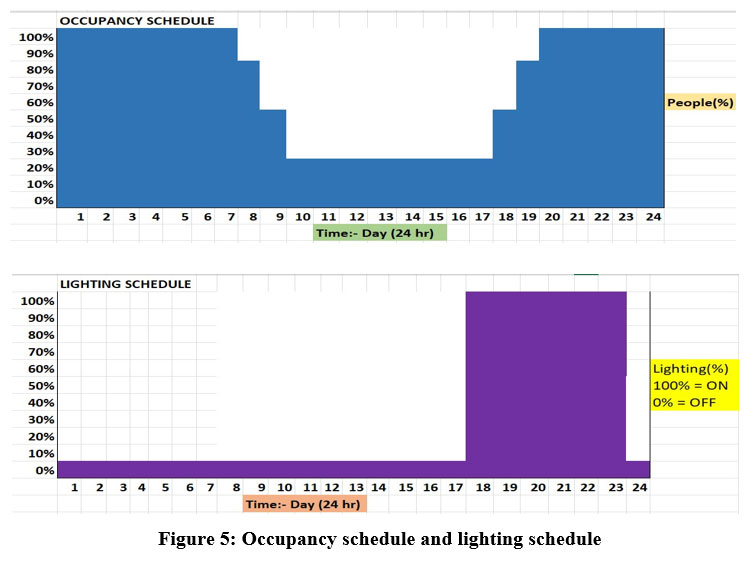 | Figure 5: Occupancy schedule and lighting schedule
|
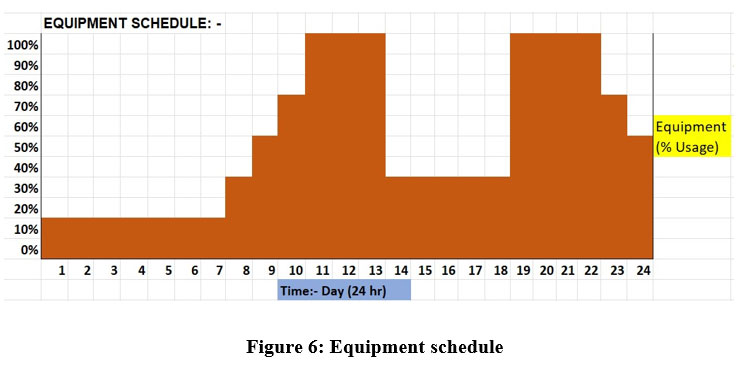 | Figure 6: Equipment schedule
|
Figures 5 and 6 graphically represent the building operation, lighting, and equipment schedule throughout the day respectively.
Web – Based Digital User Interface
The web portal has used Django, a Python-based backend framework alongside HTML and JavaScript, with CSS and Bootstrap for styling and an SQL database. The website and database have been hosted on PythonAnywhere. The static files have been hosted on AWS.Table 5 notes the data required for user onboarding and verification.
Table 5: Data required for user onboarding and verification
Parameter | Purpose |
Username | Onboarding |
Password | Onboarding |
Name | Identification |
Email | Verification and Communication |
Location | Benchmarking and Verification |
ID Proof Selection (e.g., Aadhaar Card) | Verification |
ID Proof Number (e.g., Aadhaar Card No.) | Verification |
Address Proof Selection (e.g., Voter ID Card) | Verification |
Address Proof Number (e.g., Voter ID Card No.) | Verification |
The website encompasses a range of features designed to provide a comprehensive and userfriendly experience. A secure login and registration system allow users to register their properties without divulging personal data, ensuring privacy. The implementation of an email system facilitates communication for registration, password resets, and benchmark results, enhancing user engagement. Each user is granted a personalized dashboard, fostering a tailored experience and easy management of their property-related information. Additionally, a dedicated admin dashboard provides specialized tools for efficient administration.Table 6 notes the operational energy input parameters.20,21
Table 6: Data and inputs collected for operational energy benchmarking and report
Parameter | Unit/Data |
Category | BHK |
Name | N/A |
Area | Sq. Ft. |
Rooms | Number |
Occupants | Number |
Appliances | Number, Type, Make, Model & Rating |
Annual Consumption | Units |
Annual Bill | INR |
Month – wise Consumption for Last 3 Years | Units |
The database functionality enables the listing of flats, creating a structured repository of property information. The benchmarking feature enhances user insights by comparing properties against others in the same category and historical data. Detailed data collection, including appliance data, ensures a thorough understanding of consumption patterns. A dedicated benchmark page for each flat presents a comprehensive overview, featuring past consumption metrics, Energy Performance Index (EPI), and per-occupant consumption data.
Figure 7 shows the user experience for onboarded users in the form of a flowchart.
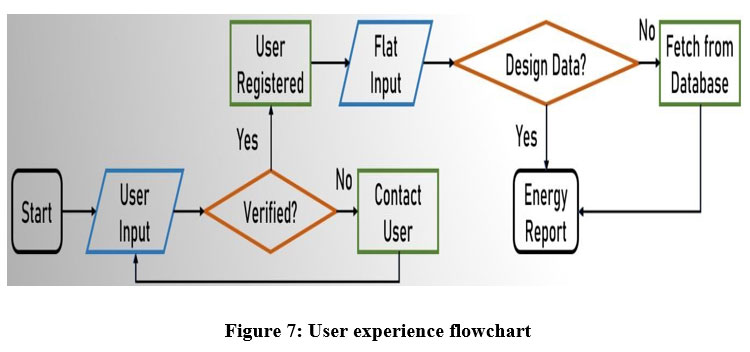 | Figure 7: User experience flowchart
|
Result and Discussion
Operational Energy Performance of Base Case
A digital model of a G+7 residential building located in Kolkata, India, using DesignBuilder software was successfully created. The comprehensive climate analysis was performed to narrow down the factors that must be accounted for occupant comfort throughout the year and to size HVAC, lighting, equipment, and other loads accordingly. Shadow analysis, sun path, wind rose, and comfort analysis were performed with climate consultant software. The base case of the building envelope was constructed with commonly used, low-cost building materials. Both the wall and roof are made of red brick, and the glass is a commonly available single-glazed unit (SGU). This yielded a base-case EPI of 125.93 kWh/m2/year.
Table 7 shows annual EPI values for the base case and all design cases.
Table 7: Annual energy performance index (EPI) for base and design Cases
Simulation Case | Energy Performance Index (kWh/m2/Year) |
Base case | 125.93 |
Design case_1 | 113.30 |
Design case_2 | 111.13 |
Design case_3 | 103.85 |
Design case_4 | 101.15 |
Design case_5 | 95.10 |
Design case_6 | 94.12 |
Design case_7 | 91.95 |
Design case_8 | 91.28 |
Design case_9 | 90.01 |
Operational energy reduction through envelops energy efficiency measures
The first design case swapped the red bricks in both the wall and roof for RCC Slab construction, and the glass was changed to slightly more efficient ST 167 SGU. This immediately resulted in a 10.05% improvement over the baseline. In Cases 3 and 4, fly ash bricks were used for the wall assembly. Henceforth, all wall assemblies will have 20mm external and 15mm internal cement plaster. In case 4, Saint Gobain ST 467 Double Glazed Unit (DGU) glass was used. This yielded a 17.50% and 19.64% improvement over baseline in cases 3 and 4, respectively.Case 5 represents a significant improvement in the design's operational energy performance, with a 24.45% improvement over the baseline. This is made possible by swapping fly ash bricks in the wall assembly with AAC blocks.Case 6 changes the roof assembly to a 12mm ceramic tile exterior, 30mm cement mortar, 152.4mm RCC, and 12mm cement plaster, giving a 25.22% improvement over the baseline. Case 7 adds insulation to it and further improves energy performance up to 27.96%.In Case 8, wall assemblies were kept fixed with ACC blocks, and energy efficiency measures were applied to the roof assembly with an improved construction layer that utilises 15mm external cement plaster, 200mm of aerated concrete Slab, and 12mm internal cement plaster, yielding a 27.56% improvement over baseline.In the most improved proposed design case 9, the wall and roof construction were kept from the previous improved design case and efficient glass material changed with specification KT 140 DGU with a 12mm air gap, giving us our best EPI of 90.01 kWh/m2/year, which is a 28.55% improvement over baseline. Figure 8 represents this progressive energy performance improvement as a bar chart.
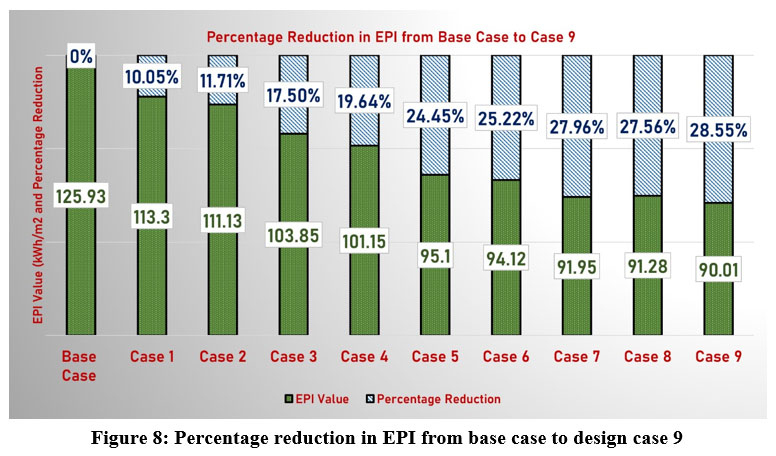 | Figure 8: Percentage reduction in EPI from base case to design case 9
|
Web – Based Digital Interface with Performance Report
Figure 9 is a screenshot from the web portal highlighting the difference in energy load between the optimum presented Design Case and the presented Base Case. The developed portal [Link: refficalc.pythonanywhere.com] is successfully taking user input, onboarding them, and capturing the design input parameters as intended. The portal has been hosted on PythonAnywhere. It is capable of giving a detailed performance report, from energy performance compliance to per-occupant consumption, energy performance index, and building performance against flats in the same category. The user manual provided by this portal will help to achieve energy efficiency and control the behavioural impact of operational energy demand.
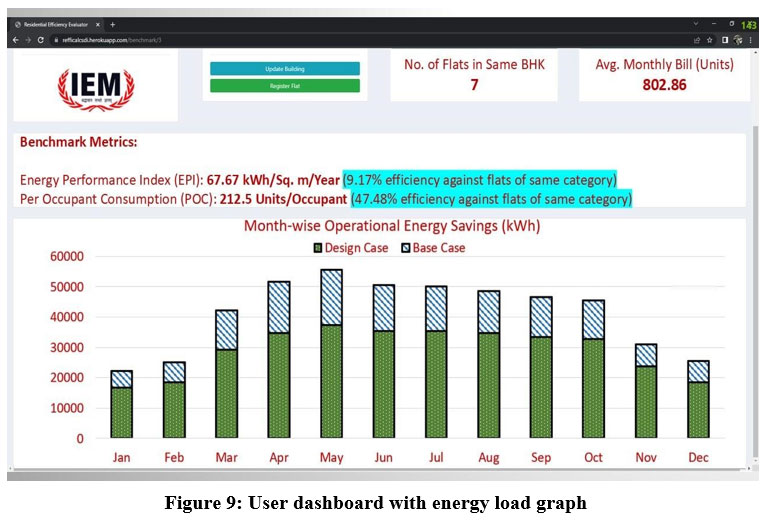 | Figure 9: User dashboard with energy load graph
|
Conclusion
In this study, various building envelope material’s effect on a building’s operational energy is evaluated. The web portal has been developed using Python’s Django framework and SQL. The energy efficiency measures proposed have achieved a significant improvement in energy efficiency, and the developed web portal has enabled a seamless transition of the building from the design stage to operation. Proposed design Case 9, with the combination of AAC block walls, an aerated concrete Slab roof, and highly efficient double-glazed glass, achieved an EPI of 90.01 kWh/m2/Year, which is 28.55% better than the base case. The web portal successfully onboarded users and captured design data input and month-wise energy load data. However, the results reported in this paper are only applicable to the city of Kolkata and the warm and humid climate zones, but the methodology applied is generic and applicable irrespective of location and climate zone. Also, as any redesign or retrofit for the purpose of improving energy efficiency comes with a significant cost component, a detailed cost-benefit analysis of the initial capital expenditure and return-on-investment for any such redesign will be addressed as part of the future scope of this work.
Acknowledgement
The authors would like to acknowledge the Institute of Engineering & Management (IEM), Kolkata, for funding this research. The authors would also like to acknowledge the Climate change research center of excellence, IEM Salt Lake, Kolkata, for allowing utilization of their equipment and software for this research work.
Funding Sources
IEMT(S)/2022/G/April/13-G02
Conflict of Interest
The authors declare that they have no known competing financial interests or personal relationships that could have appeared to influence the work reported in this paper.
Data Availability Statement
The manuscript incorporates all datasets produced or examined throughout this research study are available on request from the corresponding author.
Ethics Statement
The study doesn’t involve experiments on human and animals.
Informed Consent Statement
This study did not involve human participants, and therefore, informed consent was not required.
Author Contributions
Gunjan Kumar: Conceptualization, Result analysis, Review & Editing, Formal analysis
Kausar De: 1st Draft Writing, Web development, Flowcharts, Graphics
Ayan Guha Roy- Energy Simulation
Subhajit Bag- Data Collection and Building Modelling
References
- Torres Gonzalez M., Lombard M.P., Perez L., Coronel L., Maestre J.F., Yan D I.R. A review on buildings energy information: trends, end-uses, fuels, and drivers. Energy Rep. 2022;8(1):626-637.
CrossRef - GlobalABC, IEA. UNEP. GlobalABC Roadmap for buildings and construction: Towards a zero emission, efficient and resilient buildings and construction sector. Global Status Report for Buildings and Construction. 2020. https://globalabc.org/sites/default/files/inline-files/2020%20Buildings% 20GSR_FULL% 20REPORT.pdf
- Kumari A, Suman S, Garg T. Substantiating the Scope of Code: Eco-Niwas Samhita. Alliance for an Energy-Efficient Economy (AEEE); 2021.
- Bureau of Energy Efficiency (BEE). Eco-Niwas Samhita (Energy Conservation Building Code for Residential Buildings) Part I: Building Envelope. 2018. https://www.beeindia.gov.in/sites/default/files/ECBC_BOOK_Web.pdf
- Arjunan P., Poolla K., Miller C. EnergyStar++: towards more accurate and explanatory building energy benchmarking. Appl Energy. 2020;8(1):626-637.
CrossRef - Kumar G., Thakur B., De S. Investigation of energy performance of a high-rise residential building in Kolkata through performance levels of Energy Conservation Building Code, 2017. Proc 7th Int Conf Adv Energy Res. 2021;3(1):505-513.
CrossRef - Kumar G., De S., Thakur B. Wall and air conditioner combination for the best energy and economic performance: methodology demonstration for high-rise residential buildings. Energy Convers Manag.2024; 300:117909.
CrossRef - Chegari B., Tabaa M., Simeu E., Moutaouakkil F., Medromi H. Multi-objective optimization of building energy performance and indoor thermal comfort by combining artificial neural networks and metaheuristic algorithms. Energy Build.2021; 239:110839.
CrossRef - Kumar G., Thakur B., De S. Energy performance of typical large residential apartments in Kolkata: implementing new energy conservation building codes of India. Clean Technol Environ Policy. 2021; 23:1251-1271.
CrossRef - Sadati SE, Rahbar N, Kargarsharifabad H. Energy assessment, economic analysis, and environmental study of an Iranian building: The effect of wall materials and climatic conditions. Sustain Energy Technol Assess. 2023;56:103093.
CrossRef - Ariyaratne R.G.R.N.K., Karunathilake H.P., Punchihewa H.K.G. Effect of envelope energy performance enhancement strategies on building energy loads: case study for a tropical institutional building. Energy Build. 2022;8(1):626-637.
CrossRef - Kostic N., Petrovic N. Optimization of low-rise building geometrical forms in Design Builder. Cent Qual. 2014;8(1):626-637.
- Pawar B.S., Kanade G.N. Energy optimization of building using Design Builder software. Int J New Technol Res. 2018;3(4):263-152.
- Grange Vilà L. Energy audit of the Bellvitge UB Health Science Campus through Design Builder. Master’s thesis, Universitat Politècnica de Catalunya; 2018.
- Geraldi M.S., Gnecco V.M., Neto A.B., de Mafra Martins B.A., Ghisi E., Fossati M., Lamberts R. Evaluating the impact of the shape of school reference buildings on bottom-up energy benchmarking. J Build Eng. 2021; 43:103142.
CrossRef - ?oropoc M., Tokar A., Tokar D., Cinca M., Oprea M.F. Comparative study of two heating/cooling systems for an office building using Design Builder software. Rev Rom Ing Civ. 2023; 1:1-13.
CrossRef - Elshafei G., Negm A., Bady M., Suzuki M., Ibrahim M.G. Numerical and experimental investigations of the impacts of window parameters on indoor natural ventilation in a residential building. Energy Build. 2017; 141:321-332.
CrossRef - García Y., Cuadrado J., Blanco J.M., Roji E. Optimizing the indoor thermal behaviour of housing units in hot humid climates: analysis and modelling of sustainable constructive alternatives. Indoor Built Environ. 2019; 28(6):772-789.
CrossRef - Hong W.Y., Rahmat B.N.N.M.N.L. Energy consumption, CO2 emissions and electricity costs of lighting for commercial buildings in Southeast Asia. Sci Rep. 2022; 12(1):13805.
CrossRef - Gupta G., Mathur S., Mathur J., Nayak B.K. Blending of energy benchmarks models for residential buildings. Energy Build. 2023; 292:113195.
CrossRef - Gupta G., Mathur S., Mathur J., Nayak B.K. Comparison of energy-efficiency enchmarking methodologies for residential buildings. Energy Build. 2023; 285:112920
CrossRef


