Assessment of Soil Fertility of different Landform of Jiyadhol River basin in Dhemaji District, Assam
Rituparna Saikia1
 , Dilip Kumar Patgiri2
 , Bipul Deka3
 , Prem Kumar Bharteey4
*
 , Marami Dutta2
 , Sanjib Ranjan Borah5
 and Deepsikha Gogoi6

1
SMS, Krishi Vigyan Kendra,
Kamrup,
Guwahati,
Assam
India
2
Department of Soil Science,
Assam Agricultural University,
Jorhat,
Assam
India
3
AICRP on IWM,
Assam Agricultural University,
Jorhat,
Assam
India
4
Department of Agricultural Chemistry and Soil Science,
C.C.R. (P.G.) College,
Muzaffarnagar,
Uttar Pradesh
India
5
Assam Rice Research Institute,
Assam Agricultural University,
Titabar-Jorhat,
Assam
India
6
Department of Agronomy,
BNCA, Assam Agricultural University,
Biswanath, Chariali,
Assam
India
Corresponding author Email: prembharti406@gmail.com
DOI: http://dx.doi.org/10.12944/CWE.19.3.8
Copy the following to cite this article:
Saikia R, Patgiri D. K, Deka B, Bharteey P. K, Dutta M, Borah S. R, Gogoi D. Assessment of Soil Fertility of different Landform of Jiyadhol River basin in Dhemaji District, Assam. Curr World Environ 2024;19(3). DOI:http://dx.doi.org/10.12944/CWE.19.3.8
Copy the following to cite this URL:
Saikia R, Patgiri D. K, Deka B, Bharteey P. K, Dutta M, Borah S. R, Gogoi D. Assessment of Soil Fertility of different Landform of Jiyadhol River basin in Dhemaji District, Assam. Curr World Environ 2024;19(3).
Download article (pdf)
Citation Manager
Publish History
Select type of program for download
| Endnote EndNote format (Mac & Win) | |
| Reference Manager Ris format (Win only) | |
| Procite Ris format (Win only) | |
| Medlars Format | |
| RefWorks Format RefWorks format (Mac & Win) | |
| BibTex Format BibTex format (Mac & Win) |
Article Publishing History
| Received: | 2024-10-14 |
|---|---|
| Accepted: | 2025-01-03 |
| Reviewed by: | 
 Reza Sokouti
|
| Second Review by: |

 Pramoda Govindaraju
|
| Final Approval by: | Dr. P A Azeez |
Introduction
Soil is an essential component of the biosphere and has a wide range of roles in the life of every living being on the planet.1 A fertile soil nurtures the growth of living organisms.2 It stores nutrients and performs a variety of biological functions.3 Therefore, we must define soil production based on its ability to provide essential nutrients to plants.4 This nutrient shortage is caused by changes in land use type, land management strategies, and soil types.5 Soils contain the most carbon after oceans and geological ponds globally.6 Soil plays an important role in the terrestrial carbon cycle.7 Soil organic matter is an important regulator of biogeochemical cycling and soil fertility.8 The primary macronutrients include nitrogen, phosphorous and potassium, and secondary nutrients include sulphur, calcium, and magnesium.9 Therefore, plant development plays a crucial role in maintaining the environment and enhancing agricultural productivity. Earth'sphysical, chemical, and biological factors combine to determine the capacity of soil to support crops, and we refer to this as soil fertility.10 Therefore, soil fertility is an essential factor in determining the yield of crops. Here, we discover the macro and micronutrients that are involved in the regulation of soil fertility and crop yield.11 One of the challenges affecting crop production is the erratic use of fertilizers, which leads to reduced nutrients in the soil.A soil fertility assessment serves as the foundation for decision-making when establishing a strategy for a specific land use system.12 Crop growers need to acquire a deeper understanding of soil fertility prospects to address challenges that may arise during crop farming, sustain crop production, and exchange more agricultural technology initiatives. Our goal is to develop ways to enhance the nutrient requirements and generally enhance crop yields. The purpose of this study is to explore the soil in a recently developed area with a modern method. Geographic Information System (GIS) and remote sensing are effective tools for managing vast amounts of data and can facilitate statistical analysis. Consequently, around exists a important potential to improve the precision of soil surveys through the use of GIS applications. Researchers11 are discussed the study of the differences in the soil physico-chemical characteristics of the soil in different locations in the Moridhal watershed in Dhemaji district of Assam.The fertility status of soils in five villages of different clusters in Lahowal block, Dibrugarh, Assam is also evaluated.13 The Brahmaputra Valley constitutes a segment of the Brahmaputra River system in Northeast India, with an area of 56,570 km². This valley was created during the Pleistocene and was subsequently shaped by sediments transported from the Assam Plateau to the south and the Assam Himalayas to the north. Currently, the Jiyadhol River Basin is one of the least explored river basins in Assam; however, the riverflows fast during monsoon and results in disastrous floods in the regions nearby. The Brahmaputra River Originate from the eastern part of the Dhemaji district of the state of Assam and joins with KherkatiaSuti, one of the Brahmaputra’s distributaries. The Jiyadhol river basin is composed of many landforms and is highly susceptible to erosion. To some extent, this research seeks to analyse the erosional behaviour of the Jiyadhol River.
Material And Methods
Site description of study area
Jiyadhol River basin,situated in the Dhemaji district of Assam (Fig. 1), extends from 27.33°N to 27.57°N latitudes and 94.29°E to 94.54°E longitudes, covering an area of 47,389.13 ha. The River basin is a sub-tributary on the Northern bank of the Brahmaputra River, which flows into the Charikoria River. The river traverses the West Siang district of Arunachal Pradesh and the Dhemaji district of Assam. It is bordered to the west and north by the Subansiri sub-basin and to the west by the Moridhal sub-basin. The Jiyadhol river basin has a humid climate, with an average annual precipitation of 3041.8 mm. The mean annual temperature, mean maximum temperature, and mean minimum temperature are 23.3°C, 28.6°C, and 18.0°C, respectively. The mean relative humidity in the region is 82.6 per cent. The examined region was classified as having hyperthermic soil temperatures and a Udic moisture regime.
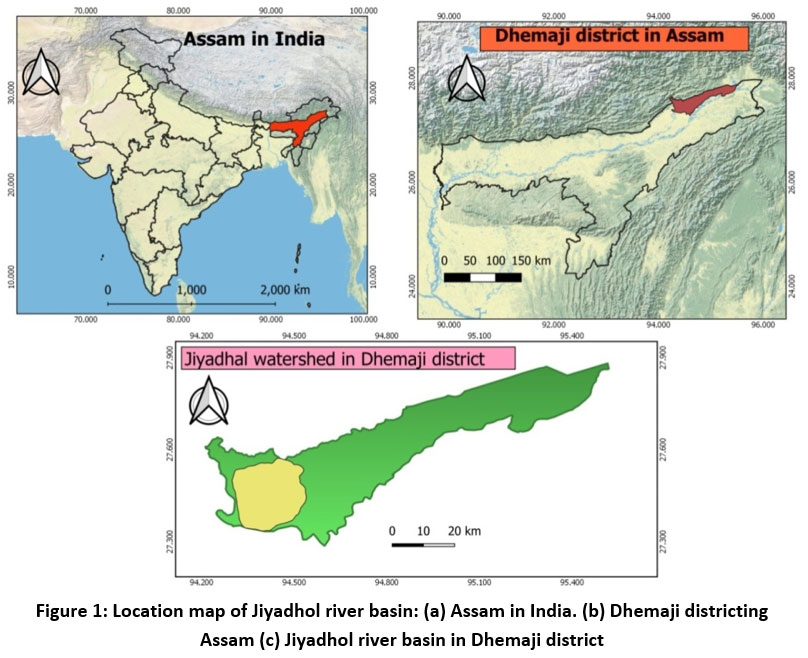 | Figure 1: Location map of Jiyadhol river basin: (a) Assam in India. (b) Dhemaji districting Assam (c) Jiyadhol river basin in Dhemaji district
|
River basin delineation, collection, processing and analysis of soil
Using Geocoded FCC of LANDSAT 08 OLI TRIS data was visually analysed along side Survey of India toposheets (1:50,000) to outline the Jiyadhol river basin (code D2BBRU79).Four landform units were delineated (Fig. 2). Sampling sites were determined based on GPS coordinates. Surface and core soil samples collected from each landform unit to a depth of 0-30 cm. A total of 170 surface soil samples, as depicted in the soil sampling locations map (Fig. 3), were collected for examination. The number of surface soil samples representing various landform units were 32, 35, 51, and 52 from the Piedmont Plain, upper alluvial plain, lower alluvial plain, and flood plain, respectively. The obtained surface samples were air-dried, ground, and sieved through a 2 mm mesh.The samples were examined for soil parameters, including Bulk density, particle density and porositywere determinedby pycnometer14, available water content by the field capacity-permanent wilting point method by pressure plate15,Soil reaction (pH) by pH electrode meter and electrical conductivity by EC meter16, Cation exchange capacity by vacuum pressure method17, organic carbon through the wet oxidation method18, available nitrogen by potassium permanganate method19, phosphorus by spectrophotometer20 and potash using flammable photometer with normal neutral ammonium acetate as an extractant21, Soluble calcium and magnesium by Versenate titration method as described by researcher.16 All soil analyses were done in the Department of Soil Science, Assam Agricultural University.
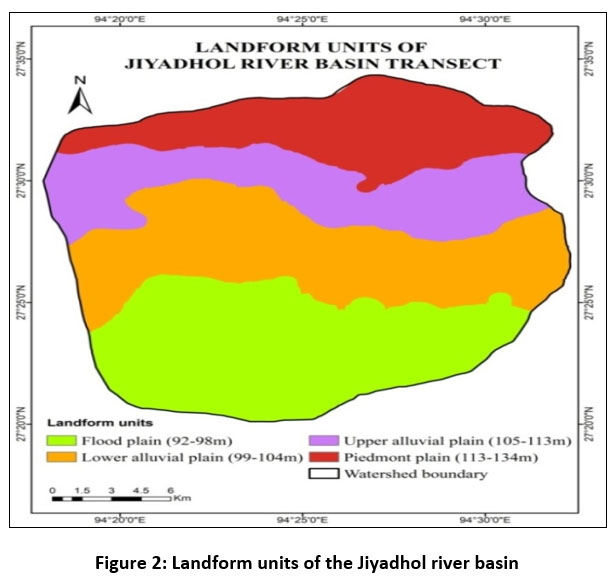 | Figure 2: Landform units of the Jiyadhol river basin
|
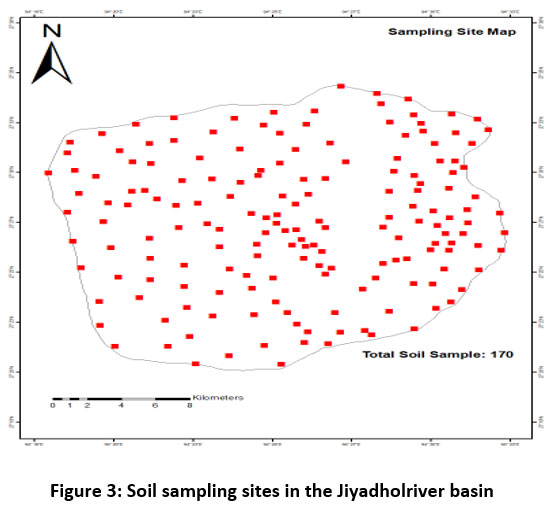 | Figure 3: Soil sampling sites in the Jiyadholriver basin
|
Statistical and geo-statistical analysis
Statistcal analysis was used for Snedecor and Cochran's22 technique. These analyses included maximum, minimum, mean, median, coefficient of variation, Skewness, Kurtosis, correlation and principal component analysis. GIS 10.4.3 version software was used to conduct spatial analysis. Specifically, grid construction was performed in GIS software, and then contour functions were used on the map to highlight geographical variance. Different levels of spatial variation were distinguished by the use of a color legend. The management zones for different parameters of the Jiyadhol river basin were delineated using the conventional soil fertility evaluation method.
Results and Discussion
Physical Properties
Among the physical characteristics, the bulk density (BD) reflects soil compaction changes in response to land use and soil management measures.23 In the present study, the BD of the studied soils varied from 1.10-1.68 Mg m-3 (Table 1). The variability across the locations in Jiyadhol was quite low, as showed by the value of the coefficient of variation (CV = 10.83%). This is a good piece of information as BD is a property that has been consistently reported to have low variability. The CV in the present investigation is a little higher mainly because the present study area is much more heterogeneous than plain agricultural fields or tea estates24, etc. Among the landform units, a definite descending trend of BD was observed from the Piedmont Plain (PP) towards the Flood Plain (FP) (Table 1). The dominance of finer particles, particularly clay, in FP may be linked to lower BD of the corresponding soils. Moreover, the significant negative influence of organic matter (r= -0.511, p < 0.05) on BD was evident from the correlation analysis25 (Fig.9).
Table 1: Landform unit-wise distribution of physical properties of soils in Jiyadhol river basin
Parameters | Min. | Max. | Mean | Median | St Dev | CV(%) | Skew. | Kurt. |
Piedmont Plain | ||||||||
BD (g cm-3) | 1.11 | 1.68 | 1.49 | 1.53 | 0.13 | 9.02 | -1.16 | 1.18 |
PD (g cm-3) | 2.33 | 2.7 | 2.55 | 2.56 | 0.08 | 3.31 | -1.03 | 1.66 |
Porosity (%) | 35.6 | 52.3 | 41.6 | 40.9 | 4.2 | 10.2 | 0.87 | 0.49 |
FC (%) | 3.9 | 27.8 | 11.9 | 11.1 | 5.1 | 42.6 | 1.04 | 1.56 |
PWP (%) | 1 | 10.4 | 3.8 | 3.2 | 2.5 | 64.6 | 1.3 | 1.22 |
AWC (%) | 2.4 | 17.3 | 8.1 | 7.5 | 3.2 | 39.3 | 0.83 | 0.98 |
Upper Alluvial Plain | ||||||||
BD (g cm-3) | 1.1 | 1.62 | 1.41 | 1.41 | 0.12 | 8.24 | -0.24 | 0.32 |
PD (g cm-3) | 2.22 | 2.63 | 2.47 | 2.5 | 0.11 | 4.49 | -0.64 | 0.2 |
Porosity (%) | 34 | 54.9 | 42.7 | 42.6 | 4.2 | 9.7 | 0.43 | 1.11 |
FC (%) | 5.7 | 25.6 | 15 | 16 | 5.1 | 34.3 | -0.1 | -0.67 |
PWP (%) | 1 | 10.8 | 5.2 | 4.7 | 2.7 | 51.6 | 0.46 | -0.53 |
AWC (%) | 4.2 | 17.3 | 9.8 | 9.7 | 3.3 | 33.4 | 0.37 | 0.12 |
Lower Alluvial Plain | ||||||||
BD (g cm-3) | 1.1 | 1.65 | 1.39 | 1.39 | 0.16 | 11.64 | -0.02 | -1.07 |
PD (g cm-3) | 2.17 | 2.7 | 2.47 | 2.5 | 0.14 | 5.79 | -0.32 | -1.09 |
Porosity (%) | 33.8 | 55.2 | 43.8 | 44.9 | 4.8 | 10.9 | 0.03 | -0.45 |
FC (%) | 6 | 27.7 | 14.8 | 12.6 | 6.6 | 44.5 | 0.36 | -1.23 |
PWP (%) | 0.7 | 13.3 | 5.4 | 4.3 | 3.6 | 66.9 | 0.49 | -0.97 |
AWC (%) | 3.4 | 18.1 | 9.4 | 8.1 | 3.9 | 42 | 0.68 | -0.71 |
Flood Plain | ||||||||
BD (g cm-3) | 1.11 | 1.64 | 1.37 | 1.33 | 0.16 | 11.52 | 0.21 | -1.28 |
PD (g cm-3) | 2.17 | 2.71 | 2.43 | 2.38 | 0.14 | 5.79 | 0.41 | -0.77 |
Porosity (%) | 33.6 | 51.6 | 43.9 | 43.6 | 4.4 | 10.1 | -0.32 | -0.37 |
FC (%) | 2 | 28.3 | 17.1 | 17.7 | 6.4 | 37.7 | -0.16 | -0.65 |
PWP (%) | 0.6 | 13.8 | 6.5 | 7.4 | 3.8 | 59.2 | 0.06 | -1.27 |
AWC (%) | 1.1 | 18.1 | 10.6 | 11 | 3.7 | 34.5 | -0.31 | -0.08 |
Whole River Basin | ||||||||
BD (g cm-3) | 1.1 | 1.68 | 1.41 | 1.42 | 0.15 | 10.83 | -0.18 | -1.01 |
PD (g cm-3) | 2.17 | 2.71 | 2.48 | 2.5 | 0.13 | 5.35 | -0.29 | -0.87 |
Porosity (%) | 33.6 | 55.2 | 43.2 | 43.2 | 4.5 | 10.4 | 0.15 | -0.39 |
FC (%) | 2 | 28.3 | 15 | 14.5 | 6.2 | 41.4 | 0.26 | -0.86 |
PWP (%) | 0.6 | 13.8 | 5.4 | 4.4 | 3.4 | 63.4 | 0.53 | -0.82 |
AWC (%) | 1.1 | 18.7 | 9.6 | 9.3 | 3.7 | 38.4 | 0.37 | -0.45 |
In line with the presented results, earlier studies by researchers29 reported a negative role of organic matter and porosity content on soil bulk density. Furthermore, several researchers earlier recorded a strong negative correlation between soil organic matter and bulk density30,31 due to organic matter particles beingless dense than soil mineral particles, andthat means the soils with more organic matter tend to have lower bulk density. Particle density (PD) is influenced by the relative proportions of constituent minerals and humus. PD values of the soils were mostly within a narrow range. Among the studied soil samples, a slight variation in PD was observed, with a CV of 5.35 per cent, reflecting homogeneity in the constituent minerals (Table 1). The PD ranged from 2.17-2.71. The lowest PD was recorded for the soils collected from FP, and the highest wasat PP (Table 1). This could be explained in light of the fact that soils from FP had greater amounts of finer particles as well as soil organic matter with lower inherent mass per unit volume, whereas greater sand content and lower soil organic matter in PP areassociated with higher mass per unit volume. This is further substantiated by its strong negative correlation with soil organic matter (SOM) (r = -0.549, p < 0.05). This followed previous observations as reported by researchers.27,28 Soil porosity is the ratio of nonsolid volume to the total volume of soil. The porosity, as well as pore size distribution in the soil, significantly influences field capacity, permanent wilting point and available water capacity32,33 and, as such, the entire regime of available water. Porosity in the studied soils of the Jiyadhol river basin varied in the range of 33.6-55.2 per cent, with an average of 43.2 per cent (Table 1). Similar to BD and PD, porosity also exhibited relatively low variation (CV=10.4 per cent) among the collected soil samples. Among the landform units, a gradual increase of porosity from PP towards FP was observed (Table 1). Organic matter being highly porous showed a positive significant influence (r= 0.403, p < 0.05) on porosity. The soil water content at field capacity is excellent information that determines the capacity of the soils to retain water against the forces that tryto draw water out of the soils, thus affecting crop growth and development. In the studied soils, the moisture content at field capacity (FC) widely varied across the sampling locations, with a CV of 41.4 per cent (Table 1). The computed value lies between 2.0-28.3 per cent with a mean and median value of 15.0 and 14.5 per cent, respectively. FC behaved in a similar pattern with the WHC of soils. Among different landform units, FC varied in the range 3.9-27.8 (mean 11.9), 5.7-25.6 (mean 15.0), 6.0-27.7 (mean 14.8), 2.0-28.3 (mean 17.1) per cent in PP, UAP, LAP and FP soils respectively (Table 1). As evident from existing correlations, BD (r= -0.716, p < 0.05) and PD (r = -0.621, p < 0.05) negatively affected FC, whereas SOM content (r= 0.592, p < 0.05) and soil porosity (r = 0.568, p < 0.05) positively affected it (Fig.9). Water retained by the soils at 15 bar of suction is designated as the water content at PWP. Theoretically, this signifies the lowest value of water availability to plants. However, except only the sunflower plant no other plant can survive such a low level of water content in soils. No plant has that much of a high capacity to overcome the level of 15 bar of suction to draw water from soils. Hence, the water content at this level shows a characteristic feature of the soil’s ability to withstand the negative forces that are drawing out water. As indicated by the high coefficient of variation of 63.4 per cent, moisture content at the permanent wilting point (PWP) exhibited wide variability in the range of 0.59-13.82 per cent,and the mean and median values were 5.4 and 4.4 per cent, respectively. This high variation may be ascribed to heterogeneity in soil texture and SOM content across different sampling locations.Among different landform units, PWP varied in the range of 1.0-10.4 (median 3.2), 1.0-10.8 (median 4.7), 0.7-13.3 (median 4.3), 0.6-13.8 (median 7.4) per cent in PP, UAP, LAP and FP soils respectively (Table 1). This is further substantiated by the strong positive correlation of PWP with SOM content (r= 0.606, p < 0.05) (Fig.9). Available water content (AWC) is the difference between soil moisture at FC and PWP. Notably, it signifies the range of soil water content a plant can utilize to meet its evapotranspiration demand. Therefore, AWC plays a crucial role in crop productivity. In the current investigation, AWC in soil seemed to follow a similar trend as other water retention properties of soil viz., moisture content at FC and PWP. AWC in soil varied in the range of 1.06-18.65 per cent with a mean value of 9.61 per cent (Table 1). Among various landform units, AWC tends to increase from PP towards FP (Table 1). The highest AWC at FP may be ascribed to the presence of higher SOM contents, as substantiated by its significant positive correlation with SOM (r= 0.414, p < 0.05) in the studied soils10.The spatial variability maps of physical properties (BD, PD, Porosity, FC, PWP, AWC)are presented in figure 4.
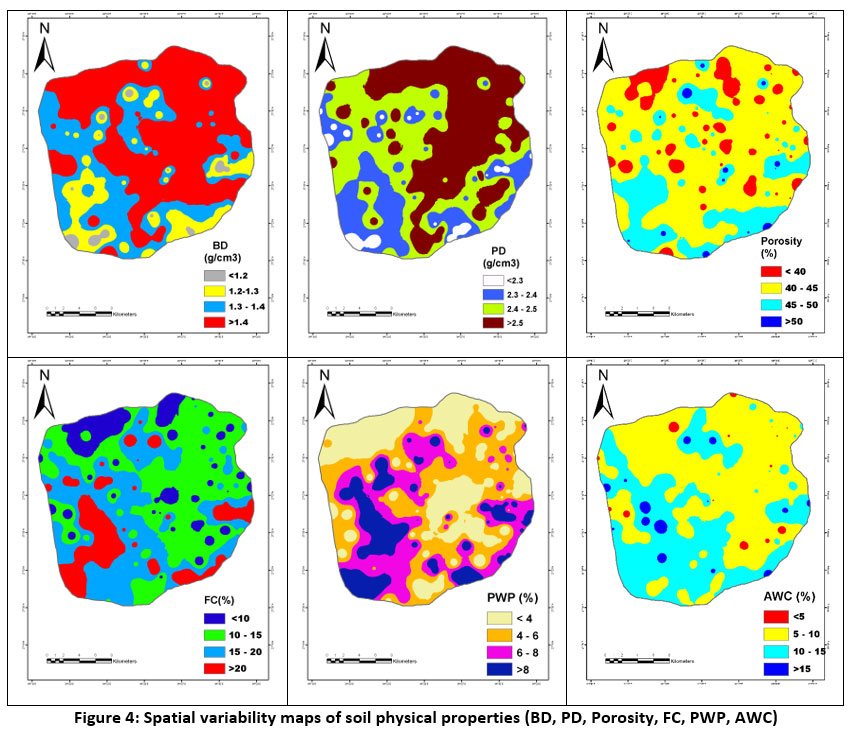 | Figure 4: Spatial variability maps of soil physical properties (BD, PD, Porosity, FC, PWP, AWC)
|
Chemical Properties
In general, the soils of Assam and, for that matter entire North-East India are acidic. The soil acidity has been regarded as one of the major hindrances in increasing the productivity of these soils, as it limits the availability of many nutrients, of which the phosphorus is main. Thus, the investigation of soil pH is an essential element in any soil study. The pH of the soils of the study area in the Jiyadhol river basin ranged from strongly acidic (4.69) to near neutral (6.47) (Table 2),due to the heavy rainfall, it receives each year, unlike other hydraulic properties, pH in the basin showed quite a low range of variability with a low coefficient of variation of 7.28 per cent. Moreover, the standard deviation was 0.39. The acidic soil reaction in the studied region could be ascribed to leaching down of basic cations owing to high annual rainfall at more than 3000 mm. Variation in soil reaction in the study area was geospatially mapped (Fig 5). Out of the total area, 69.35 per cent area was under the strongly acidic category,followed by the moderately acidic category (25.75 per cent). The SOM content in soil showed a negative influence on soil pH (r= -0.323, p< 0.05) (Fig.9). This may be ascribed in light of the fact that the decomposition of SOM produces organic acid, which shifts the pH to the lower side. The pH did not show any influence on available N and K2O but negatively affected available P2O5. The presented results are consistent with the previous reports by researchers.34,35 The electrical conductivity (EC) of the studied soils varied from 0.011 to 0.15 dS m-1 (Table 2). The negligible EC of the river basin is ascribed to the presence of negligible amounts of basic cations,viz., Ca2+, Mg2+ and Na+ in soils.
Table 2: Landform unit-wise distribution of chemical and fertility-related parameters of soils in the Jiyadhol river basin
Parameters | Min. | Max. | Mean | Median | St Dev | CV(%) | Skew. | Kurt. | |
Piedmont Plain | |||||||||
pH | 4.76 | 6.02 | 5.39 | 5.4 | 0.37 | 6.95 | -0.06 | -1.2 | |
EC (dS m-1) | 0.02 | 0.12 | 0.06 | 0.04 | 0.03 | 47.2 | 0.58 | -0.8 | |
OM (%) | 0.54 | 1.68 | 0.94 | 0.88 | 0.31 | 33.2 | 0.7 | -0.2 | |
CEC (cmol (p+) kg-1) | 3.3 | 13.3 | 5.7 | 4.9 | 2.4 | 42.4 | 1.4 | 2 | |
BS (%) | 42.4 | 68.2 | 56.4 | 57.2 | 7.5 | 13.3 | -0.1 | -1.1 | |
AVN (kg ha-1) | 75.3 | 401.4 | 149 | 144.3 | 63.7 | 42.8 | 2.1 | 7.2 | |
AVP (kg ha-1) | 14.1 | 52.6 | 29.9 | 30.8 | 10.3 | 34.4 | 0.2 | -0.8 | |
AVK (kg ha-1) | 47.6 | 258.1 | 109.8 | 95.9 | 58.4 | 53.2 | 1 | 0.2 | |
Ca | [cmol (p+) kg-1] | 0.9 | 4.1 | 1.77 | 1.45 | 0.81 | 45.7 | 1.2 | 1.1 |
Mg | 0.6 | 3.1 | 1.21 | 1.1 | 0.53 | 44.1 | 2.25 | 5.2 | |
Na | 0.09 | 0.46 | 0.17 | 0.17 | 0.07 | 42.8 | 2.14 | 7.2 | |
K | 0.02 | 0.06 | 0.03 | 0.03 | 0.01 | 34.6 | 1.15 | 0.3 | |
Upper Alluvial Plain | |||||||||
pH | 4.75 | 6.14 | 5.36 | 5.34 | 0.37 | 6.9 | 0.52 | -0.4 | |
EC (dS m-1) | 0.02 | 0.09 | 0.05 | 0.04 | 0.03 | 51.2 | 0.39 | -1.5 | |
OM (%) | 0.55 | 2.17 | 1.18 | 1.15 | 0.38 | 32.4 | 0.6 | 0.2 | |
CEC (cmol (p+) kg-1) | 3.7 | 12.8 | 6.7 | 5.8 | 2.6 | 39.6 | 1 | -0.2 | |
BS (%) | 42 | 63.6 | 50.5 | 49.9 | 5.1 | 10.1 | 0.7 | 0.2 | |
AVN (kg ha-1) | 78.6 | 376.3 | 193.2 | 175.6 | 88.7 | 45.9 | 0.4 | -0.8 | |
AVP (kg ha-1) | 15.4 | 52.6 | 34.4 | 34.6 | 9.1 | 26.4 | 0.1 | 0 | |
AVK (kg ha-1) | 47.6 | 241.2 | 127 | 126.6 | 49.7 | 39.1 | 0.7 | 0.2 | |
Ca | [cmol (p+) kg-1] | 0.9 | 4.1 | 1.91 | 1.7 | 0.9 | 47 | 1.05 | 0.2 |
Mg | 0.5 | 2.5 | 1.27 | 1.1 | 0.52 | 40.7 | 0.62 | -0.5 | |
Na | 0.09 | 0.43 | 0.22 | 0.2 | 0.1 | 45.9 | 0.45 | -0.8 | |
K | 0.02 | 0.06 | 0.04 | 0.04 | 0.01 | 32.2 | 0.52 | -0.7 | |
Lower Alluvial Plain | |||||||||
pH | 4.69 | 6.47 | 5.32 | 5.32 | 0.4 | 7.6 | 0.68 | 0.37 | |
EC (dS m-1) | 0.01 | 0.15 | 0.07 | 0.08 | 0.03 | 44.3 | 0.05 | -0.01 | |
OM (%) | 0.54 | 2.78 | 1.34 | 1.22 | 0.62 | 46.5 | 0.7 | -0.4 | |
CEC (cmol (p+) kg-1) | 4.3 | 13.6 | 8.3 | 7.5 | 2.7 | 33.1 | 0.4 | -1.3 | |
BS (%) | 33.3 | 66 | 50.8 | 50.8 | 7.7 | 15.2 | 0.2 | -0.2 | |
AV N (kg ha-1) | 87.8 | 444.3 | 230.8 | 225.8 | 120 | 52 | 0.4 | -1.3 | |
AVP (kg ha-1) | 16.7 | 52.6 | 34.4 | 34.6 | 10.9 | 31.6 | 0 | -1.2 | |
AVK (kg ha-1) | 47.6 | 284.4 | 154.2 | 152.9 | 61.8 | 40.1 | 0 | -0.9 | |
Ca | [cmol (p+) kg-1] | 0.9 | 4.3 | 2.38 | 2.3 | 0.96 | 40.4 | 0.29 | -0.9 |
Mg | 0.5 | 3.2 | 1.57 | 1.5 | 0.63 | 40 | 0.63 | -0.32 | |
Na | 0.1 | 0.51 | 0.26 | 0.26 | 0.14 | 52 | 0.41 | -1.3 | |
K | 0.02 | 0.06 | 0.05 | 0.04 | 0.01 | 26.7 | -0.25 | -1.3 | |
Flood Plain | |||||||||
pH | 4.7 | 6.19 | 5.37 | 5.28 | 0.41 | 7.6 | 0.53 | -0.7 | |
EC (dS m-1) | 0.02 | 0.14 | 0.06 | 0.07 | 0.03 | 45.5 | 0.64 | 0.45 | |
OM (%) | 0.58 | 2.85 | 1.48 | 1.42 | 0.58 | 39.1 | 0.4 | -0.8 | |
CEC (cmol (p+) kg-1) | 3.3 | 13.5 | 8.7 | 9.7 | 3.1 | 36.1 | -0.2 | -1.2 | |
BS (%) | 41.8 | 67.3 | 51 | 51.1 | 6.8 | 13.3 | 0.5 | -0.6 | |
AVN (kg ha-1) | 76.3 | 464.1 | 245.6 | 213.2 | 114.8 | 46.7 | 0.5 | -1 | |
AVP (kg ha-1) | 18 | 52.6 | 35.8 | 35.9 | 10.3 | 28.7 | 0.1 | -1 | |
AVK (kg ha-1) | 47.6 | 293.2 | 160.2 | 157.3 | 75.2 | 47 | 0.1 | -1.3 | |
Ca | [cmol (p+) kg-1] | 0.9 | 4 | 2.53 | 2.85 | 0.98 | 38.7 | -0.38 | -1.21 |
Mg | 0.6 | 3.2 | 1.58 | 1.45 | 0.67 | 42.3 | 0.77 | -0.02 | |
Na | 0.09 | 0.53 | 0.28 | 0.24 | 0.13 | 46.7 | 0.52 | -1 | |
K | 0.02 | 0.06 | 0.05 | 0.05 | 0.01 | 28.6 | -0.42 | -1.16 | |
Whole River Basin | |||||||||
pH | 4.69 | 6.47 | 5.35 | 5.32 | 0.39 | 7.28 | 0.46 | -0.47 | |
EC (dS m-1) | 0.01 | 0.15 | 0.06 | 0.06 | 0.03 | 47.4 | 0.42 | -0.24 | |
OM (%) | 0.54 | 2.85 | 1.27 | 1.15 | 0.55 | 43 | 0.82 | 0 | |
CEC (cmol (p+) kg-1) | 3.2 | 13.6 | 7.5 | 6.6 | 2.9 | 39.5 | 0.42 | -1.1 | |
BS (%) | 33.3 | 68.1 | 51.9 | 51.1 | 7.2 | 13.9 | 0.32 | -0.43 | |
AVN (kg ha-1) | 75.2 | 464.1 | 212.2 | 175.6 | 108.8 | 51.3 | 0.75 | -0.59 | |
AVP (kg ha-1) | 14.1 | 52.6 | 33.9 | 33.7 | 10.3 | 30.4 | 0.07 | -0.86 | |
AVK (kg ha-1) | 47.6 | 293.2 | 142.1 | 135.3 | 65.9 | 46.4 | 0.38 | -0.89 | |
Ca | [cmol (p+) kg-1] | 0.9 | 4.3 | 2.21 | 2.1 | 0.97 | 43.8 | 0.35 | -1.09 |
Mg | 0.5 | 3.2 | 1.44 | 1.3 | 0.62 | 42.9 | 0.93 | 0.26 | |
Na | 0.09 | 0.53 | 0.24 | 0.2 | 0.12 | 51.2 | 0.75 | -0.59 | |
K | 0.02 | 0.06 | 0.04 | 0.04 | 0.01 | 31.7 | 0.07 | -1.37 | |
Soil organic matter (SOM) is an important factor influencing soil quality and productivity. 26,37Although SOM accounts for just 1-5 per cent of the soil mass, it exerts great influence on soil function and properties and, thus, is vital for soil health management. Notably, SOM is the greatest natural resource of organic carbon and a massive repository of all critical nutrients. Moreover, it regulates soil physical and hydrological properties. SOM in the current study was in the range of 0.54-2.85 per cent, and the mean value was 1.27 per cent. As illustrated by the relatively higher coefficient of variation at 43.03 per cent, SOM content in soils exhibited wide spatial variability across the sampling locations in the Jiyadhol river basin. Moreover, the geospatial assessment revealed that out of the total area of 47389.1 ha, 56.4 per cent had moderately low SOM, and 43.3 per cent had relatively high SOM (Fig 5). Apart from this, the 119.2 ha area spread over a few pockets had very high SOM (>2.5 per cent). As the area is subjected to frequent flush floods, there may be deposition of higher SOM when the flood water recedes, leading to a relatively higher accumulation of SOM in these pockets. Among the landform units, the highest SOM content persisted noted in soils of FP (mean 1.48 per cent), and the lowest value was recorded in PP (mean 0.94 per cent) soils (Table 1). SOM showed an increasing trend from areas with high elevation towards lower elevation areas. This increase may be ascribed to the washing down of SOM and finer particles by the action of water current from higher to lower altitude and their subsequent deposition in the floodplain. Furthermore, higher clay content induces the formation of clay-OM complex; hence higher clay content imparts stability to SOM, thereby reducing its loss by high decomposition rates. The presence of dominant clay fractions provides increased surface charge density, which is a crucial condition for growing soil organic carbon39. These interpretations may be further substantiated by a strong positive correlation of SOM with elevation (r= -0.402, p < 0.05). As expected, SOM influenced most of the phyisco-chemical as well as hydrological properties of the studied soils. It had negatively influenced BD (r=-0.558, ) and PD (r=-0.549, p < 0.05) but had a positive influence on water retention characteristics viz., soil porosity (r=0.403, p < 0.05), FC(r=0.592, p < 0.05), PWP (r=0.606, p< 0.05) and AWC (r=0.414, p < 0.05) in studied soils (Fig.9).These findings corroborate with the previous reports of researchers35,36 in soils at various locations in Assam. Cation exchange capacity (CEC) is a soil's ability to exchange cations, an essential soil attribute that influences soil structural stability, nutrient availability, soil reactivity, and the soil's responsiveness to fertilizers and other ameliorants.The CEC of the studied soils was found in the range of 3.27-13.61 cmol (p+) kg-1 (Table 2). Among the landform units, the mean value of CEC tends to increase from PP towards FP. The FP soils exhibited higher CEC (8.65 cmol (p+) kg-1), followed by lower and upper alluvial plains (8.26 and 6.69 cmol (p+) kg-1) and least was recorded in soils of PP. A strong correlation of CEC with clay (r= 0.859, p < 0.05) and SOM content (r= 0.602, p < 0.05) divulged the reason for higher CEC in FP soils ((Fig.9)) which are associated with higher clay as well as SOM content. The spatial variability maps of chemical properties (pH, EC, CEC, OC, BS) are presented in figure 5.
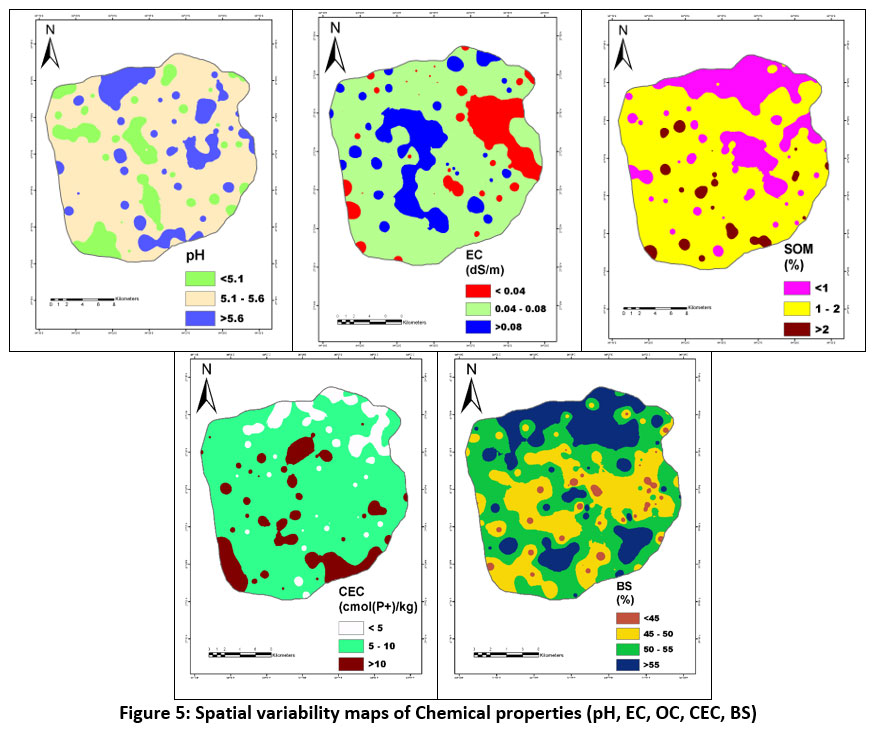 | Figure 5: Spatial variability maps of Chemical properties (pH, EC, OC, CEC, BS)
|
Nutrient properties
The available Nitrogen content (AVN) of soils in the current study varied from 75.2 to 464.1 kg ha-1 with a mean value of 212.2 kg ha-1 (Table 2). The average AVN of different landform units were found to be 149.0, 193.2, 230.8 and 245.6 kg ha-1 in soils of PP, UAP, LAP and FP, respectively (Table 2). Moreover, AVN exhibited high variability within the landform units. The corresponding CV values are 42.8, 45.9, 52.0 and 46.9 per cent in PP, UAP, LAP and FP, respectively. The higher AVN in FP soils could be explained in light of higher SOM content in the corresponding soils, which is apparent from correlation analysis (Table 2). Accordingly, SOM positively influenced AVN in soils (r=0.732, p < 0.05 ), but higher elevation had a negative influence on AVN (r=-0.352, p < 0.05) (Fig.9). It suggests that higher the SOM content higher the nitrogen availability in soils. Higher SOM pools are associated with increased formation rates of plant-available nitrogen via net nitrogen mineralization. Moreover, the quantity and quality of Soil organic matter affects soil nitrogen availability to plants. The distribution of AVN within the river basin was geospatially assessed and mapped (Fig 6), which revealed that 18.3, 30.2, 34.5 and 17.0% of the total area had AVN in the range of <150, 150-200, 200-272 and >272 kg ha-1 respectively. Available phosphorus content (AVP) in the soils of the Jiyadhol river basin was in the low to medium range. It varied from 14.11-52.58 kg ha-1 (Table 2). 17 per cent of the collected samples were in the low range (less than 22 kg P2O5 ha-1). No distinct relationship between available phosphorous and the landform units was noticed in the studied soils; however, FP soils had relatively higher AVP as compared with other landform units.The corresponding values of AVP are 29.9, 34.4, 34.4, and 35.8 kg ha-1 in soils of PP, UAP, LAP and FP, respectively (Table 2). The distribution of AVP within the landforms was geospatially assessed and mapped (Fig 6), which revealed that 2.4, 46.0, 45.9 and 5.6% of the total area had AVP in the range of <22.5, 22.5-34, 34-45 and >45 kg ha-1 respectively (Fig.6). In general the available potassium (AVK) in all the soils were found to be low to medium. This is the general trend of distribution of K in Assam soil.39 The AVK of the soils studied in theJiyadhol river basin showed a medium extent of variation (CV=46.42 per cent) in the range from low to medium (47.6 to 293.2 kg ha-1) (Table 2). Geospatial assessment of the river basin (Fig. 6) in the GIS environment revealed that 54.3% of the total area had AVK in the medium range (136-236 kg ha-1). Only 1.6% of the total area had AVK in the high range, and 28.5 and 15.7% area had AVK in the low range,viz., 100-136 kg ha-1 and <100 kg ha-1, respectively. Available soil potassium in different landform units were 109.8 kg ha-1, 127.0 kg ha-1, 154.2 kg ha-1, and 160.2 kg ha-1 in soils of PP, UAP, LAP and FP, respectively (Table 2). Higher AVK in FP soils may be attributed to higher clay and SOM contents, which impart higher CEC to hold a greater amount of exchangeable K in soils. In contrast, PP soils had higher amount of sand and lower amount of clay and SOM contents. Higher sand content increased macro-porosity thereby facilitating water transmission through soils, which in turn increases leaching of K from soils. This is consistent with the Pearson correlation analysis results. A strong positive correlation was recorded between AVK and SOM content (r= 0.274, p < 0.05) and CEC (r= 0.404, p < 0.05) (Fig.9). Inconsistent with these results, researchers38 also obtained a positive relationship of AVK with organic carbon, Similar results were also recorded by researchers.34 The spatial variability maps of nutrient properties (N, P, K, Ca, Mg) are presented in Figure 6.
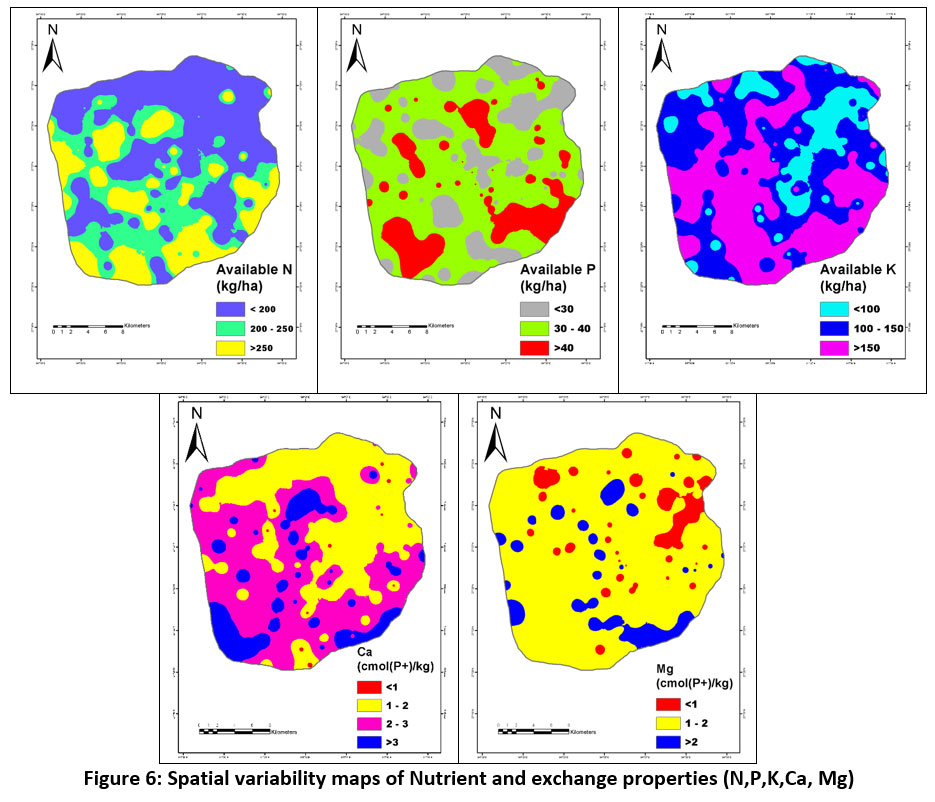 | Figure 6: Spatial variability maps of Nutrient and exchange properties (N,P,K,Ca, Mg)
|
Exchangeable cations
Exchangeable basic cations viz., Ca2+, Mg2+, K+ and Na+ in the soils of the Jiyadhol river basin varied in the range of 0.90-4.30, 0.50-3.20, 0.09-0.53, 0.064-0.021 cmol (p+) kg-1 respectively (Table 2). As evident from the results, Ca2+ was the predominant cation (mean 2.21cmol (p+) kg-1) followed by Mg2+ (mean 1.44 cmol (p+) kg-1), and K+ (mean 0.24 cmol (p+) kg-1), and Na+ was the least prevalent cation (mean 0.042 cmol (p+) kg-1) among the analyzed soil samples. Among the landform units, the highest concentration of all the studied cations was recorded in FP soils (Table 2), followed by soils of alluvial plains and relatively lower concentrations were recorded in soils of PP. Exchangeable cations seemed to follow clay content, as illustrated by their strong positive correlation with clay and significant negative correlation with sand and silt (Table 2). Moreover, all the studied cations were positively influenced by CEC, indicative of the role of CEC on their retention and availability to plants. Exchangeable basic cations,viz., Ca2+, Mg2+, K+ and Na+, are significantly increased withincreasing the CEC of soils;hence, soils with high CEC are considered to be more fertile as they can retain more of these cations. Soils with a low CEC are more likely to develop deficiencies in exchangeable cations and, for that matter, their fertility, while high CEC soils are less susceptible to leaching of these cations (CUCE, 2007).
Network analysis
The color band (based on 'r' values) in the network of diverse soil physico-chemical and nutritional parameters represents the strength of linkage (Fig. 7). Broader lines imply a strong association (both positive and negative), while narrower lines indicate a weaker correlation. Available nitrogen was only found to be positively linked with SOM content. It was nearly perfectly and negatively linked with pH and BD. Significant negative correlations of PD with parameters like SOM, FC, porosity and PWP, the available P negative correlation with pH, BD and PD,and a positive correlation with available K, Porosity and Ca were also seen. The BD hada strongly negative correlation with SOM and Porosity.
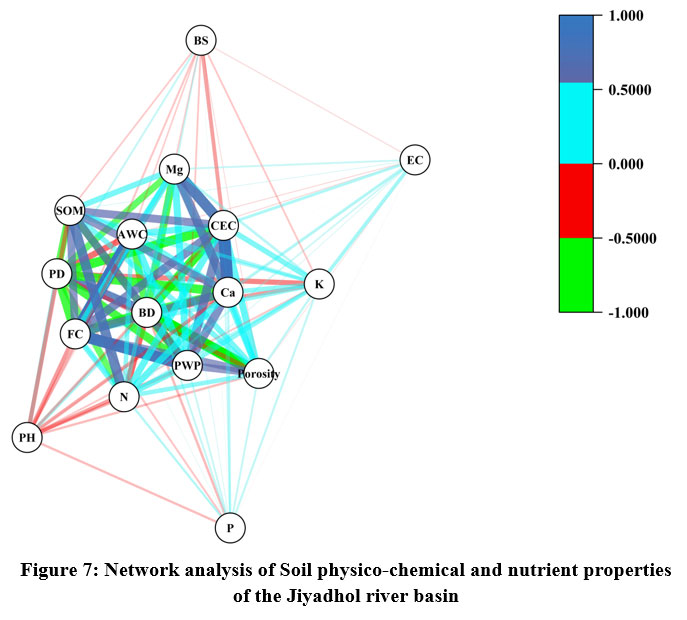 | Figure 7: Network analysis of Soil physico-chemical and nutrient properties of the Jiyadhol river basin
|
Principal component analysis
The outcomes PCA using KMO statistical method indicated that the analyzed 16 soil properties weresuccessfully accounted for by the three major components whose Eigen values were more than 1.5, which accounts for 60.49% variation in the soil parameters (Table 3), the first three components, namely PCA1 (44.40%), PCA2 (8.86%) and PCA3 (7.23%). 3D biplot shows the four quadrants (Fig.8); Porosity, FC, PWP, AWC, available N, P, K, Ca, and Mg show positive loaded on PCA1. BD, PD, pH and BS show negative loaded on PCA1. The more or less loaded on PCA2 and PCA3.
Table 3: Principal component analysis of soil physico-chemical and nutrient analysis of Jiyadhol river basin
Parameters | PCA1 | PCA2 | PCA3 |
Eigenvalue | 7.104 | 1.418 | 1.157 |
Variance (%) | 44.402 | 8.860 | 7.234 |
Cumulative(%) | 44.402 | 53.262 | 60.496 |
BD | -0.876 | 0.215 | -0.084 |
PD | -0.789 | -0.096 | 0.052 |
Porosity | 0.675 | -0.356 | 0.152 |
FC | 0.868 | -0.259 | -0.132 |
PWP | 0.840 | -0.094 | -0.036 |
AWC | 0.685 | -0.351 | -0.189 |
PH | -0.367 | 0.091 | 0.405 |
EC | 0.128 | 0.790 | 0.020 |
CEC | 0.881 | 0.263 | 0.159 |
SOM | 0.748 | 0.070 | -0.120 |
BS | -0.166 | -0.212 | 0.611 |
N | 0.641 | 0.157 | -0.141 |
P | 0.208 | -0.161 | -0.213 |
K | 0.443 | 0.421 | -0.270 |
Ca | 0.830 | 0.209 | 0.269 |
Mg | 0.692 | 0.119 | 0.531 |
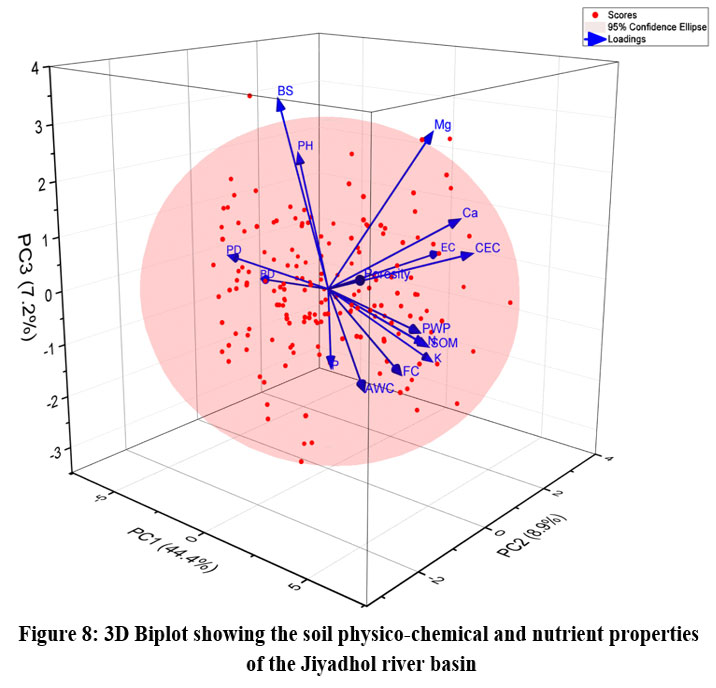 | Figure 8: 3D Biplot showing the soil physico-chemical and nutrient properties of the Jiyadhol river basin
|
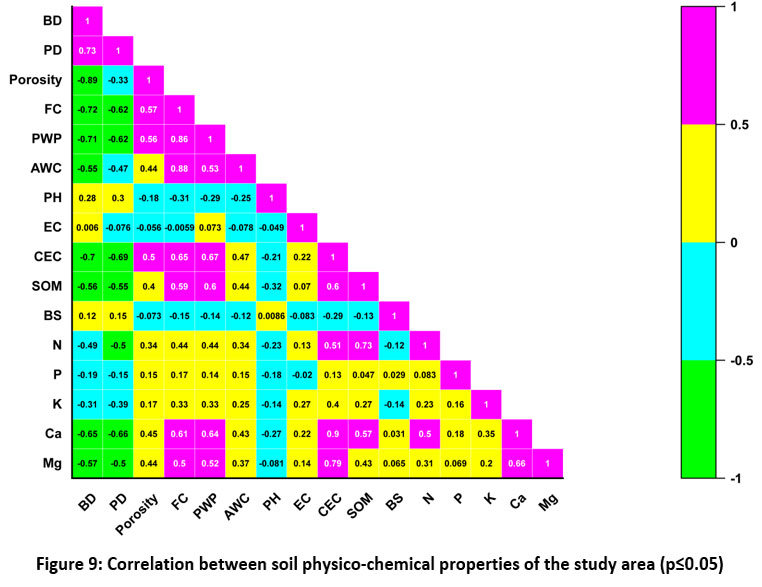 | Figure 9: Correlation between soil physico-chemical properties of the study area (p< 0.05).
|
Conclusions
The current study deliberate the status of several physico-chemical and nutrient properties of the Jiyadhol river basin and showed wide spatial variability. Four land forms units were delineated. The fertility showed out of the total area, 69.35 per cent area was under the strongly acidic category, followed by the moderately acidic category (25.75 per cent), electrical conductivity was negligible in soils, organic carbon was found to be moderate to high, availablenitrogen, phosphorus, and potassium varied from low to high. The soils in mountainous places have high organic carbon content due to the sluggish rate of mineralization caused by the lower temperature. Farmers and policymakers are suggested to utilize the fertile soils of the mountainous regions for crop intensification and diversification, facilitating the implementation of piedmont plain conservation strategies in these locales. Furthermore, in developing site-specific crop management plans, GIS-based thematic maps of soil characteristics can serve as a valuable reference to enhance the productivity, profitability, and sustainability of piedmont plain systems in the studied region.
Acknowledgment
The study is a part of a project work carried out by Assam Agricultural University, Jorhat, Assam, India in association with North Eastern Space Applications Centre, Department of Space, Government of India, Meghalaya. Financial support rendered by the Indian Space Research Organization its RESPOND programme is duly acknowledged.
Funding Sources
The author(s) received no financial support for the research, authorship, and/or publication of this article.
Conflict of Interest
The author(s) do not have any conflict of interest.
Data Availability Statement
The stud was foundation is the physico-chemical data from the soil that was analyzed in a lab.
Ethics Approval Statement
The study was participant’s right to privacy was upheld, as evidenced by the fact that their names were withheld at their request.
Informed Consent Statement
This Study did not involve human participants and thereforen informed consent was not required
Author Contributions
Rituparna Saikia and Dilip Kumar Patgiri write whole paper,
Bipul Dela, Marami Dutta and Prem Kumar prepared map, review and editing,
Sanjib Ranjan Borah and Deepsikha Gogoi review and editing
References
- John, K., Afu, S. M., Isong, I. A., Aki, E. E., Kebonye, N. M., Ayito, E. O. & Penížek, V. (2021). Mapping soil properties with soil-environmental covariates using geostatistics and multivariate statistics. International Journal of Environmental Science and Technology, 1-16.
CrossRef - Khadka, D. (2016). Assessment of relationship between soil organic matter and macronutrients, Western Nepal. Journal of Pharmaceutical, Biological and Chemical Sciences, 3, 4-12.
- Singh, Y. V., Singh, S. K., Sharma, P. K., Meena, R., &Shahi, S. K. (2017). Soil fertility status of Village Dadhorpur, Arajiline Block, District Varanasi, Uttar Pradesh, India. Technofame-AJ Multidisciplinary Adv Res, 6(1), 114-119.
- Singh, Y. V., Singh, S. K., Sahi, S. K., Verma, S. K., Yadav, R. N., & Singh, P. K. (2016). Evaluation of soil fertility status from Milkipur village, Arajiline block, Varanasi, district, Uttar Pradesh, in relation to soil characteristics. Journal of Pure and Applied Microbiology, 10(2), 1455-1461.
- Singh YP, Sharma D, Tiwari BPSR and RJ (2021) Relation of Soil Fertility Status and Physicochemical Properties of Pearl millet €“Mustard Cropping System of Gird Region of Northern Madhya Pradesh. Journal of the Indian Society of Soil Science 69:1-8.
CrossRef - Lindén, L., Riikonen, A., Setälä, H., & Yli-Pelkonen, V. (2020). Quantifying carbon stocks in urban parks under cold climate conditions. Urban Forestry & Urban Greening, 49, 126633. https://doi.org/10.1016/j.ufug.2020.126633
CrossRef - Nair, R., Mehta, C. R., & Sharma, S. (2015). Carbon sequestration in soils: A review. Agricultural Reviews, 36.
CrossRef - Asabere, S. B., Zeppenfeld, T., Nketia, K. A., & Sauer, D. (2018). Urbanization leads to increases in pH, carbonate, and soil organic matter stocks of arable soils of Kumasi, Ghana (West Africa). Frontiers in Environmental Science, 6, 1-11.
CrossRef - Bharteey, P. K., Singh, Y. V., Sukirtee, P. S., Kumar, M., & Rai, A. K. (2017). Available macro nutrient status and their relationship with soil physico-chemical properties of Mirzapur District of Uttar Pradesh, India. International Journal of Current Microbiology and Applied Sciences, 6(7), 2829-2837.
CrossRef - Bharteey, P. K., Deka, B., Dutta, M., Goswami, J., & Saikia, R. (2023). Geospatial variability of soil physico-chemical properties of Moridhal watershed in Dhemaji district of Assam, India using remote sensing and GIS. Annals of Plant and Soil Research, 25(1), 99-109.
CrossRef - Havlin, H. L., Beaton, J. D., Tisdale, S. L., & Nelson, W. L. (2010). Soil Fertility and Fertilizers: An Introduction to Nutrient Management (7th ed.). New Delhi, India: PHI Learning Private Limited.
- Khadka, D., Lamichhane, S., Amgain, R., Joshi, S., Shree, P., Kamal, S. A. H., &Ghimire, N. H. (2019). Soil fertility assessment and mapping spatial distribution of Agricultural Research Station, Bijayanagar, Jumla, Nepal. Eurasian Journal of Soil Science, 8(3), 237-248.
CrossRef - Barooah, A., Bhattacharyya, H. K., &Chetri, K. B. (2020). Assessment of soil fertility of some villages of Lahowal block, Dibrugarh, India. International Journal of Current Microbiology and Applied Sciences, 9(8), 1438-1450.
CrossRef - Black, C. A. (1965). Methods of soil analyses. Madison, Wisconsin, USA: 1-2: 1572.
CrossRef - Richards, L. A. (1948). Pressure membrane apparatus, construction and use. Agricultural Engineering, 28, 451-454.
- Jackson, M. L. (1973). Soil Chemical Analysis (2nd Indian Print). New Delhi, India: Prentice-Hall of India Pvt. Ltd., 38, 336.
- Walkey, A. J., & Black, C. A. (1934). An examination of the Degtijaraffs method of determining soil organic matter and a proposed for modification of the Chromic and titration method. Soil Science, 37, 29-38.
CrossRef - Subbiah, B. V., &Asija, G. L. (1956). A rapid procedure for the determination of available nitrogen in soils. Current Science, 25, 259-260.
- Bray, R. H., & Kurtz, L. T. (1945). Determination of total, organic, and available forms of phosphorus in soils. Soil Science, 59(1), 39-46.
CrossRef - Hanway JJ, Heidel H. Soil analysis methods as used in Iowa State College soil testing laboratory. Iowa Agric. 1952;57.
- Snedecor, G. W., & Cochran, W. G. (1967). Statistical Methods. Calcutta, India: Oxford and IBH Publ. Co., pp. 135-198.
- Hokinson, I., &Lipiec, J. (2000). A review of the usefulness of relative bulk density values in studies of soil structure and compaction. Soil Tillage Research, 53, 71–85.
CrossRef - Deka, B., Baruah, T. C., Dutta, M., & Karmakar, R. M. (2009). Landscape-soil relationships and pedogenic evaluation of soils in Ghiladhari watershed of the Brahmaputra valley of Assam. Journal of the Indian Society of Soil Science, 57(3), 245-252.
- Deka, B., Baruah, T. C., Dutta, M., & Patgiri, D. K. (2012). Fertility potential classification of soils in different landscape units of the northern Brahmaputra valley zone of Assam. Journal of the Indian Society of Soil Science, 60(2), 92-100.
- Tanveera, A., Tasawoor, A., Parvaiz, A., &Mehrajuddin, N. (2016). Relation of soil bulk density with texture, total organic matter content and porosity in the soils of Kandi area of Kashmir valley, India. International Research Journal of Earth Sciences, 4(1), 1-6.
- Perie, C., & Ouimet, R. (2007). Organic carbon, organic matter and bulk density relationships in boreal forest soils. Canadian Journal of Soil Science, 88, 315-325.
CrossRef - Sakin, E., Deliboran, A., & Tutar, E. (2011). Bulk density of the Harran Plain soils in relation to other soil properties. African Journal of Agricultural Research, 6(7), 1750-1757.
- Kutilek, M. (2004). Soil hydraulic properties as related to soil structure. Soil Tillage Research, 75, 175–184.
CrossRef - Pagliai, M., & Vignozzi, N. (2002). Image analysis and microscopic techniques to characterize soil pore system. In J. Blahovec& M. Kutilek (Eds.), Physical Methods in Agriculture (pp. 13–38). London: Kluwer Academic Publishers.
CrossRef - Deka, B.; Baruah, T.C.; Dutta, M. and Neog, P. (2011). Soil loss estimation on RS data and GIS techniques in Ghiladhari watershed of Northern Brahmaputra Valley in Assam. J. of Soil and Water Conserv. 10(2): 123-128.
- Patgiri, D. K., & Dutta, K. (1993). Forms and distribution of phosphorus in some tea growing soils. J. Indian Soc. Soil Sci., 41(2), 346-348.
- Verma, V. K., Bahuguna, A., Bharteey, P. K., Singh, G. R., Luthra, N., & Pal, S. (2023). Assessment of soil fertility status in Marori Block of Pilibhit District, Uttar Pradesh, India. International Journal of Environment and Climate Change, 13(11), 1012-1025.
CrossRef - Larson, W. E., & Pierce, F. J. (1991). Conservation and Enhancement of Soil Quality: Evaluation for Sustainable Land Management in the Developing World (Vol. 2). Bangkok, Thailand: International Board for Soil Research and Management.
- Cannell, R. Q., & Hawes, J. D. (1994). Trends in tillage practices in relation to sustainable crop production with special reference to temperate climates. Soil Tillage Research, 30, 245-282.
CrossRef - Borgohain, S., Deka, B., Dutta, M., Thakuria, R. K., & Patgiri, D. K. (2021). Geospatial assessment of water-induced soil and nutrient erosion in Pabho watershed of Assam, India using USLE model. Journal of Environmental Biology, 42, 406-413.
- Schimel, D. S. (1986). Carbon and nitrogen turnover in adjacent grassland and cropland ecosystems. Biogeochemistry, 357, 345–357.
CrossRef - Booth, M. S., Stark, J. M., & Rastetter, E. (2005). Controls on nitrogen cycling in terrestrial ecosystems: A synthetic analysis of literature data. Ecological Monographs, 75, 139–157.
CrossRef - Basumatary, A., Rashmi, B., &Medhi, B. K. (2014). Spatial variability of fertility status of soils of upper Brahmaputra valley zone of Assam. Asian Journal of Soil Science, 9(1), 142-148.
- Basumatary, A., & Bordoloi, P. K. (1992). Forms of potassium in some soils of Assam in relation to soil properties. J. Indian Soc. Soil Sci., 40(3), 443-446.


