Studies on Sediment Chemistry of River Yamuna with Special Reference to Industrial Effluents in Yamuna Nagar, India
Priyanka Malhotra1 * , Girish Chopra1 and Anita Bhatnagar1
1
Department of Zoology,
Kurukshetra University,
Kurukshetra,
136119
India
DOI: http://dx.doi.org/10.12944/CWE.9.1.30
Copy the following to cite this article:
Malhotra P, Chopra G, Bhatnagar A. Studies on Sediment Chemistry of River Yamuna with Special Reference to Industrial Effluents in Yamuna Nagar, India. Curr World Environ 2014;9(1) DOI:http://dx.doi.org/10.12944/CWE.9.1.30
Copy the following to cite this URL:
Malhotra P, Chopra G, Bhatnagar A. Studies on Sediment Chemistry of River Yamuna with Special Reference to Industrial Effluents in Yamuna Nagar, India. Curr World Environ 2014;9(1). Available from: http://www.cwejournal.org/?p=5837
Download article (pdf)
Citation Manager
Publish History
Select type of program for download
| Endnote EndNote format (Mac & Win) | |
| Reference Manager Ris format (Win only) | |
| Procite Ris format (Win only) | |
| Medlars Format | |
| RefWorks Format RefWorks format (Mac & Win) | |
| BibTex Format BibTex format (Mac & Win) |
Article Publishing History
| Received: | 2014-02-18 |
|---|---|
| Accepted: | 2014-03-19 |
Global climate change and continues over load of pollution along with effluents from different industries have attracted various researchers to analyse the geochemical studies of river system (Torimanet al., 2009, Gashiet al., 2009). India has ten major river systems among which Yamuna is the largest tributary river of Ganges in north India (Negiet al., 1991).Yamuna nagar (300 6’ N latitude and 770 17’ E longitude) is an important industrial city of Haryana.Along its paththrough Yamuna nagar, Yamuna riverget effluents from various industries like sugar mills, timber factories, paper industries etc. and sewage via.maskaranala.In a river system, stream sediments have been widely used as environmental indicators and their chemical analysis can provide significant information for the assessment of anthropogenic activities and extent of pollution. Sediments also play an important role in the environmental studies of the rivers as they have long residence time for their interaction with the biotic components of the river’s ecosystem(Forstner and Wittmann, 1983). They play important role in nutrient cycle of aquatic environments and transport of essential nutrients as well as pollutants. Water quality index is an excellent management and general administrative tool in communicating water quality information and also plays important role in assessment of water resources for their suitability with reference to various uses (Chopra et al., 2014). In the present studies water quality indices of river Yamuna is correlated with its sediment chemistry. Some studies have been undertaken to assess the water quality of river Yamuna (Chopra et al., 2012,Bhatnagaret al., 2013) but studies dealing with sediment chemistry of river Yamuna with special reference to industrial effluents are very scanty. To reveal the effects of effluents on the sediment chemistry of river Yamuna, present studies have been conducted.
Materials and Methods
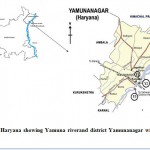
Bearing in mind the pollution load, three sampling stations Y1, Y2 and Y3 were selected along the river stretch to perform practical aspects. Station Y1 is located near the village Kalanaur in district Yamunanagar at the upstream of the river, without any industrial discharge. This point is bathing and washing centre for the people of the village. StationY2 is stationed 4-5 Kms downstream from station Y1. Here the effluents channels carrying industrial effluents via. maskaranala joins the river. Station Y3 point is stationed 5 Kms downstream from the station Y2 (Fig.1).
Sediment samples were collected in polythene bags in triplicate on seasonal basis. Percentage moisture, electrical conductivity and pH were determined immediately, whereas for other physicochemical parameters i.e. soil alkalinity and chlorides, nitrate and organic matter, sediment was left to dry at air temperature and analysed according to standard procedures (Goltermanet al., 1978; APHA, 1998) within the following 3 to 4 days. pH and conductivity were analyzed using MultiSet F Line three Water analysis kit (E Merck). Alkalinity, chlorides and organic matter were analysed by titrimetric method. Nitrate was determined spectrophotometerically (APHA, 1998). Brian Oram’s Water quality Index (WQI A) and Kaur’s Water Quality Index (WQI B) was calculated by using parameters such as pH, DO, BOD, Turbidity, alkalinity, calcium, magnesium, sulphate, chloride and nitrate of collected water samples from selected sites as per the standard references of Oram (2007) and Kaur et al. (2001).
 |
Figure 1: Map of Haryana showing Yamuna riverand district Yamuna Nagar with selected stations. Click here to View Figure |
Results and Discussion
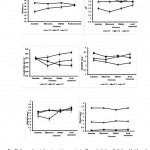
Moisture content depicted the water holding capacity of the sediments. During the present assessment of sediment quality, the maximum value of moisture was recorded during winter at stations Y2 and minimum during summer at Y1. The percentage of moisture significantly increased from station Y1 to Y2 and then decreased at station Y3(Table.1, Fig. 2).pH of the sediments was found to be alkaline throughout the study period. pH values increased from station Y1 to Y3. Seasonal fluctuations were well marked. Maximum values were recorded in post monsoon at station Y1 and Y3 while during summer at station Y2. Minimum values were during monsoon at station Y1 and Y3 and during winter at station Y2. Kaur et al. (1997), Tareqet al. (2013) also recorded high pH values during summer and low values during monsoon months. The values of conductivity varied between 200 to 215 µmhos cm-1. The highest value of conductivity was recorded during summer at station Y1 and Y2 and during post monsoon at station Y3 whereas; lowest during monsoon at station Y1, post monsoon at station Y2 and summer at station Y3. Maximum value of conductivity in summer and minimum in monsoon was also recorded by Bath and Kaur (1999), Singh et al. (2007) and Singh et al. (2013). The values of conductivity decreased from station Y1 to Y2 and then increased at Y3.Dilution of water during the rains caused a decrease in electrical conductance even of sediment. The mean values of alkalinity ranged between 3.3 mg g-1 to 4.1 mg g-1. Maximum alkalinity was recorded during summer at station Y2 and minimum during winter at station Y1. Similar trend were also recorded by Shastreeet al. (1991) and Kaur et al. (1997). The values of alkalinity increased from station Y1 to Y2 and then decreased at station Y3 (Table.1, Fig. 2).
 |
Figure 2: Seasonal variations in moisture content, pH, conductivity, alkalinity, chloride and nitrate of sediments of river Yamuna at various stations. Click here to View Figure |
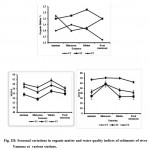
Maximum value of chloride was recorded during post monsoon at station Y3 and minimum during monsoon at station Y1. Increase in the values during post monsoon may be due to decrease in water volume and increase in evaporation rate while decrease during monsoon may be due to dilution of water (Mandal and Das, 2011). Sewage water and industrial effluents are rich in chloride content and discharge of these waste waters results in greater chloride level in fresh waters (Guo-Qian and Niepin, 2000; Prabaharet al., 2012). The chloride content showed an increasing trend from station Y1 to Y2 and Y3 (Table.1, Fig. 2). The mean values of nitrate ranged between 0.2 mg g-1 (Y2) to 3.2 mg g-1 (Y3) during the study period. Nitrate showed a significant (P<0.05) decreasing trend from Y1 to Y2 and then increased at station Y3 (Table.1, Fig. 2).The maximum value was recorded during summer, monsoon and post monsoon at station Y3 while minimum during summer and winter at station Y2. Nitrate did not show any definite seasonal pattern. Organic matter increased from station Y1 to Y2 and then decreased at Y3 (Table.1, Fig. 3).
 |
Figure 3: Seasonal variations in organic matter and water quality indices of sediments of river Yamuna at various stations. Click here to View Figure |
Maximum organic matter was recorded during winter at station Y2. Generally high values of nutrients and organic matter reflect a constant supply from sewage input (Bath and Kaur, 1999). The increase in the values of organic matter at Y2 may be due to influx of effluents through maskaranala at station Y2 (Singh et al., 2013).
Table 1: Mean values of sediment chemistry and water quality index (Mean ± S.E of mean) of river Yamuna at various stations
| Y1 | Y2 | Y3 | |
| Moisture% | 45.4±0.36C | 48.9±0.09A | 46.9±0.12B |
| pH | 7.3±0.03B | 7.5±0.02A | 7.5±0.02A |
| Conductivity µ m cm-1 | 203±2.94B | 200±3.25B | 215±2.76A |
| Alkalinity mg g-1 | 3.3±0.08B | 4.1±0.09A | 4.0±0.11A |
| Chloride mg g-1 | 2.2±0.12A | 2.4±0.03A | 2.4±0.07A |
| Nitrate mg g-1 | 1.4±0.04B | 0.2±0.02C | 3.2±0.06A |
| Organic matter % | 2.8±0.09B | 3.4±0.06A | 3.1±0.10AB |
| WQI A | 60±0.50A | 56±0.50B | 58±0.52A |
| WQI B | 67.4±2.8A | 39.9±4.3B | 47.5±3.0B |
According to Brian Oram’s water quality index(WQI A) maximum value was recorded at station Y1 and minimum at station Y2. Kaur’s water quality index (WQI B) also showed the similar trend of high value at Y1 and low at Y2. The present investigation revealed that the water was of ‘bad quality’ according to Brian Oram’s and severely polluted as per the indexing of Kaur’s water quality at station Y2 (Table.1, Fig. 3). The low values of water quality index indicating that water was being polluted at point of influx of effluents.The correlation studies showed the significant positive correlation between chloride and pH whereas significant negative correlation between organic matter and WQI A (Table. 2). Correlation statistics revealed that with increase in organic matter water quality of river is deteorating. High values of some physico chemical parameters of sediments at station Y1 and Y3 may be due to relatively more anthropogenic activities at these stations.
Table 2: Correlation between parameters of sediment chemistry and water quality indices
| Parameters | Moisture | pH | Cond. | Alkalinity | Chloride | Nitrate | Organic matter | WQI A | WQI B |
| Moisture | 1 | .822 | -.269 | .882 | .822 | -.471 | .997 | -.997 | -.944 |
| pH | - | 1 | .327 | .993 | 1.0** | .115 | .866 | -.866 | -.964 |
| Cond. | - | - | 1 | .217 | .327 | .976 | -.189 | .189 | -.063 |
| Alkalinity | - | - | - | 1 | .993 | .000 | .918 | -.918 | -.988 |
| Chloride | - | - | - | - | 1 | .115 | .866 | -.866 | -.964 |
| Nitrate | - | - | - | - | - | 1 | -.397 | .397 | .155 |
| Organic | - | - | - | - | - | - | 1 | -1.0** | -.968 |
| WQI A | - | - | - | - | - | - | - | 1 | .986 |
| WQI B | - | - | - | - | - | - | - | - | 1 |
Conclusion
Study of different limno chemical parameters and organic matter of sediment samples revealed that the intensity of pollution increased as the river was subjected to sewage and industrial wastes. In the growing awareness of relationships between human health and water pollution, it is essential to undertake regular monitoring and surveillance of important aquatic ecosystems. In order to manage the pollution load of river Yamuna pass nearby Yamunanagar, it is recommended that various methods of sewage/industrial wastes treatment should be used before the disposal of effluents.
Acknowledgment
The corresponding author is highly grateful to the chairman of department of zoology, Kurukshetra University, Kurukshetra for providing essential chemicals and laboratory facilities for the present work.
References
- APHA, AWWA, WPCF, Standard methods for the examination of water and waste water.American Public Health Association, (American Public Health Association, New York).DC20005-2605(1998).
- Bath, K.S. and Kaur, H., Physicochemical characteristics of water of Buddha-Nallah (Ludhiana, Punjab),Ind. Jr. Env.Sci., 3(1), 27-30(1999).
- Bhatnagar, A., Chopra, G. and Malhotra, P., Assessment of water quality of river Yamuna in Yamunanagar, India with reference to planktons and macrozoobenthos, Sch. Jr. Eng. Tech.,1(4), 204-213(2013).
- Chopra, G.,Bhatnagar, A. and Malhotra P., Limnochemical characteristics of river Yamuna in Yamunanagar, Haryana, India, Inter. Jr. Water Res. Environ Eng., 4(4), 97-104(2012).
- Chopra, G.,Bhatnagar, A., Malhotra, P. andJakhar, P., Water quality index applied to river Yamuna in Yamunanagar (Haryana) India, Inter. Jr. Innova. Res. Studies., 3(1), 145-151(2014).
- Forstner, U. andWittmann, G.T.W., Metal pollution in the aquatic environment,Spinger- Verlag, Berlin, Heidelberg, New York, 481(1983).
- Gao-Qian.andNie-Pin, Lead content in the monogenean, Ancyrocephlusmogurndae and in different organs of its host the mandarian fish, Sinipercachuatsi, J. China. Enviro.Sci., 20 (3), 23-236(2000).
- Gashi, F.,FranÄišković-Bilinski, S. andBilinski, H., Analysis of sediments of the four main rivers (DRINI I BARDHË, MORAVAE BINÇËS, LEPENC AND SITNICA) in Kosovo,Fresenius Environmental Bulletin, 18(8),1462-1471(2009).
- Golterman, H.L., Clymo, R.S. andOhnstad, M.A.M., Methods for chemical analysis of fresh water.IBP Handbook No. 8, Second Edition, Blackwell Scientific Publications, 178(1978).
- Kaur, H., Dhillon, S.S., Bath, K.S. and Mander, G., Inter-relations between physicochemical factors at Harike wetland (Punjab-India),Jr. Enviro. Poll., 4(3), 237-240(1997).
- Kaur, H.,Syal, J.and Dhillon, S.S., Water quality index of the river Satluz, Poll. Res., 20 (2), 199-204(2001).
- Mandal, H.S. and Das, A., Assessment of seasonal variation in physico-chemical characteristics and quality of Torsha River water for irrigation used in Cooch Behar and Jalpaiguri districts of West Bengal, Indian,Jr.Chem. Phar.Res.,3(6),265-270(2011).
- Negi, S. S., Himalayan Rivers, Lakes and Glaciers, Indus Publishing Co., New Delhi, 182 (1991).
- Oram, B., Wilkes university environmental engineering earth science, WQI Index- consumer support group online calculator, Retrieved September 2007 from http://www.csg network.com/ h2oqualindexcuttemponlycalc html (2007).
- Prabhahar, C.,Saleshrani, K. andTharmaraj, K., Seasonal variation in Physico-Chemical parameters of Palar river in and around Vaniyambadi segment, Vellore District, Tamil Nadu, India,Inter. Jr. Phar. Bio. Arch., 3(1), 99-104 (2012).
- Shastree, N.K., Islam, M.S., Pathak, S. andAfshan, M., Studies on the physico chemical dimensions of the centic hydrosphere of RavindraSarovar (Gaya), In: Current trends in limnology-1. Narendra Publ. House, New Delhi, 133-152(1991).
- Singh, B.K., Srivastava, K.K. and Srivastava, S.K., Water quality assessment: Part 1- Urimari area of south Karanpura coalfield,Inter. Jr. Enviro. Prot.,27 (5), 410-417(2007).
- Singh, T.A.,Meetei, N.S. and Meitei, L.B., Seasonal variation of some Physico-chemical characteristics of Three Major riversinImphal,Manipur: A Comparative Evaluation, Current world Sci., 8(1), 93-102(2013).
- Tareq, S.M.,Rahaman, M.S.,Rikta, S.Y.,Nazrul Islam, S.M. and Sultana, M.S., Seasonal variations in water quality of the Ganges and Bhramputrariver, Bangladesh,Jahangirnagar Univ. Enviro. Bull., 2, 71-82(2013).
- Toriman, E.A.,Kamarudin, M.K.A.,Idris, M.H., Jamil, N.R..,Gazim, M.B. andAbd, N.A.A., Sediment concentration and load analyses at Chini river, Pekan, Pahang Malaysia, Res. Jr. Earth Sc., 1(2), 43-50(2009).


